All talks & lectures

Conference ·

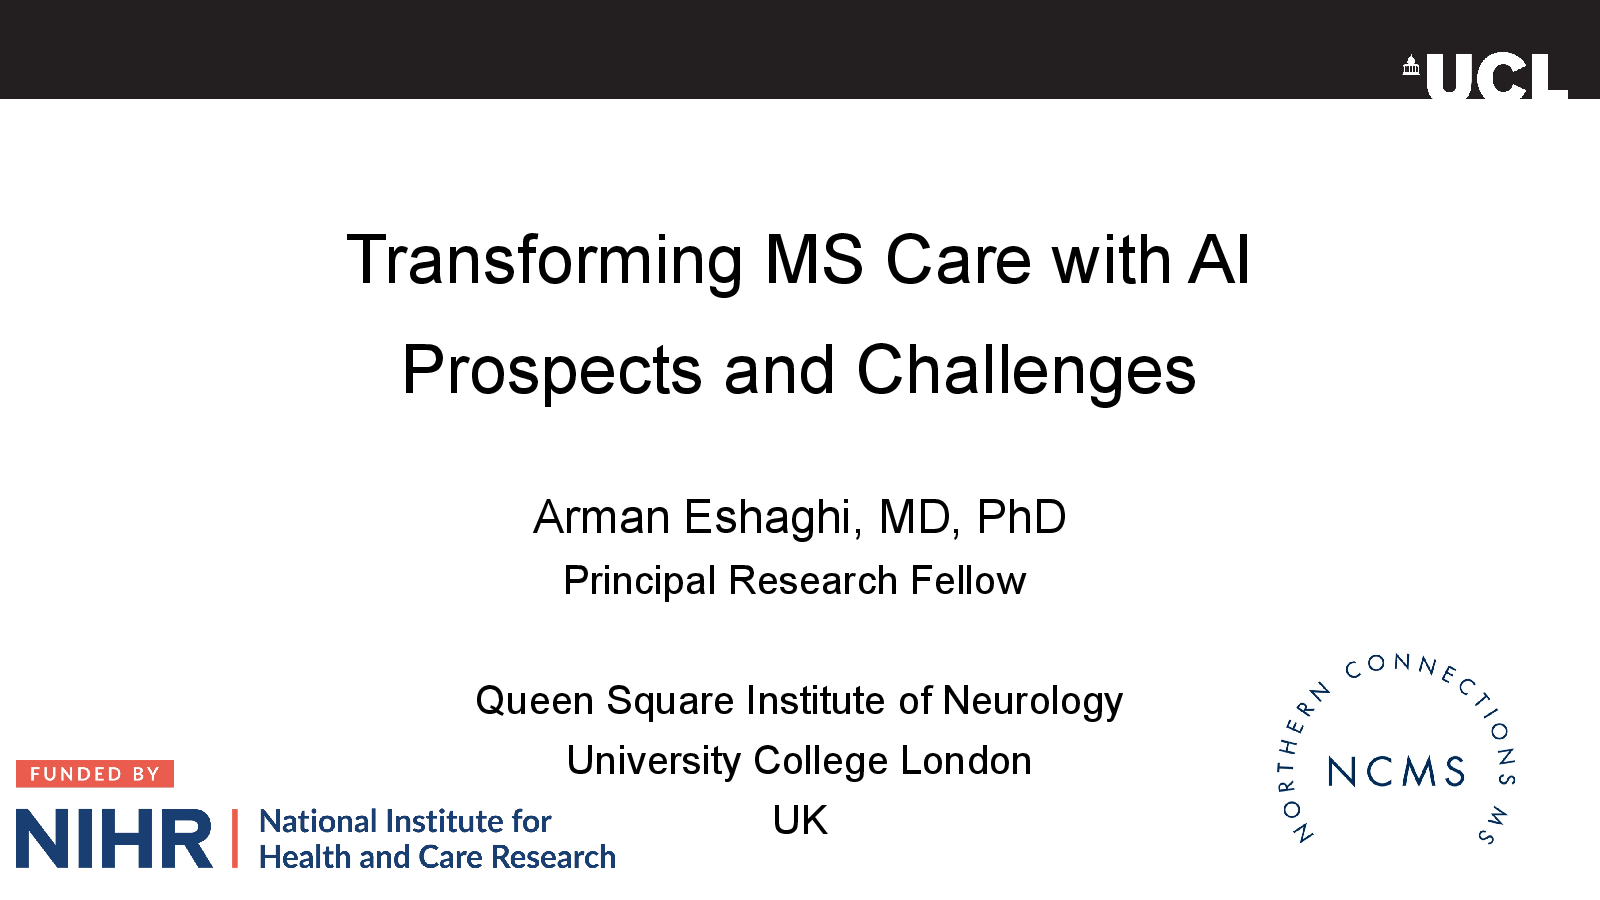
Transforming MS care with AI: prospects and challenges

A clear-eyed look at the research promise of AI in MS and the evidence still needed for routine clinical use.

Northern Connections MS Annual Meeting · Edinburgh
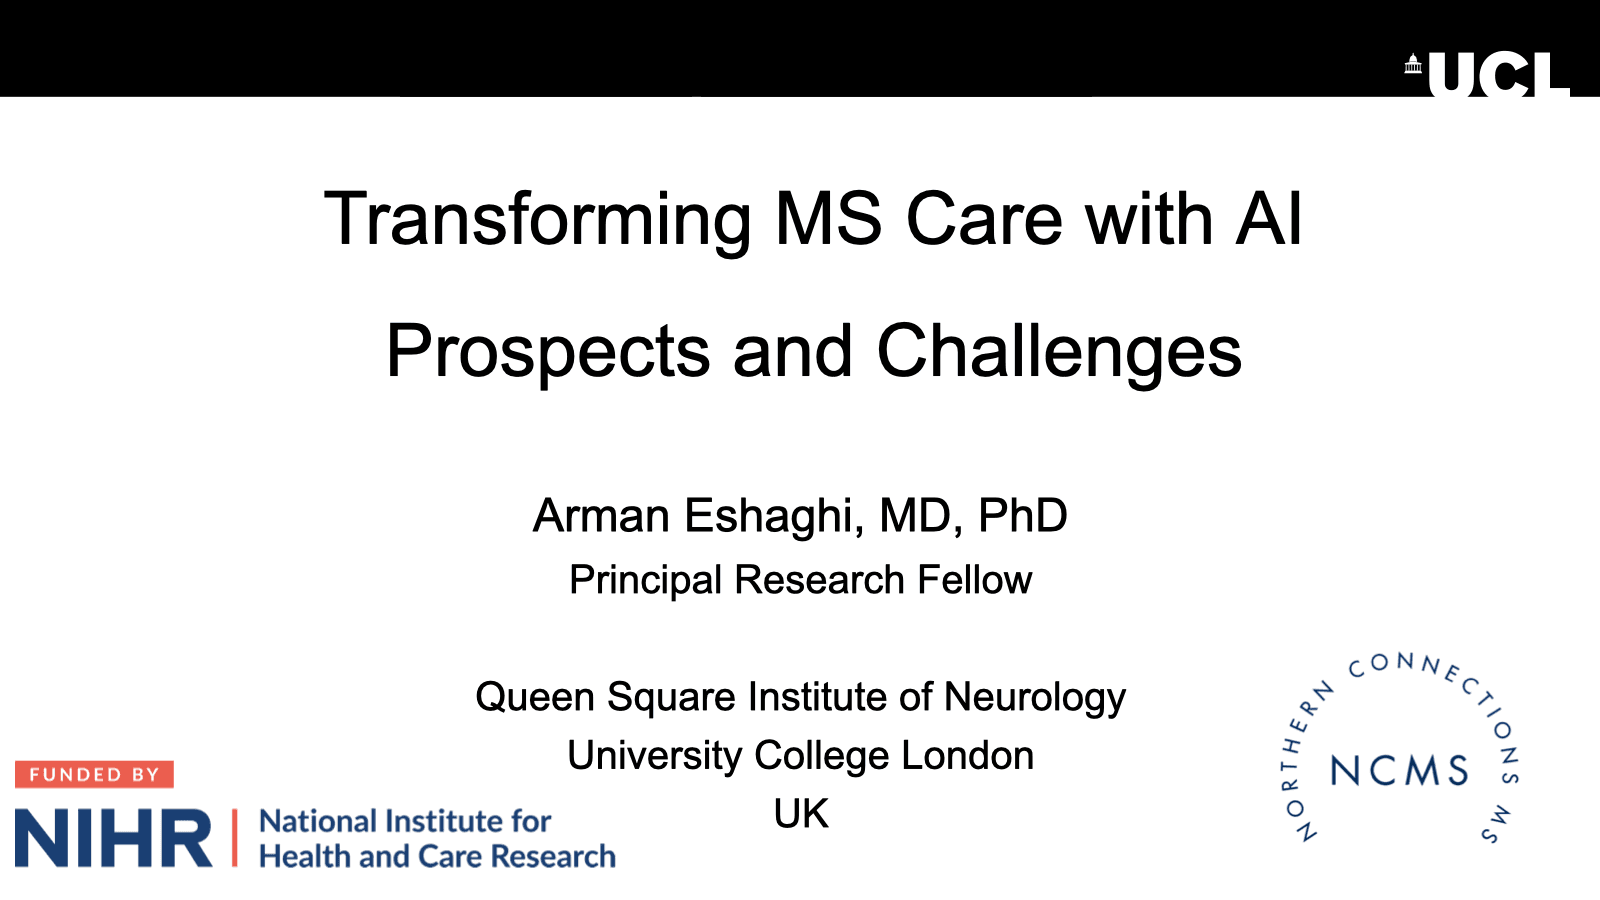
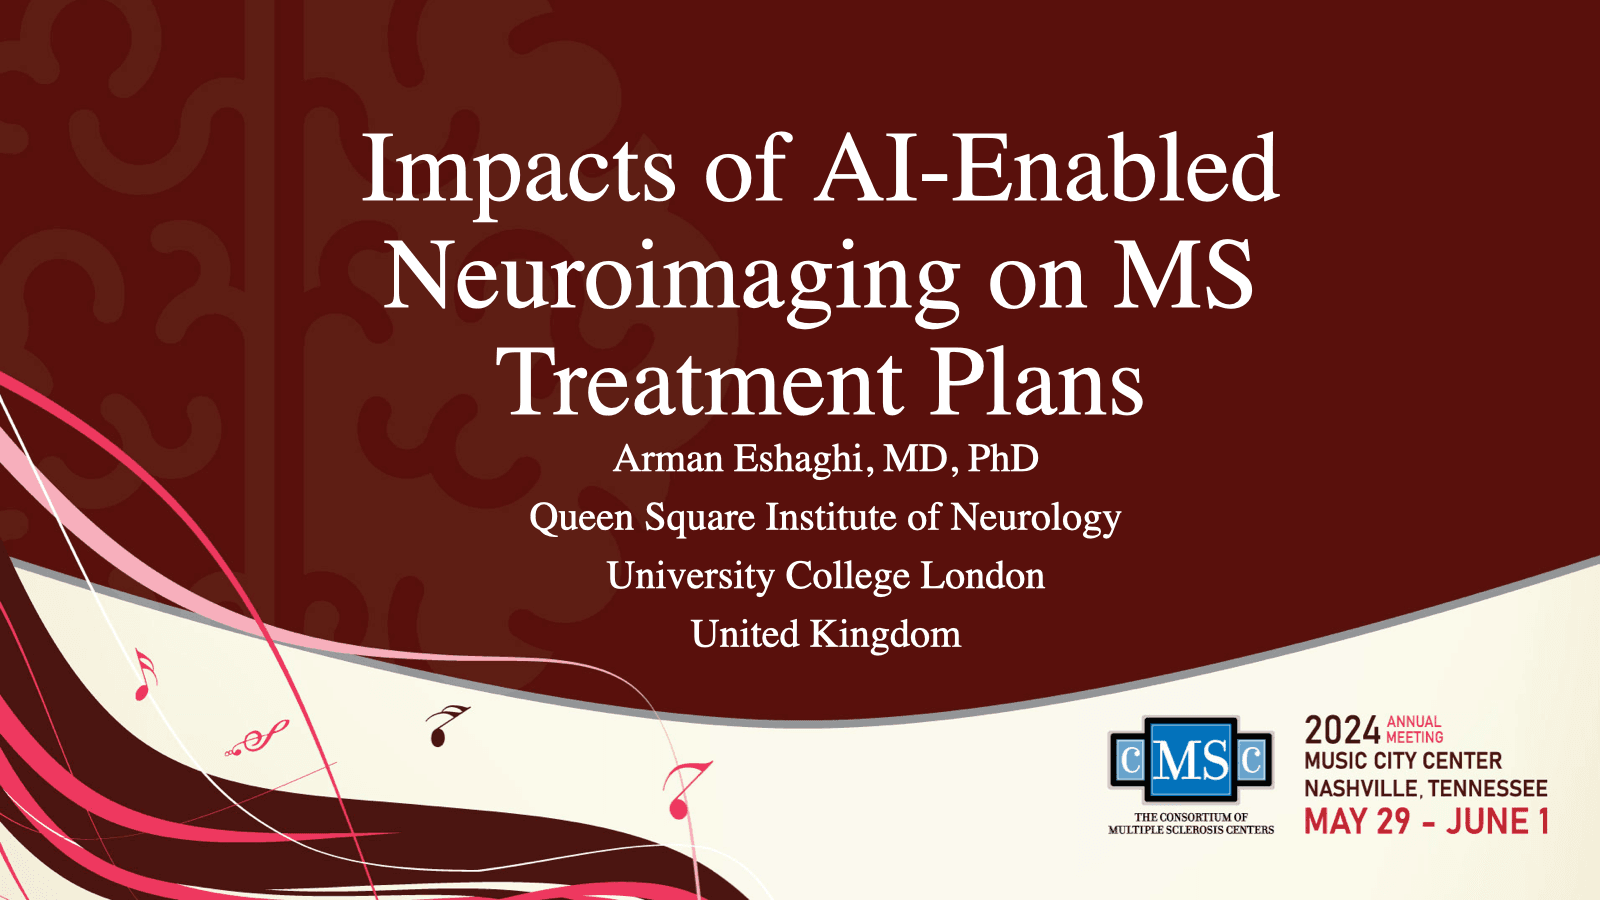
Opening slide for “Transforming MS care with AI: prospects and challenges” at Northern Connections MS Annual Meeting
Opening slide from the original presentation
Delivered
Event
Northern Connections MS Annual Meeting
Place
Edinburgh
Format
Conference
Source deck
20 slides

From the slides

Deck notes

This talk surveyed potential uses of artificial intelligence in multiple sclerosis, from disease classification to MRI monitoring. The emphasis was on separating research utility from demonstrated clinical utility.

The question

Which AI applications are mature enough to inform MS care, and which still need stronger validation?

Deck outline

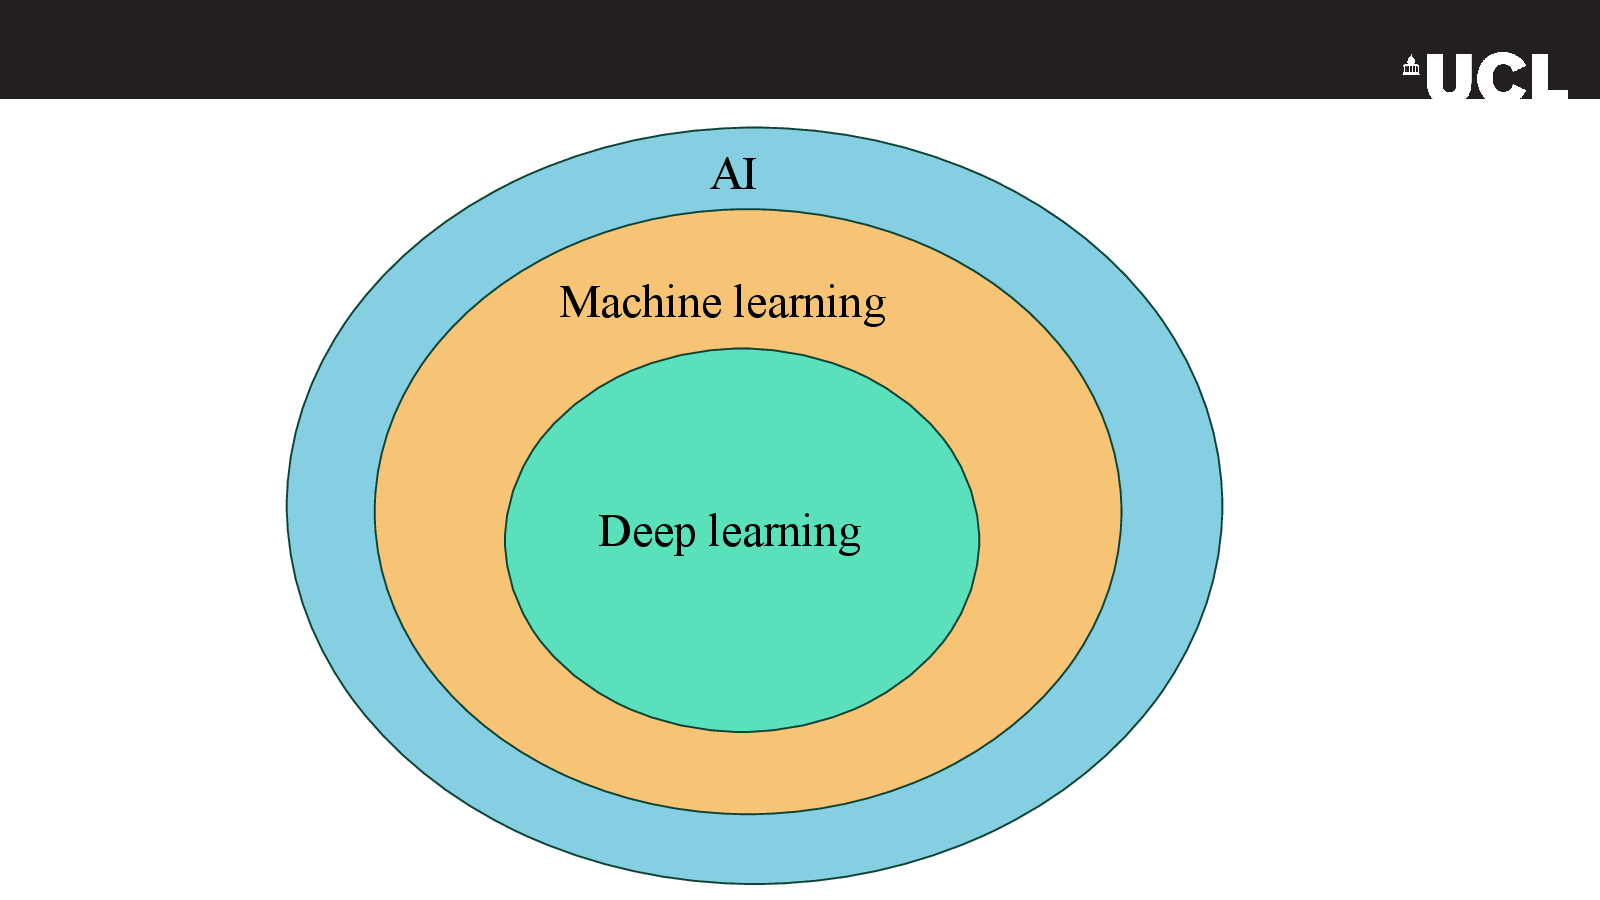
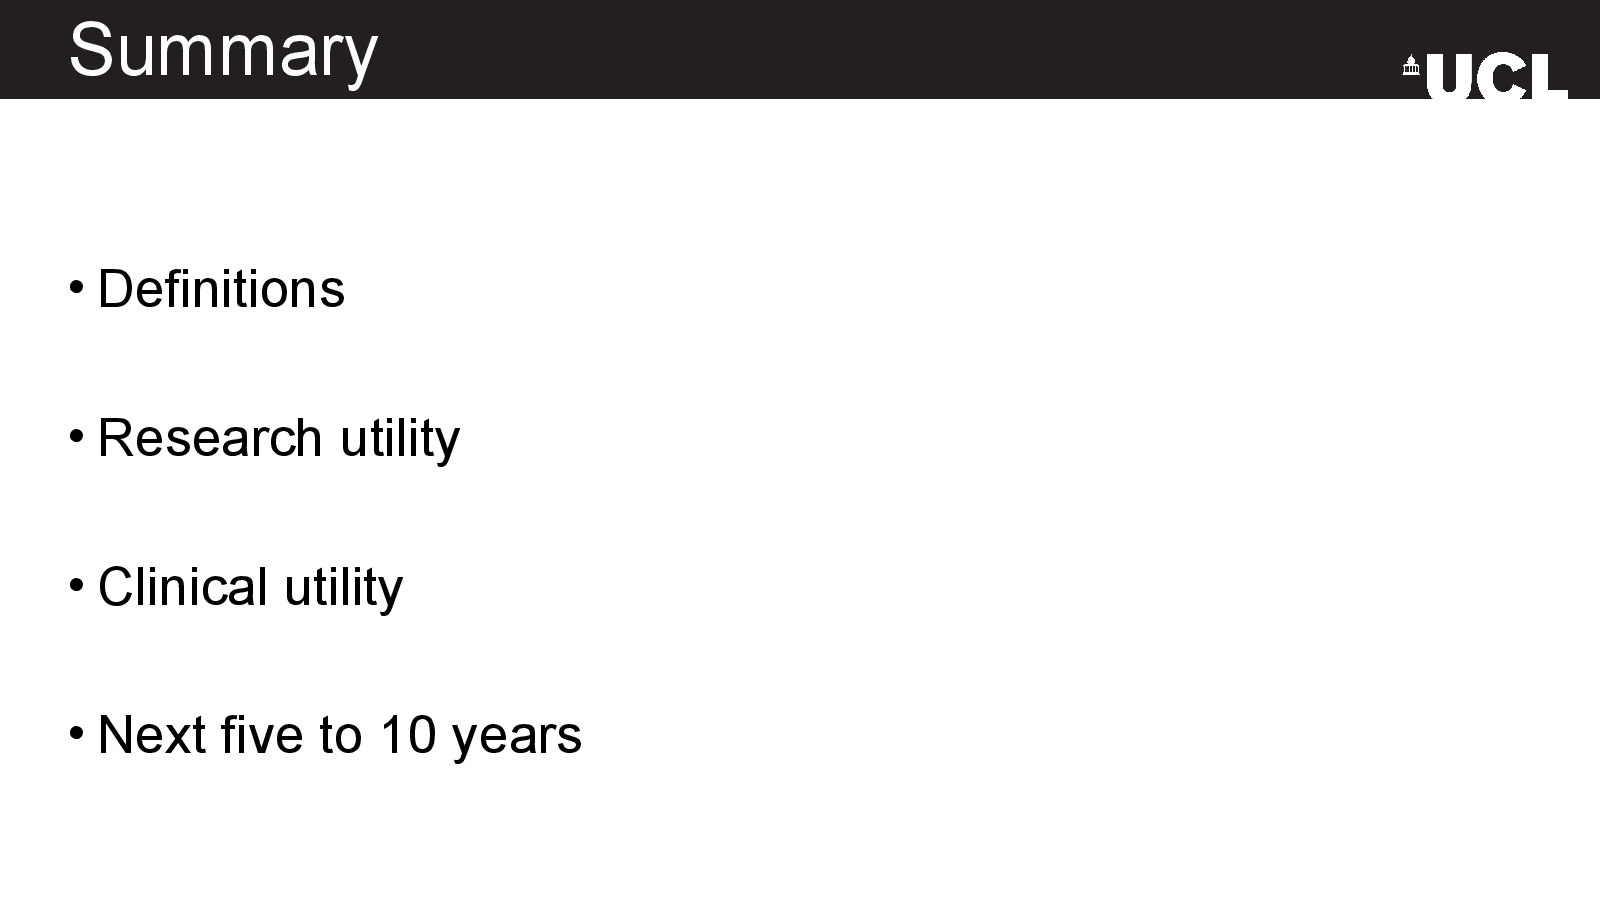
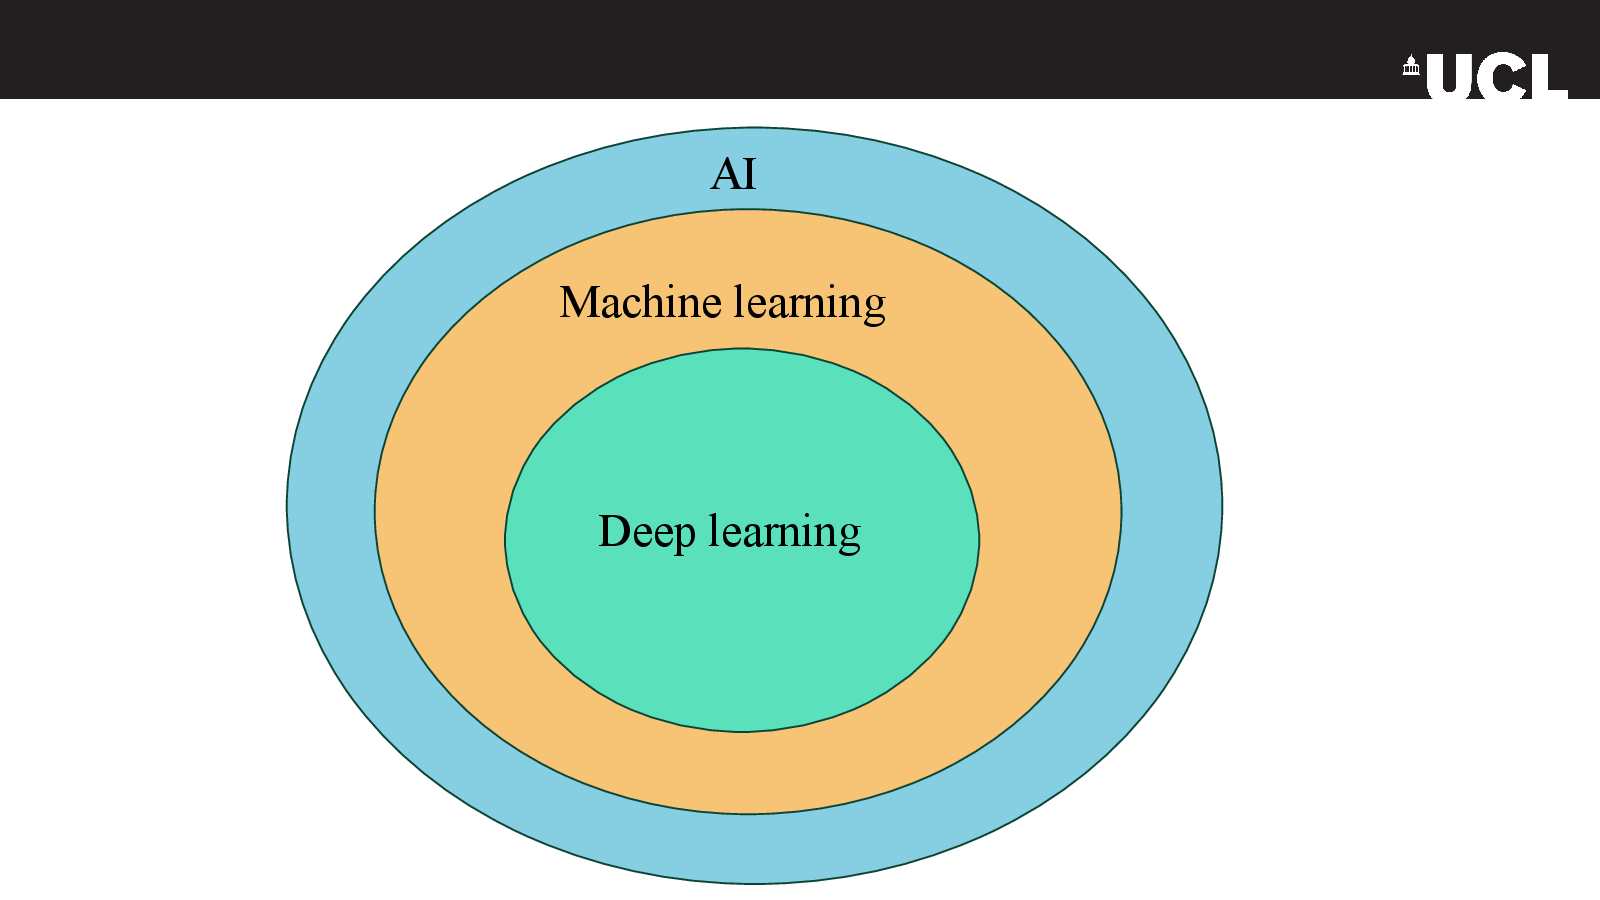
  • Core definitions in artificial intelligence and machine learning
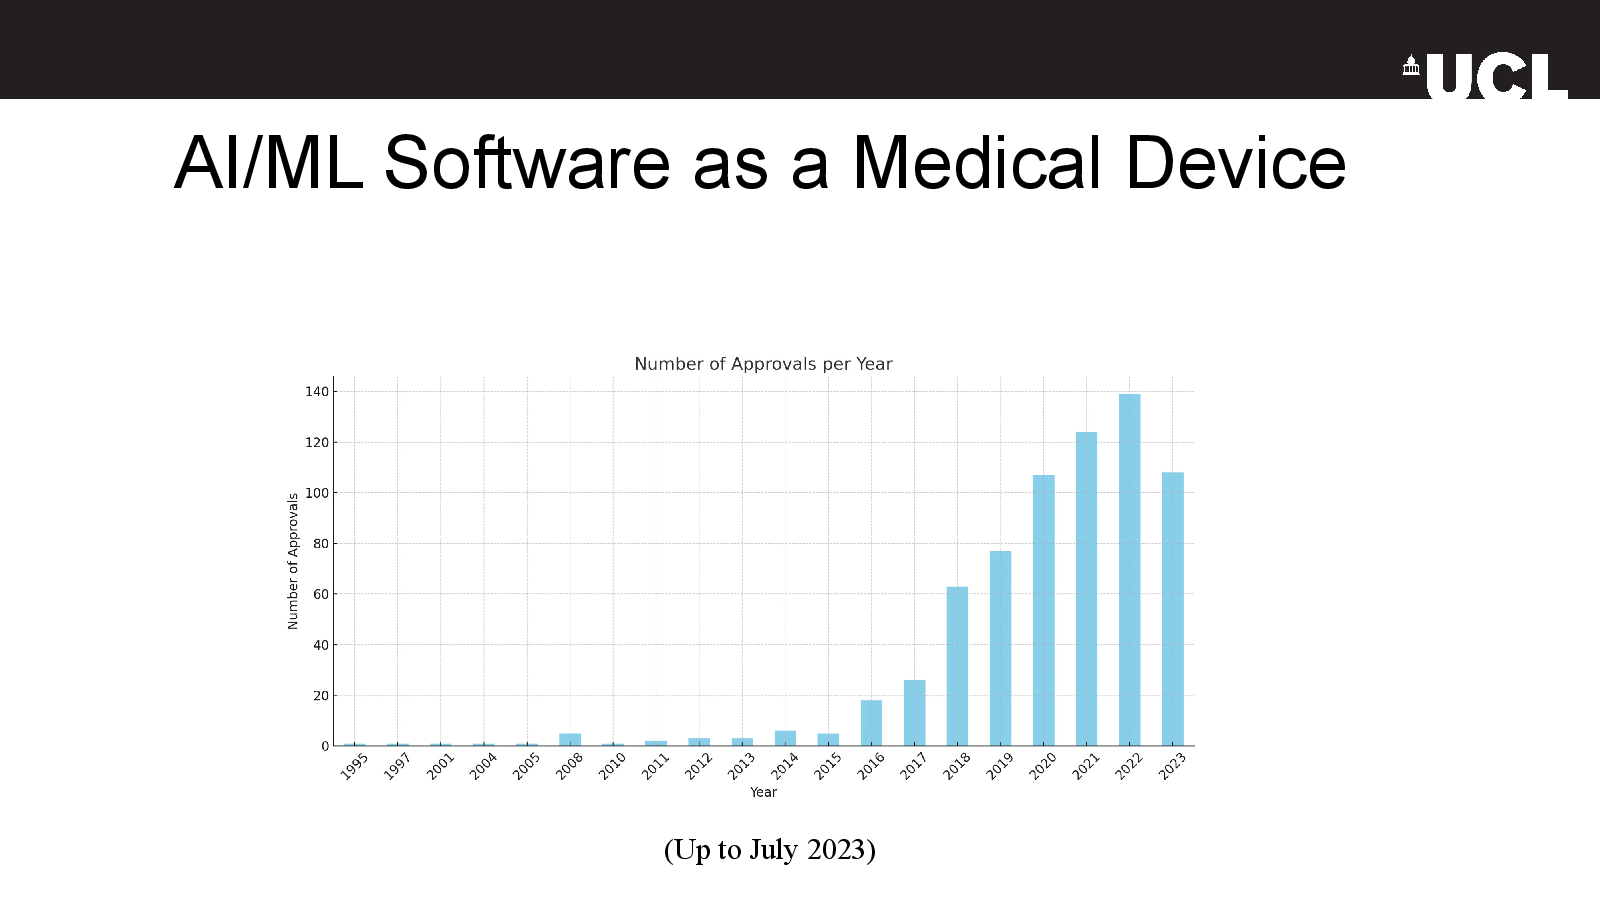
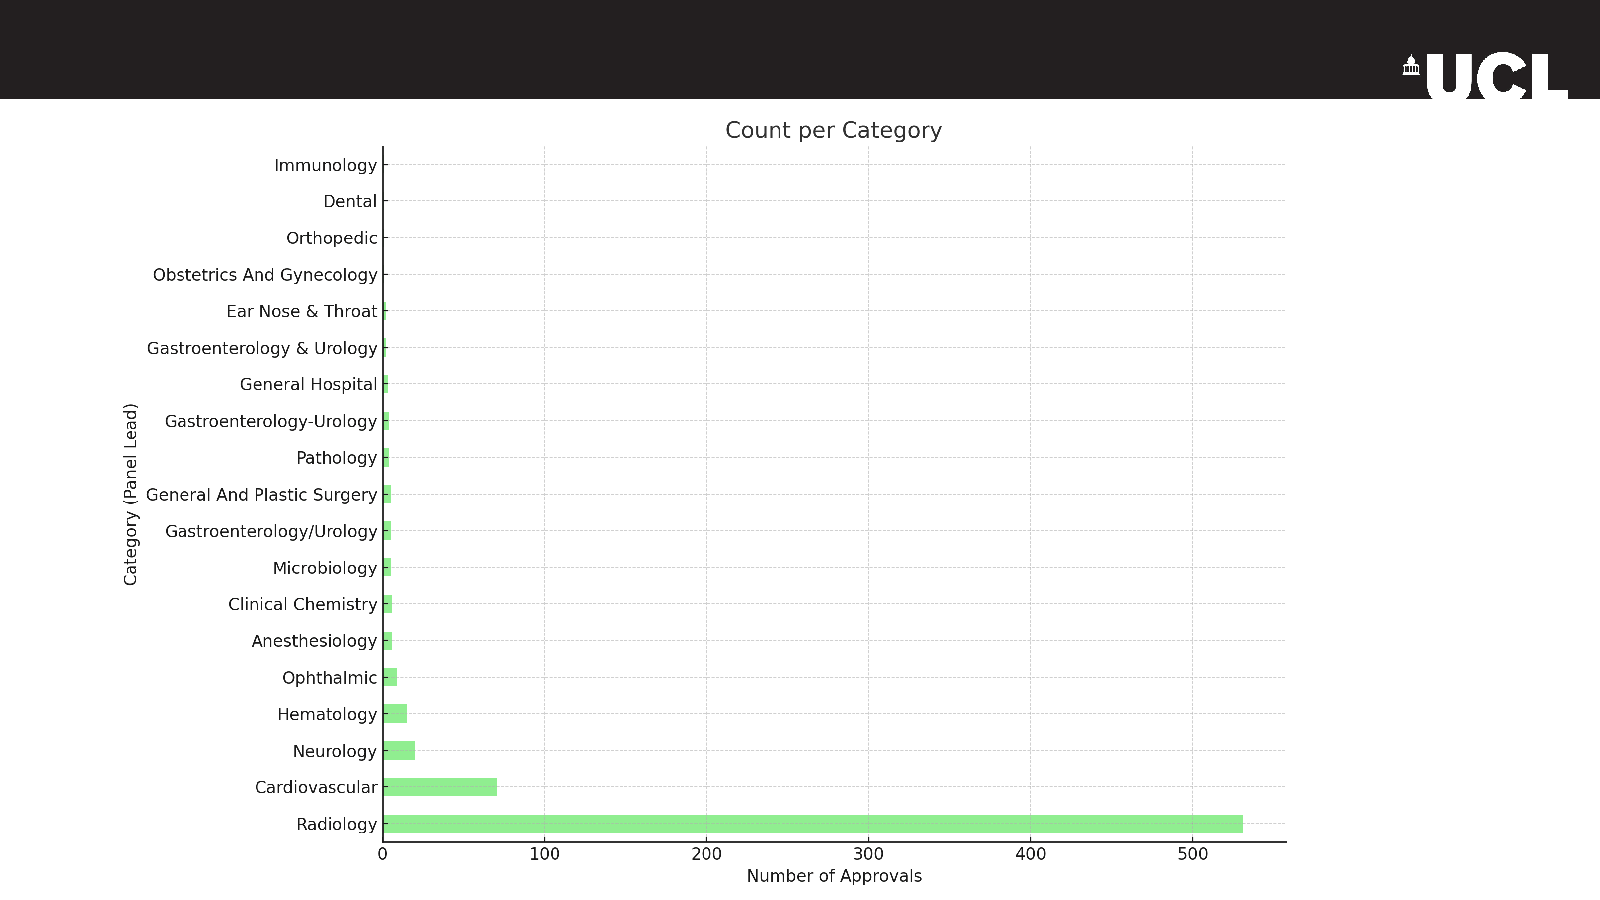
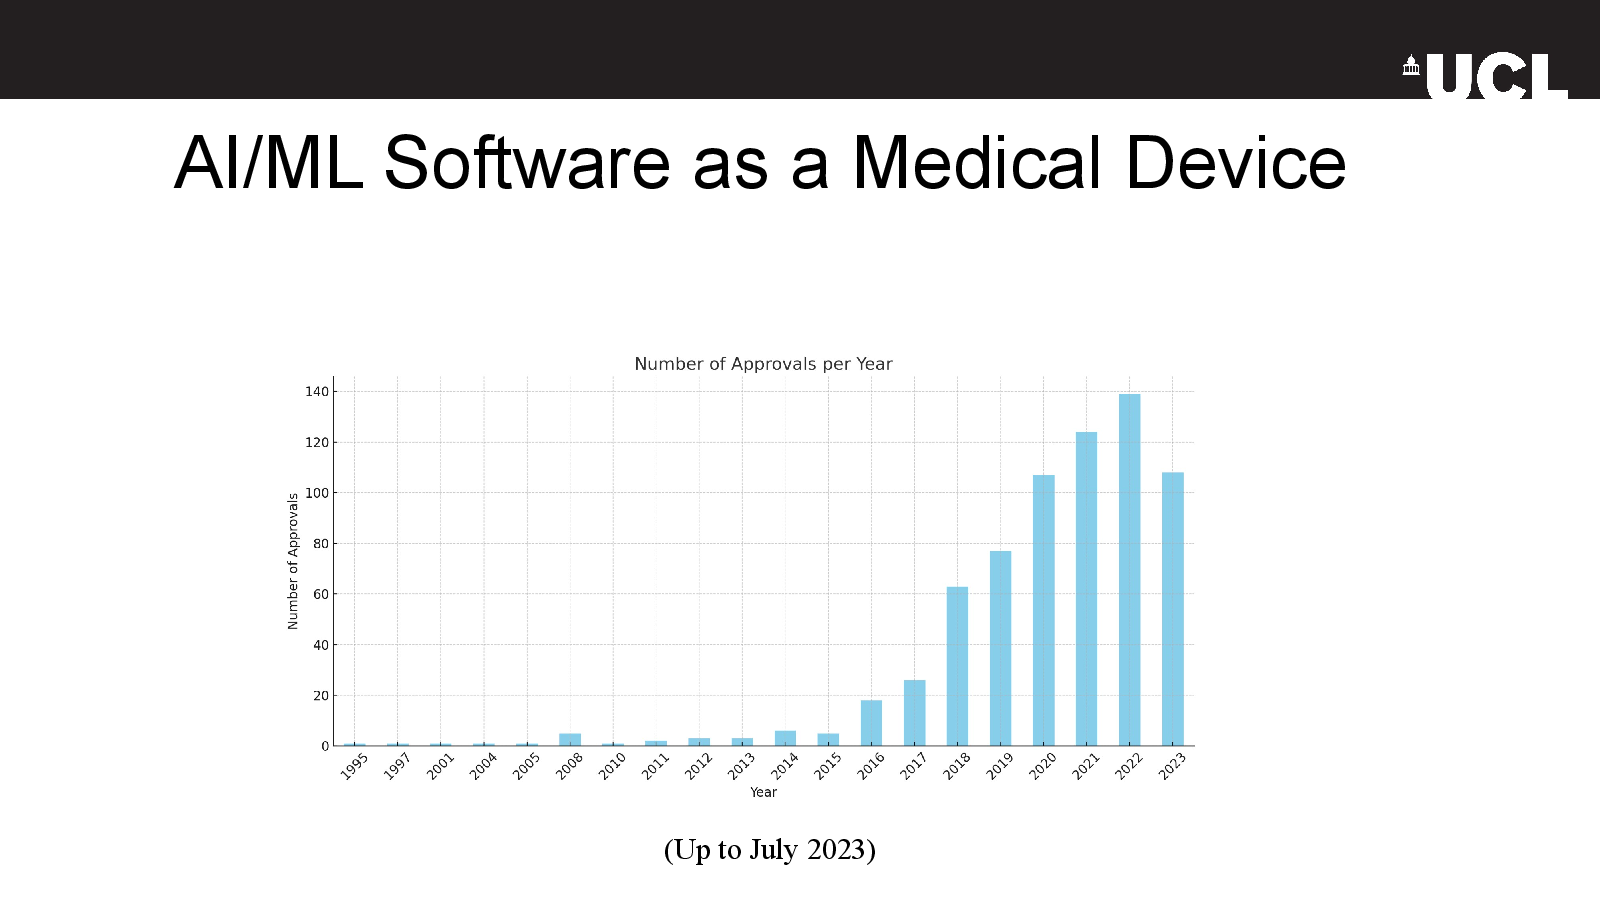
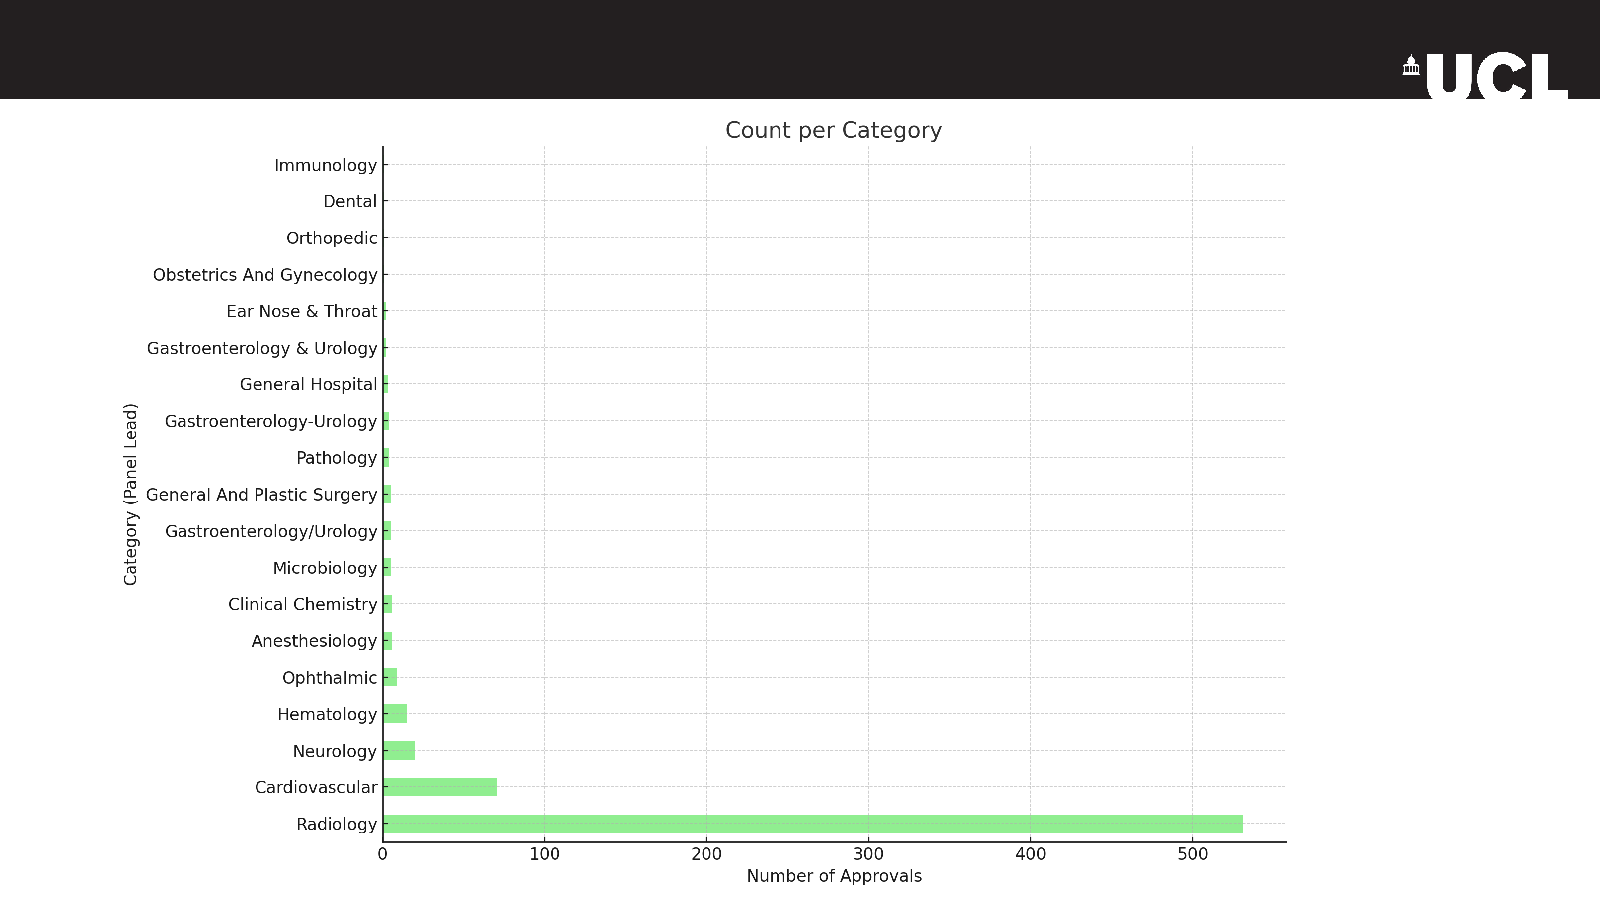
  • The landscape of AI-based medical software
  • Clinical MS labels and data-driven biological classification
  • MRI subtypes and measures of disease progression
  • The evidence and maturity of brain and spinal cord biomarkers
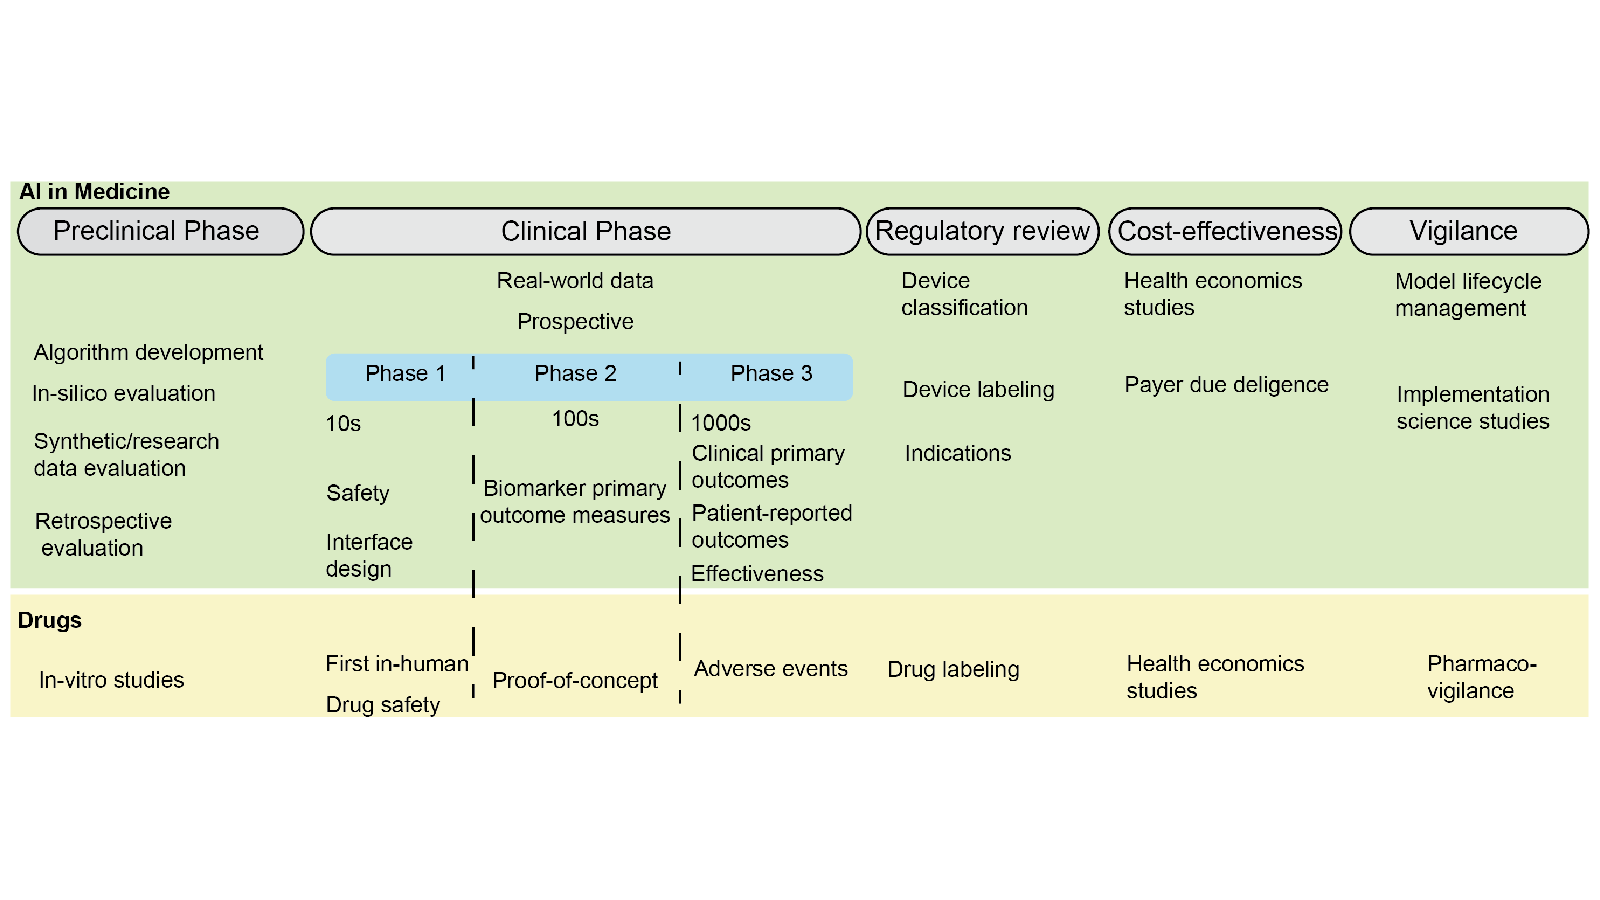
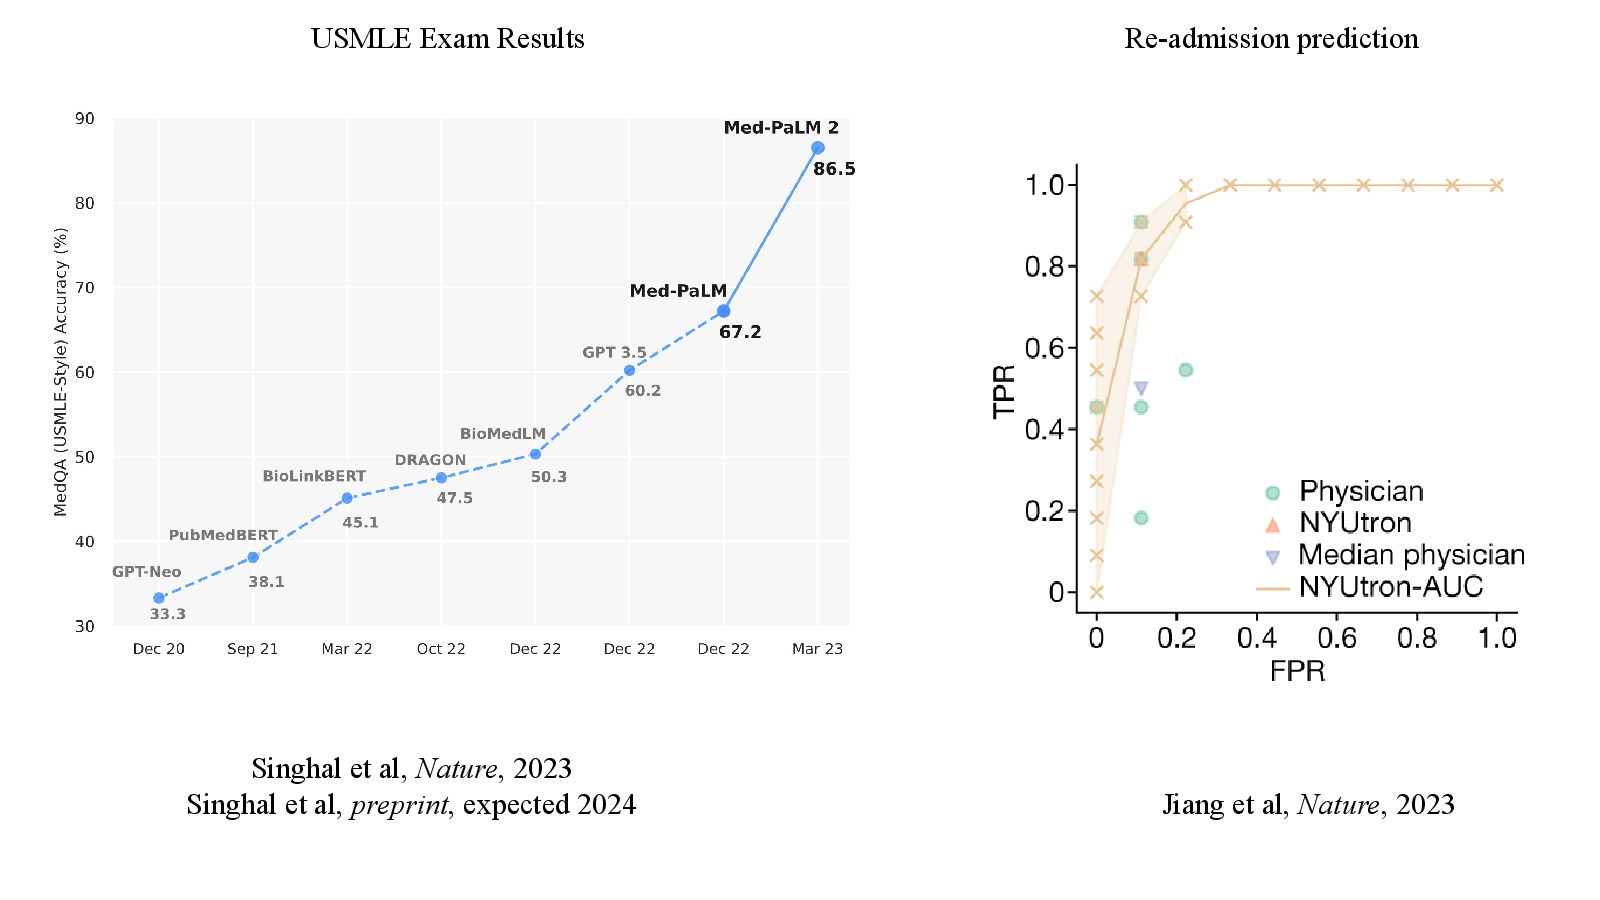
  • Lessons from other clinical fields and priorities for translation

Take-away

AI already has value as a research tool, particularly for extracting structure from imaging data. Routine clinical use requires clearer standards, stronger outcome evidence and realistic expectations about the pace of translation.

Original deck

Slide by slide

Read the 20-slide presentation in order, or use the index to jump.

  1. Slide 01

    Transforming MS Care with AI
    Slide 1: Transforming MS Care with AIOpen full-size slide

    Prospects and Challenges

    Arman Eshaghi, MD, PhD

    Principal Research Fellow

    Queen Square Institute of Neurology

    University College London

    UK

  2. Slide 07

    Slide 7

    Full image of slide 7Open full-size slide
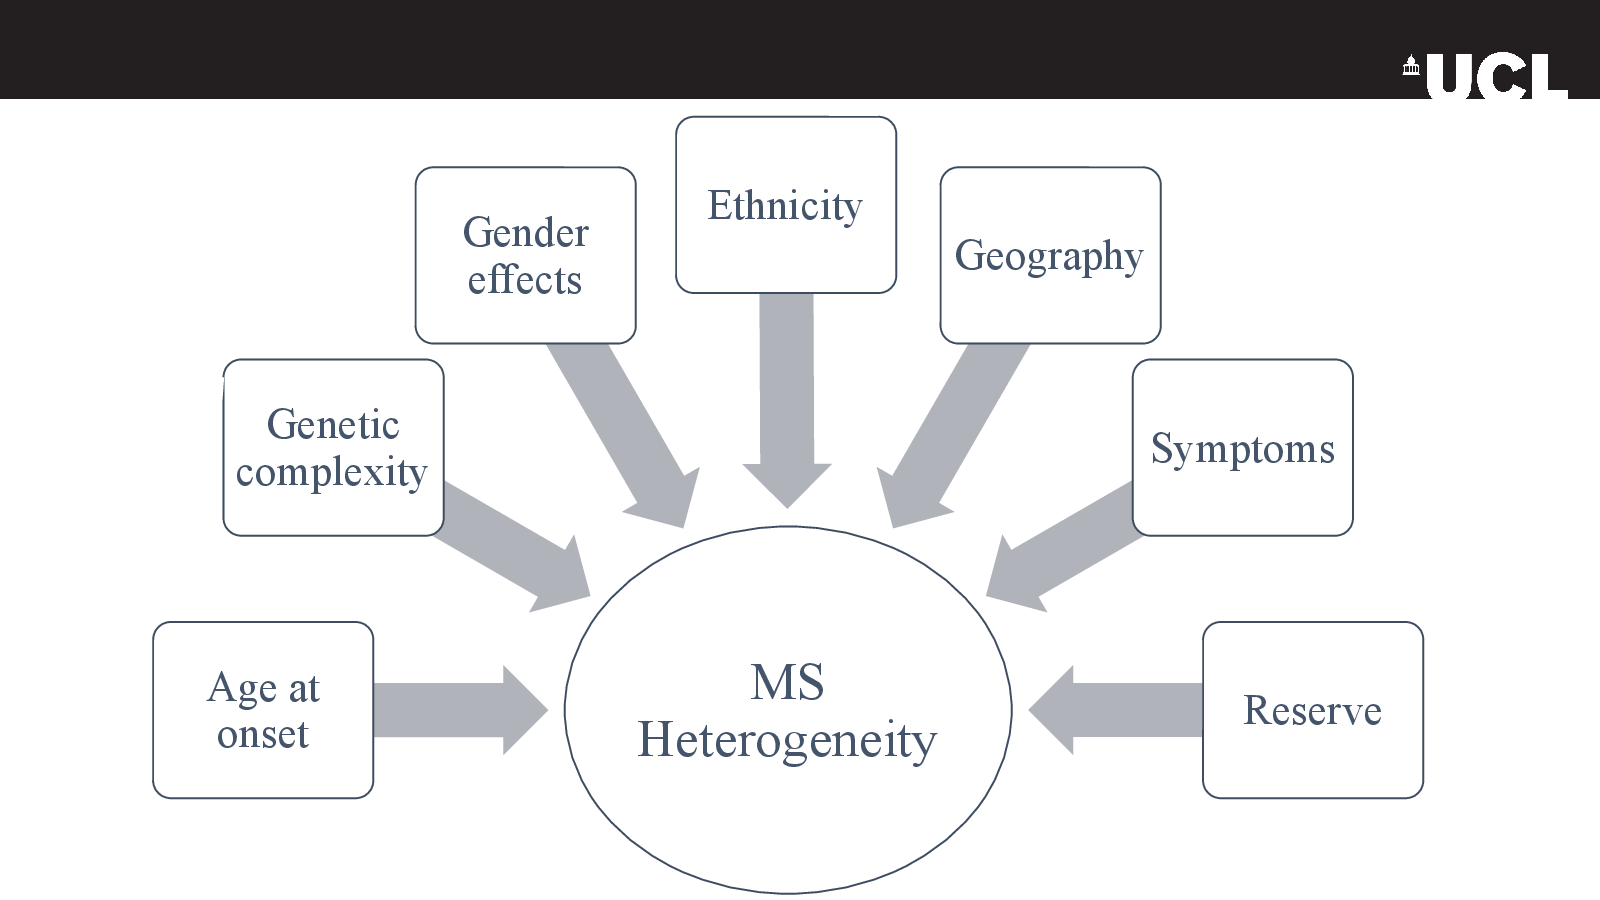
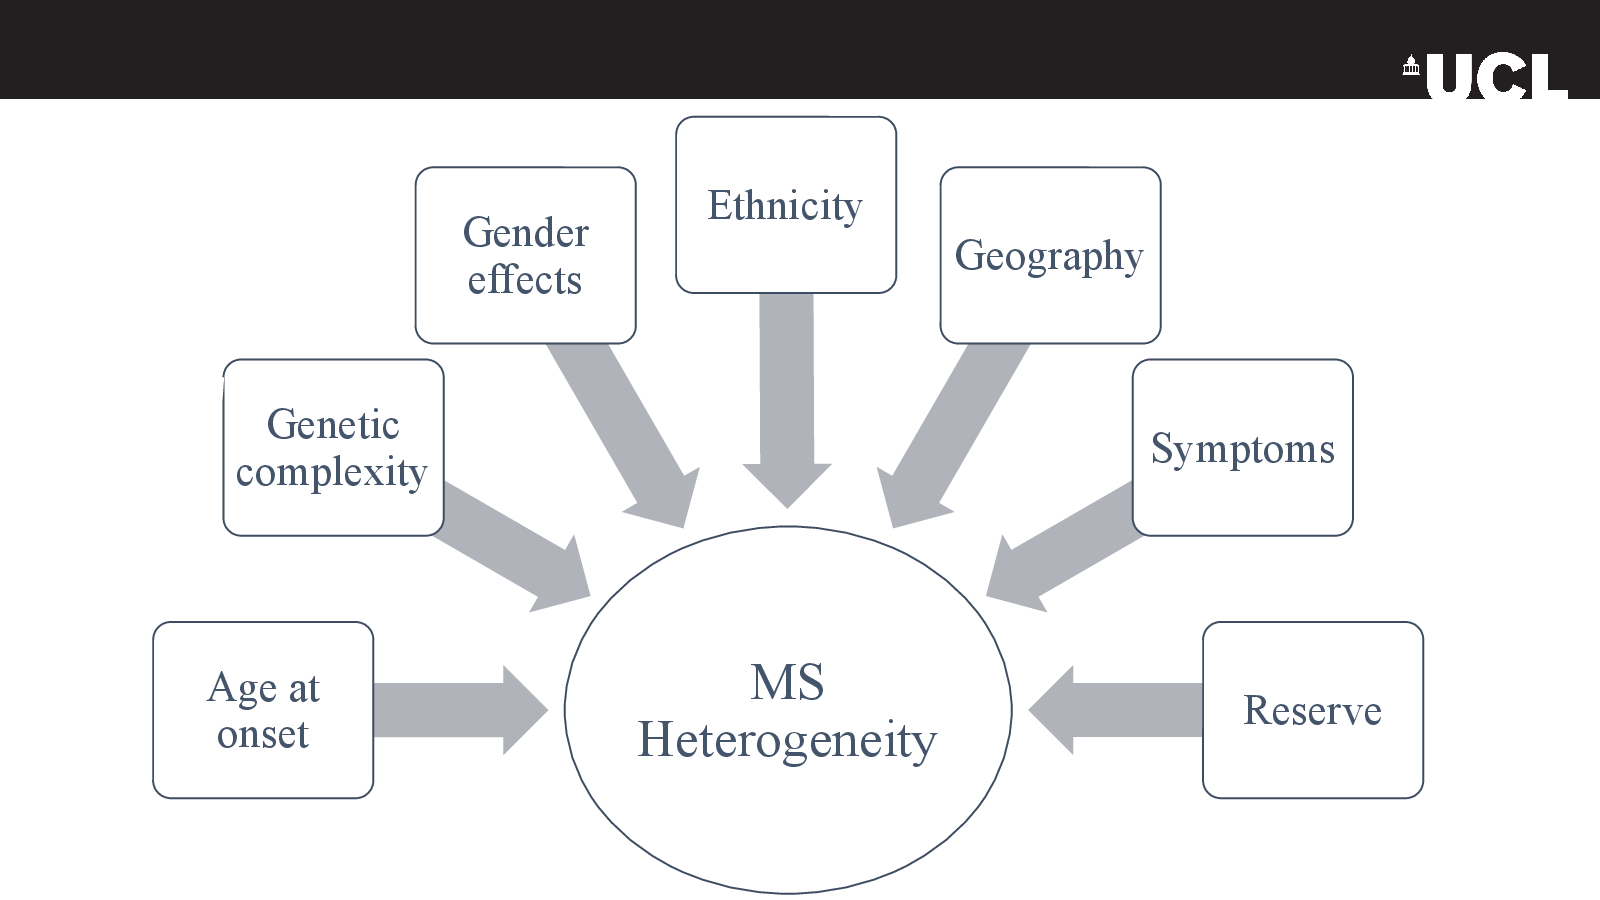
    • MS Heterogeneity
    • Age at onset
    • Genetic complexity
    • Gender effects
    • Ethnicity
    • Geography
    • Symptoms
    • Reserve
  3. Slide 08

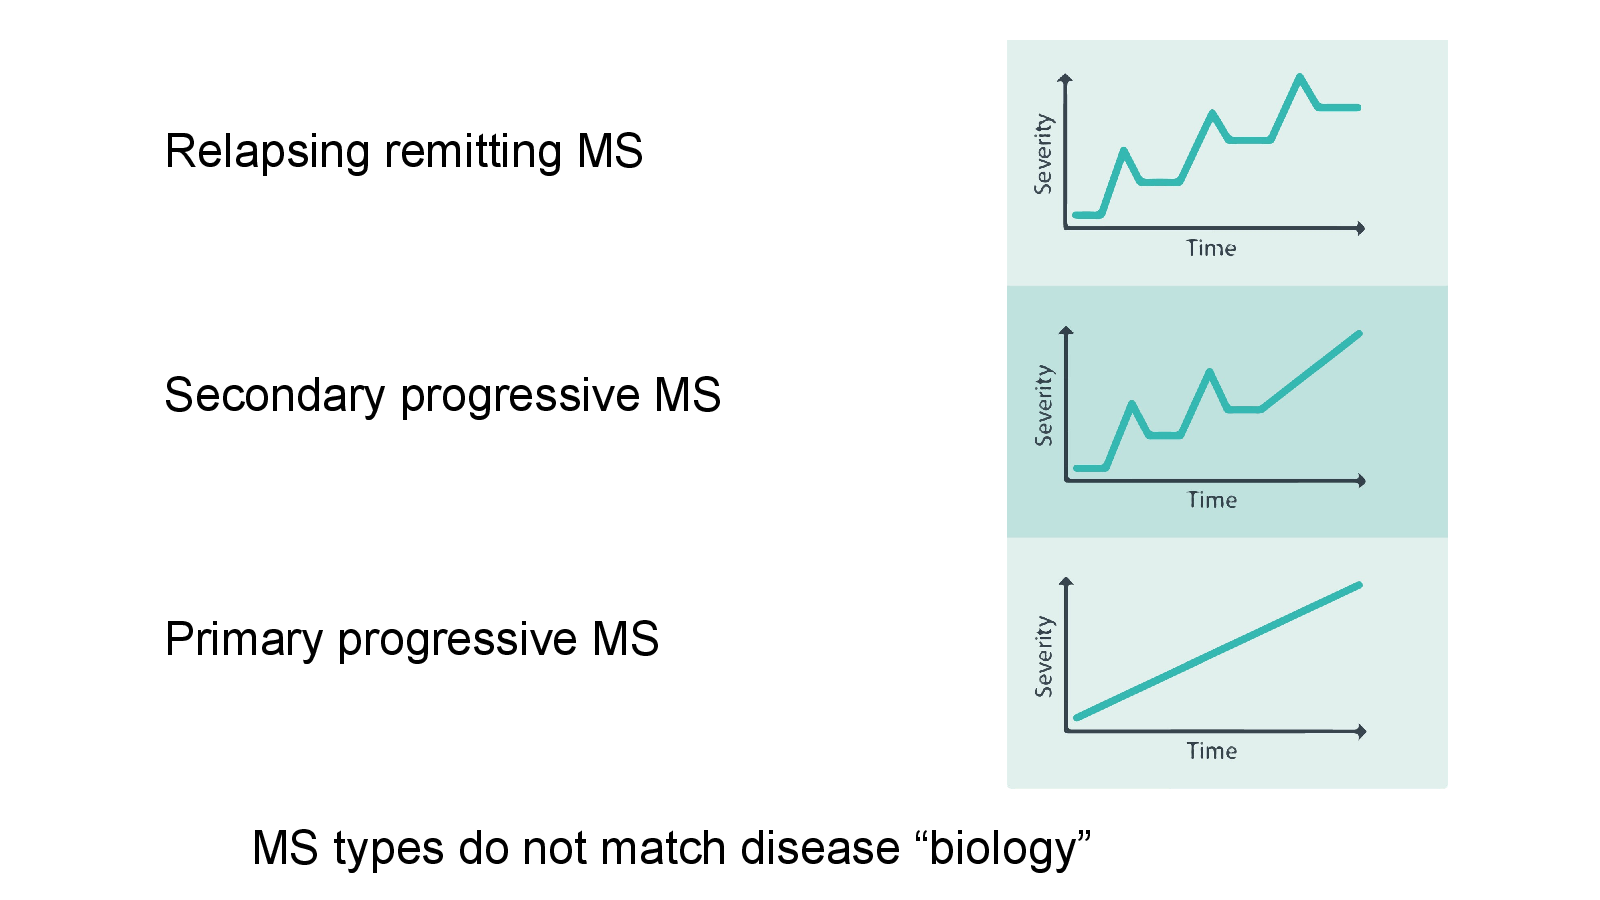
    MS types do not match disease “biology”
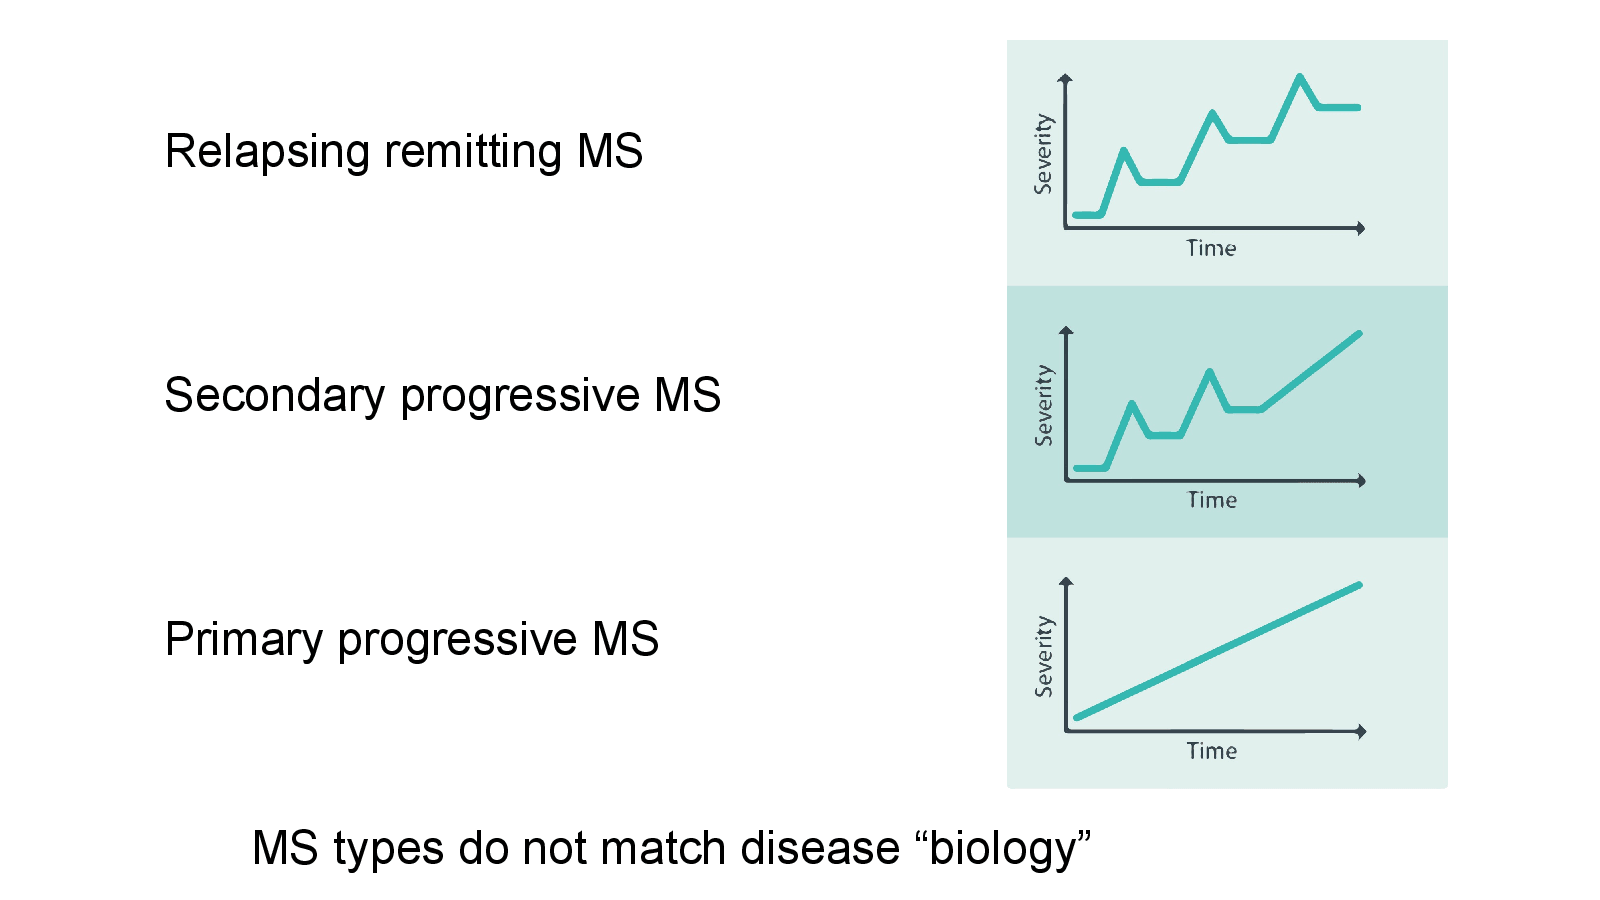
    Slide 8: MS types do not match disease “biology”Open full-size slide

    Relapsing remitting MS

    Secondary progressive MS

    Primary progressive MS

    Speaker notes

    The effect size, expressed as mean difference in annual percentage cortical thickness change (MD-APC), is graphically displayed in different shades of blue for each of the Desikan-Killiany atlas25 regions presenting significant differences between groups after correction for multiple comparisons.

  4. Slide 09

    Slide 9

    Full image of slide 9Open full-size slide
    Speaker notes

    The effect size, expressed as mean difference in annual percentage cortical thickness change (MD-APC), is graphically displayed in different shades of blue for each of the Desikan-Killiany atlas25 regions presenting significant differences between groups after correction for multiple comparisons.

  5. Slide 10

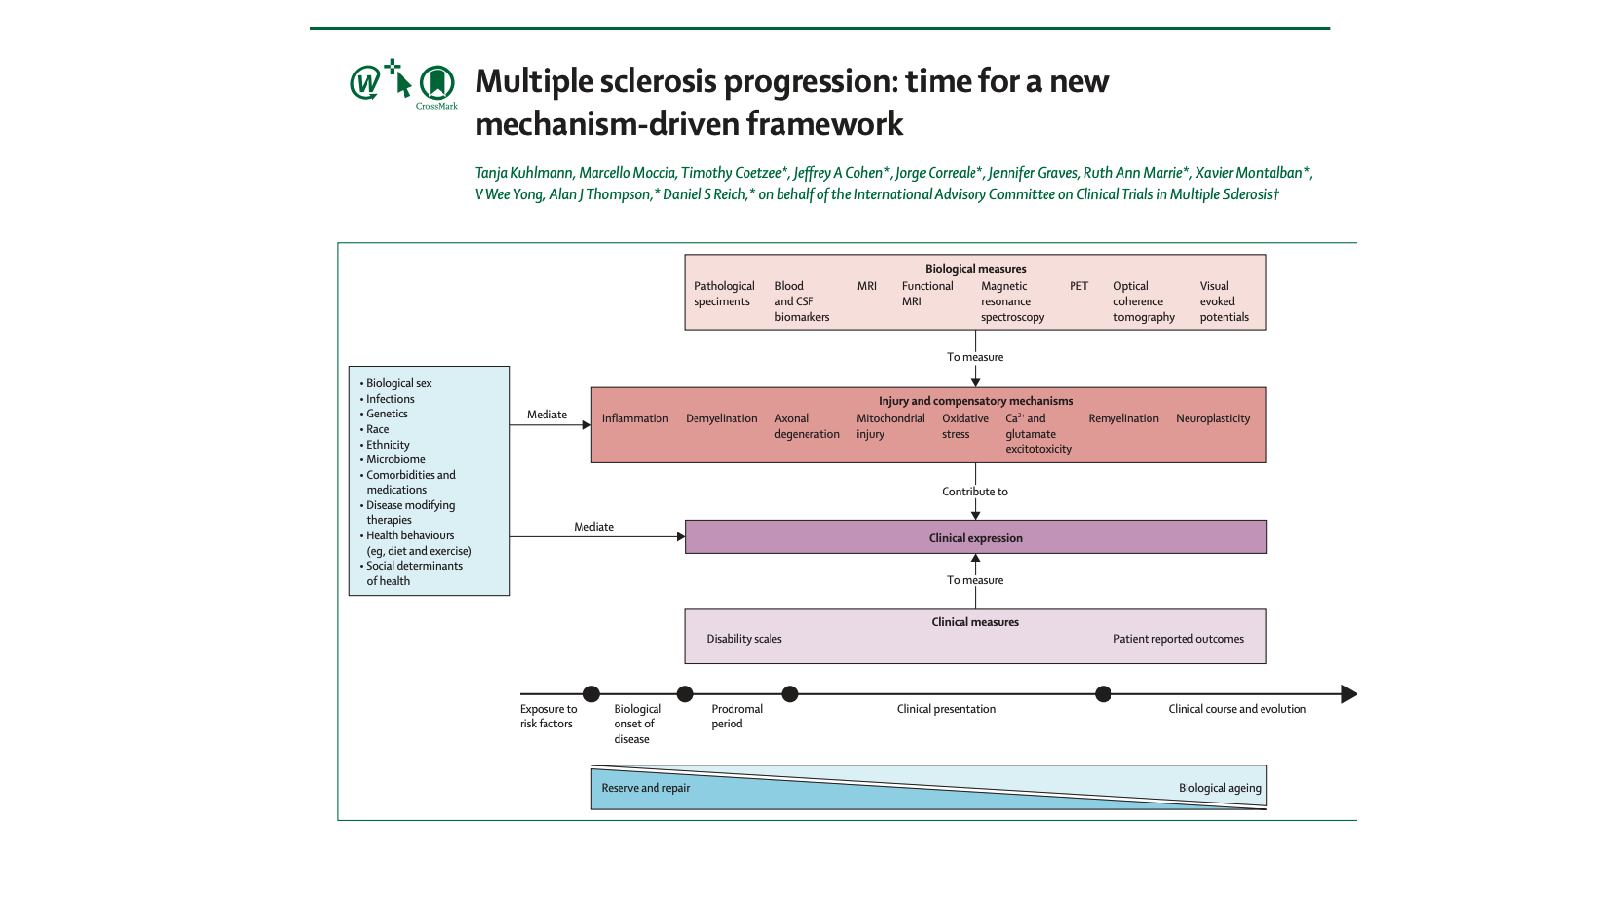
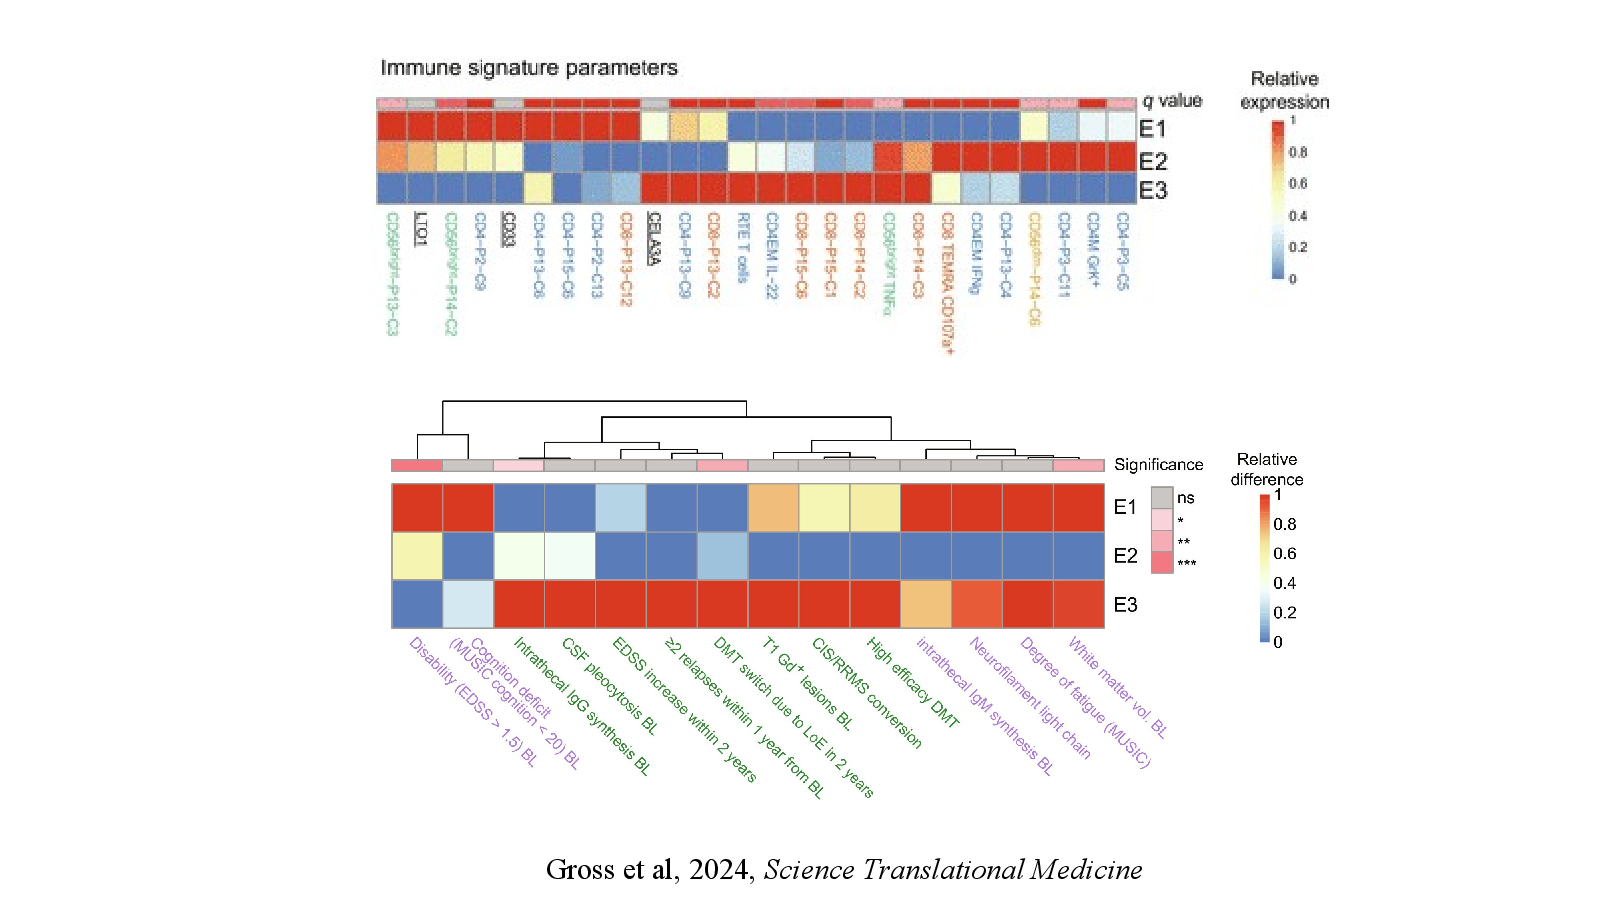
    Gross et al, 2024, Science Translational Medicine
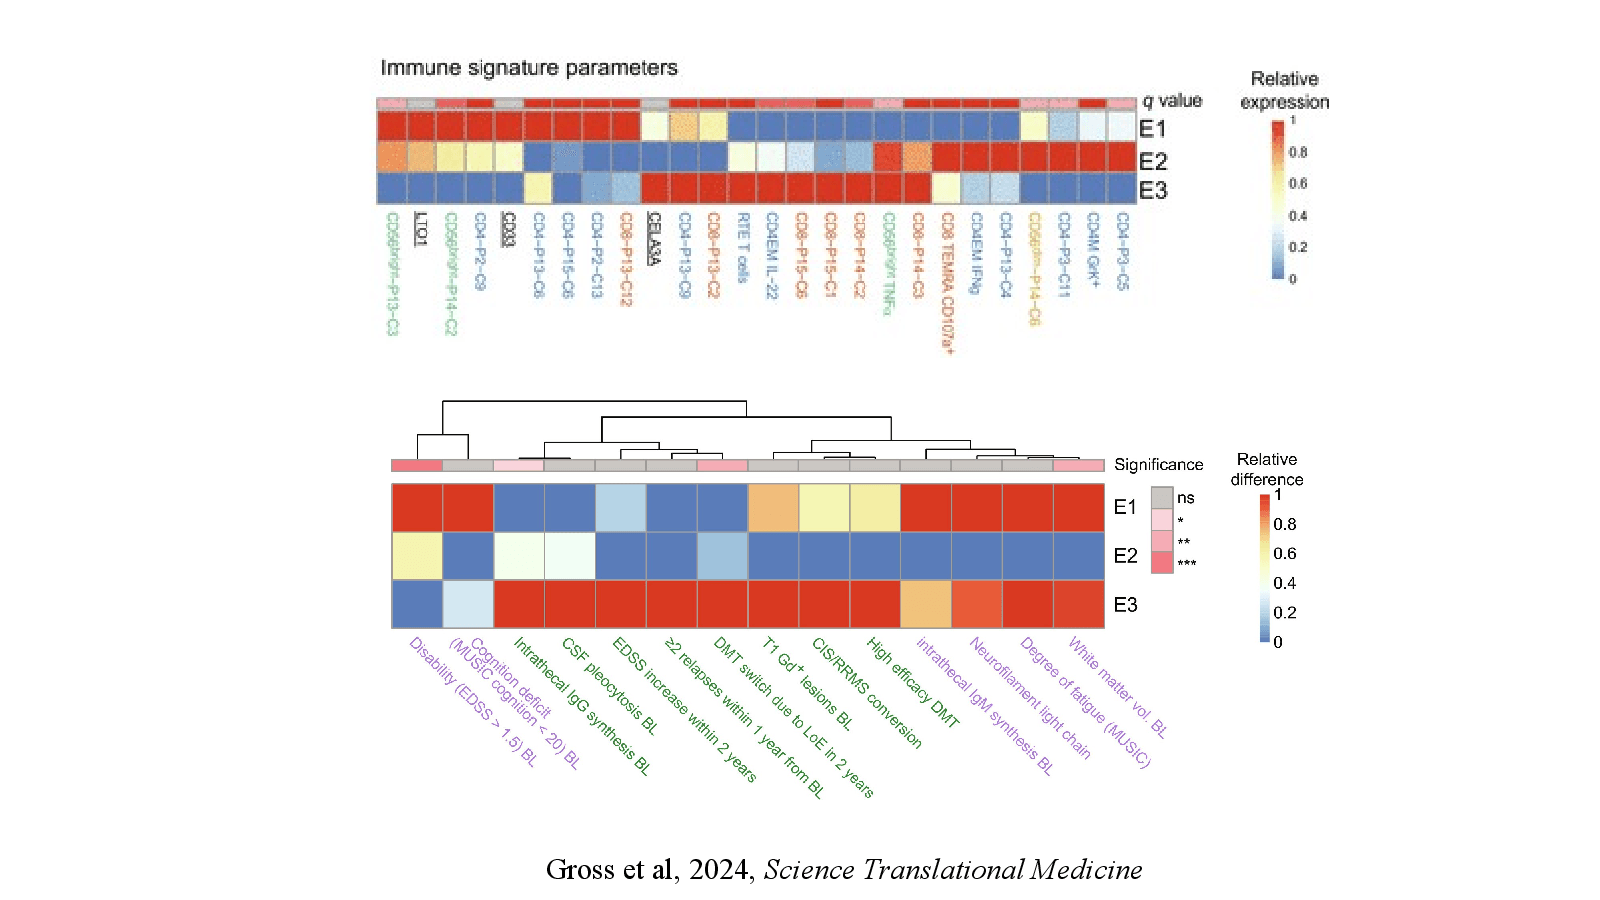
    Slide 10: Gross et al, 2024, Science Translational MedicineOpen full-size slide
    Speaker notes

    The effect size, expressed as mean difference in annual percentage cortical thickness change (MD-APC), is graphically displayed in different shades of blue for each of the Desikan-Killiany atlas25 regions presenting significant differences between groups after correction for multiple comparisons.

    References

  6. Slide 11

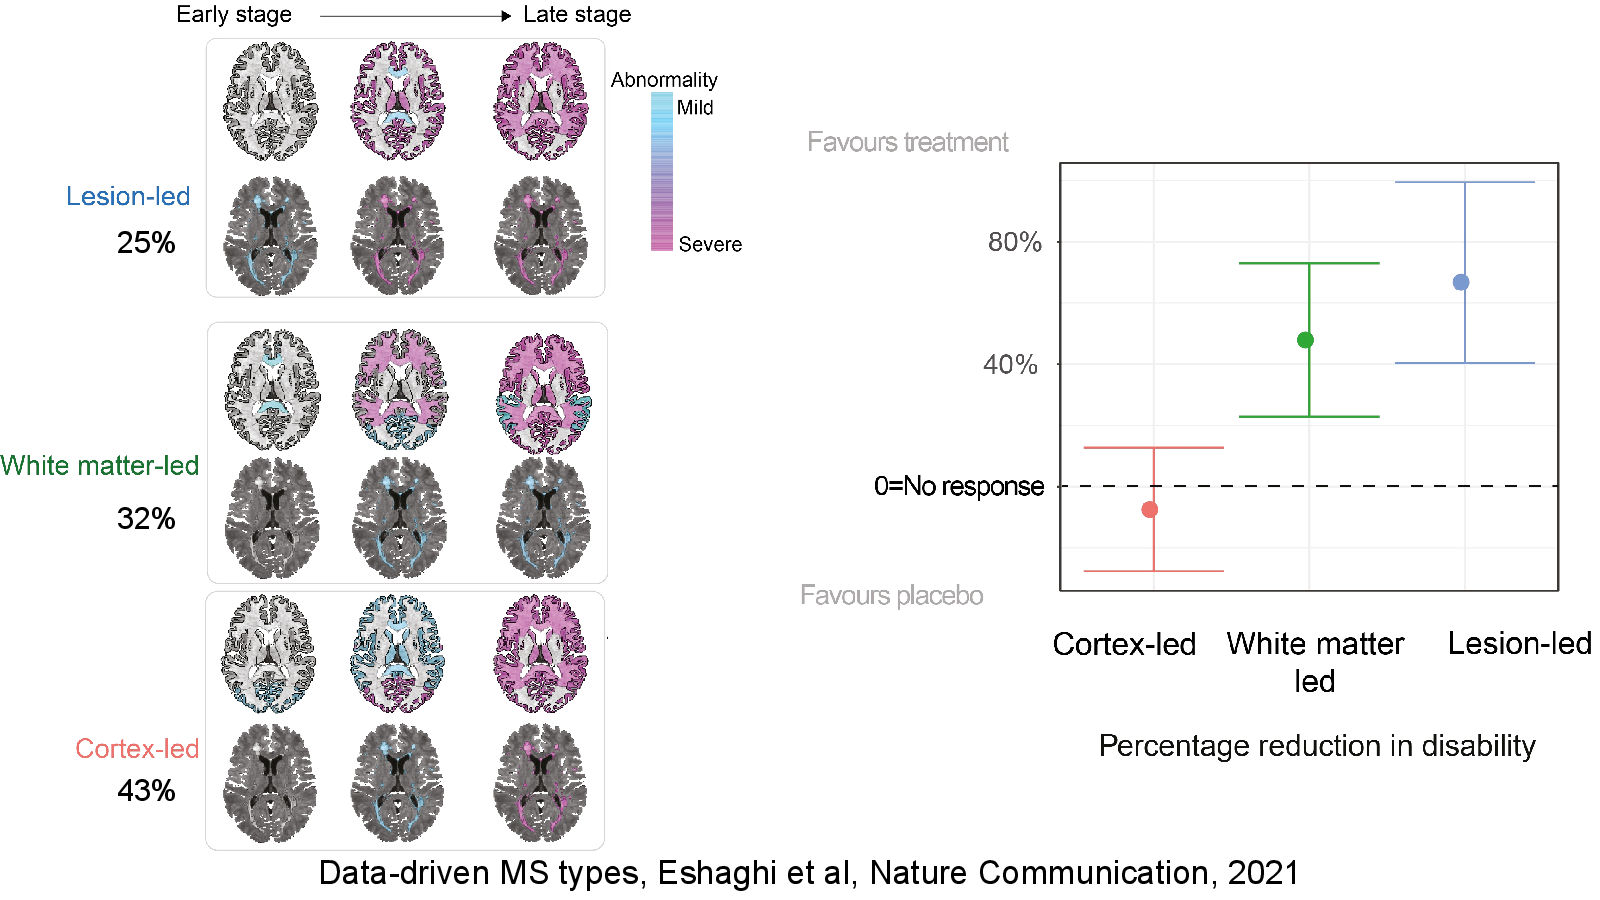
    Data-driven MS types, Eshaghi et al, Nature Communication, 2021
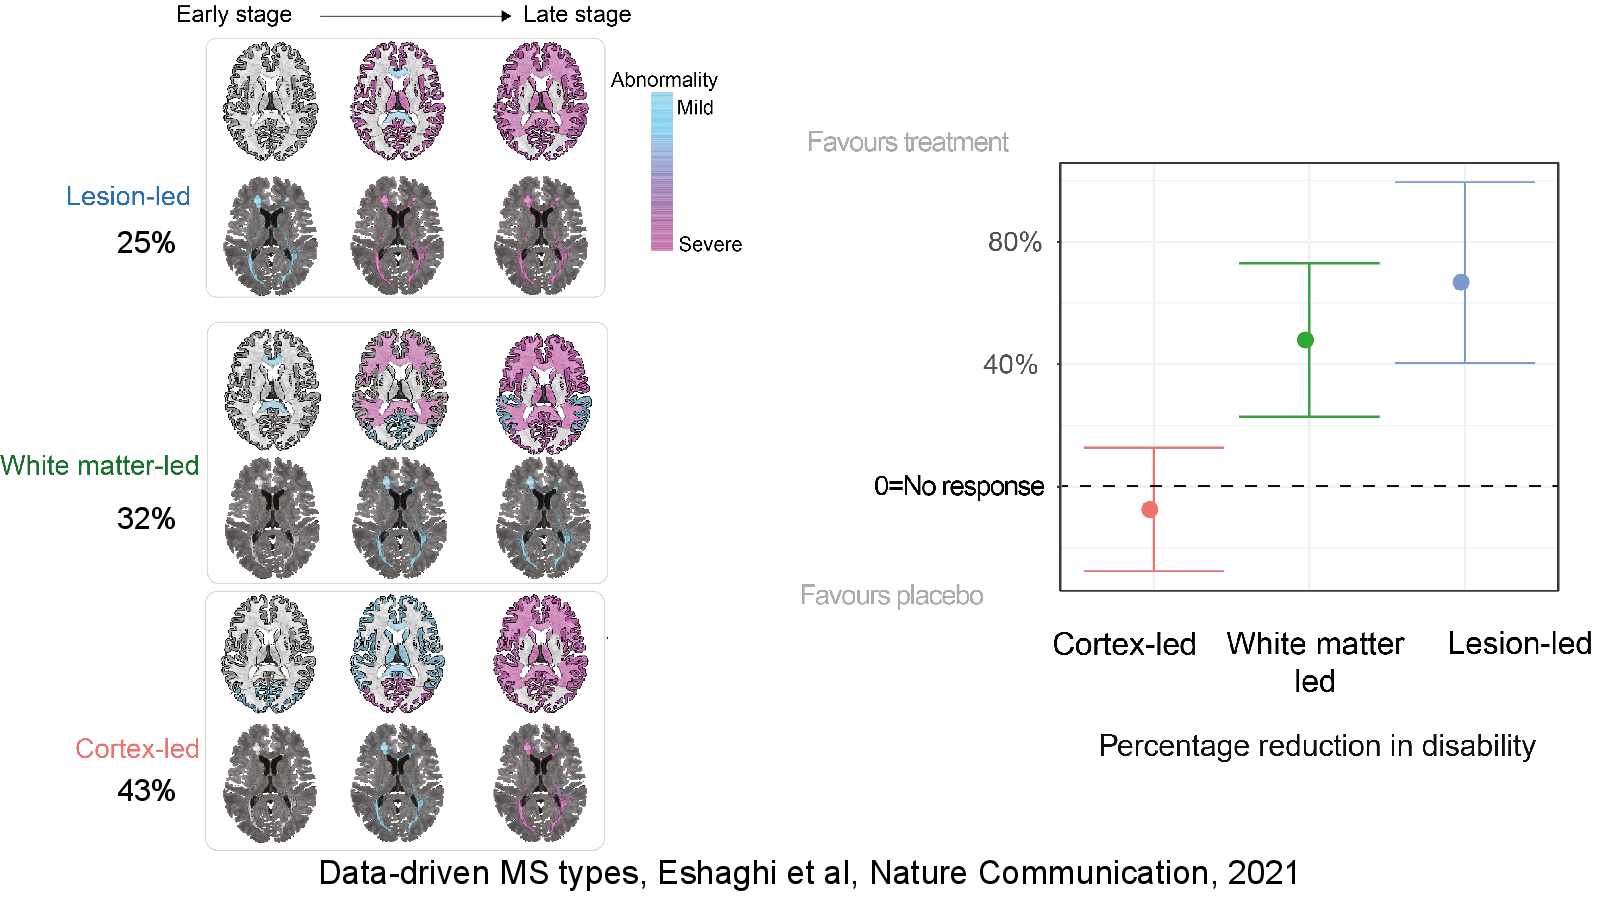
    Slide 11: Data-driven MS types, Eshaghi et al, Nature Communication, 2021Open full-size slide

    25%

    32%

    43%

    Speaker notes

    The effect size, expressed as mean difference in annual percentage cortical thickness change (MD-APC), is graphically displayed in different shades of blue for each of the Desikan-Killiany atlas25 regions presenting significant differences between groups after correction for multiple comparisons.

    References

  7. Slide 12

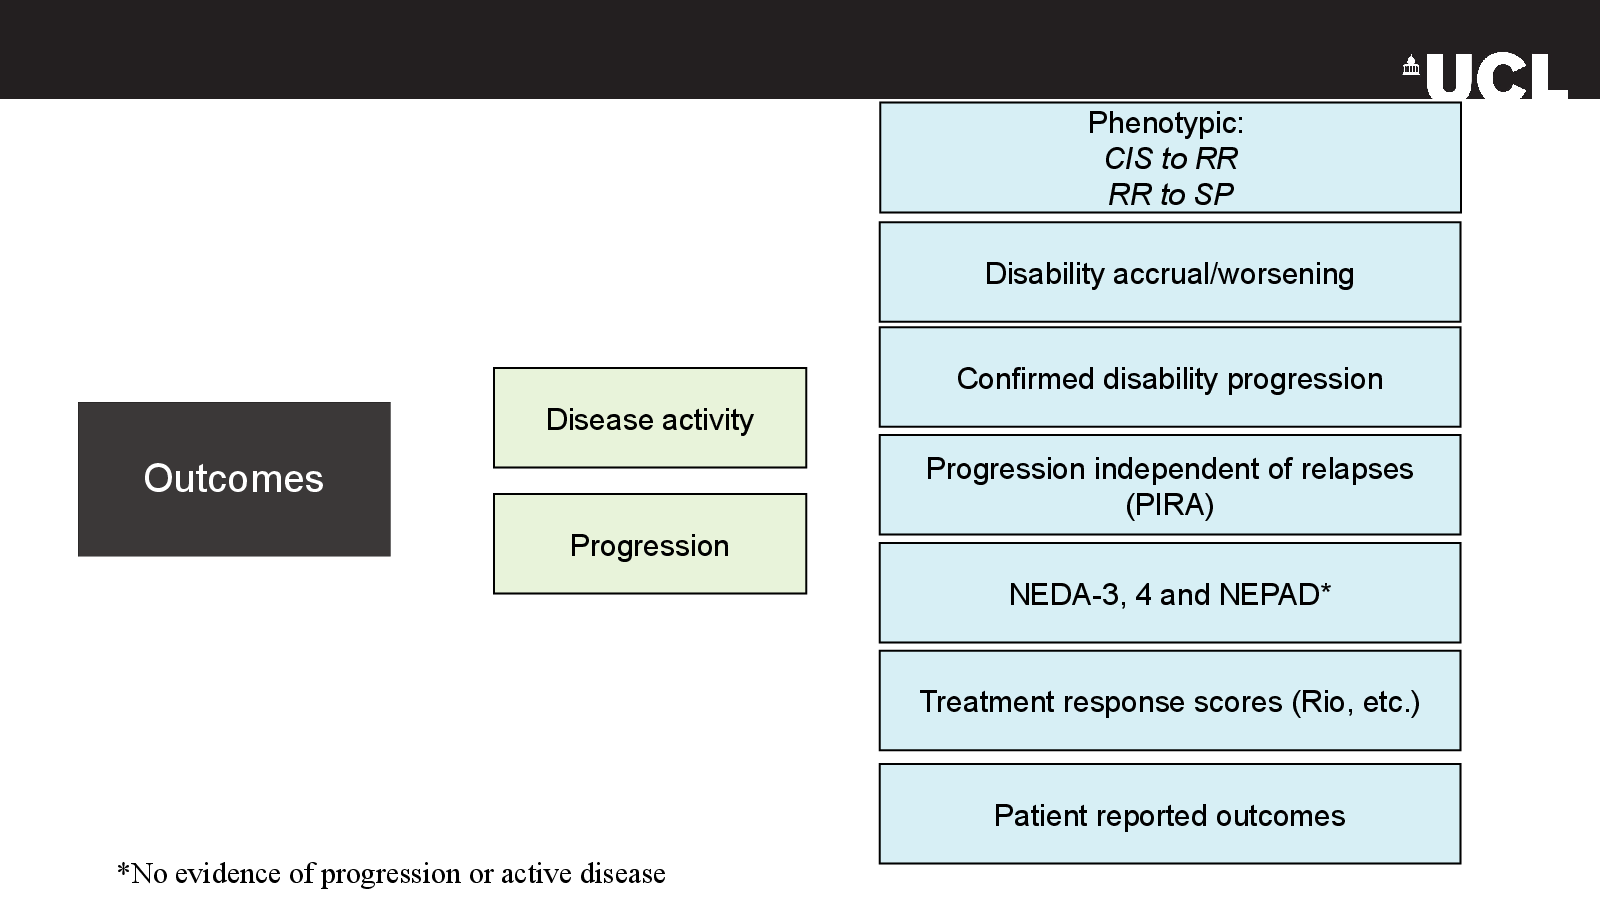
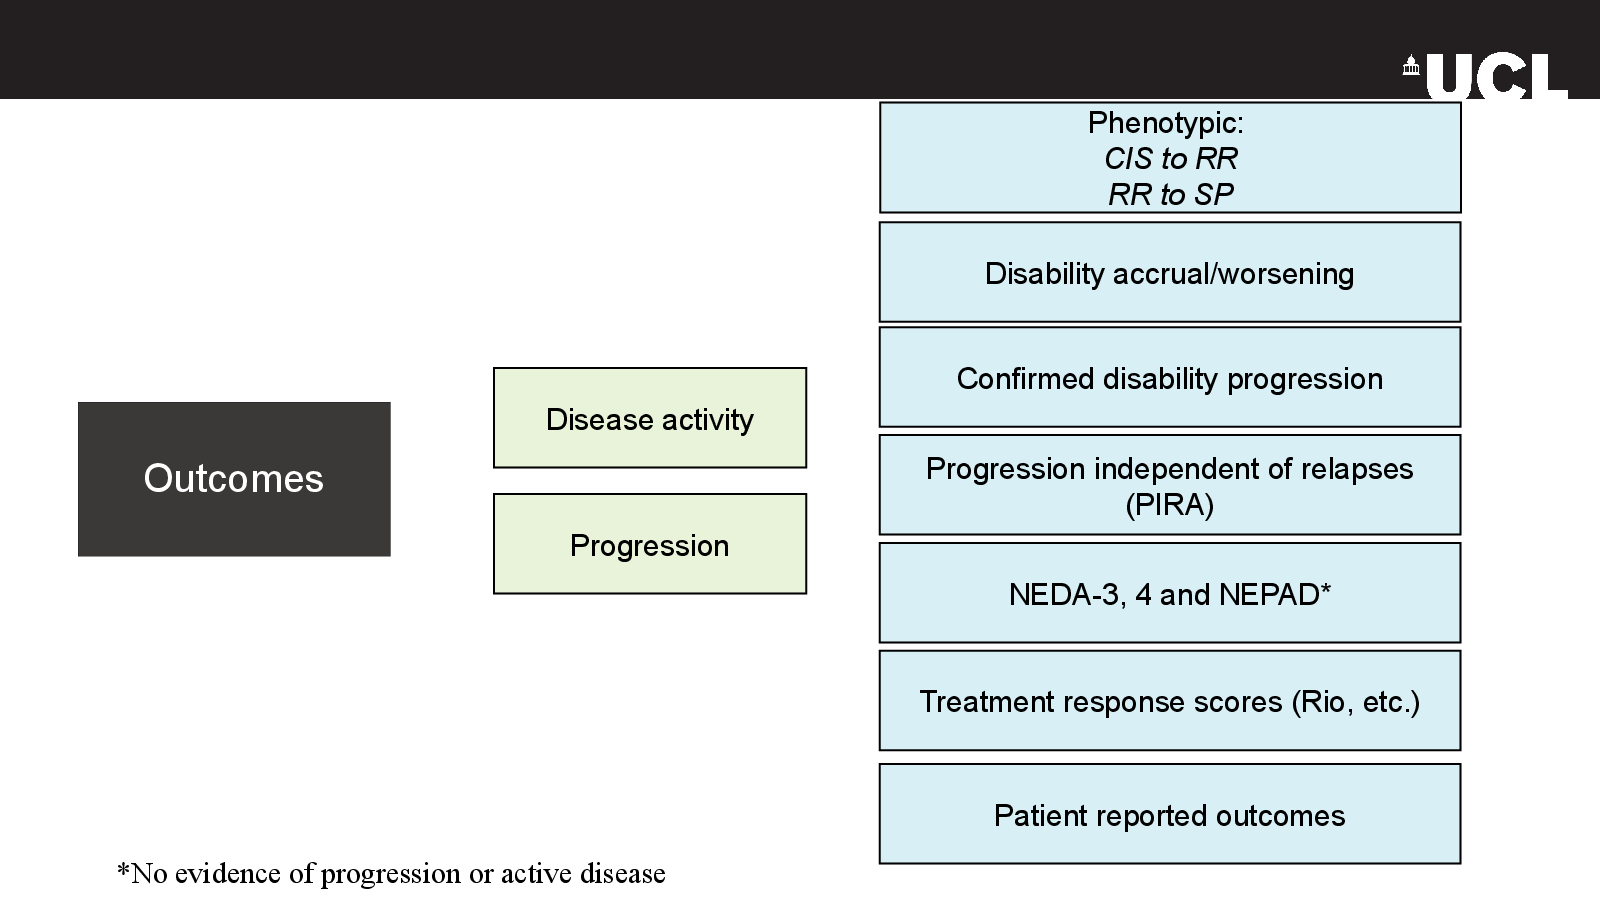
    Outcomes

    Slide 12: OutcomesOpen full-size slide

    Phenotypic:

    CIS to RR

    RR to SP

    Disability accrual/worsening

    Confirmed disability progression

    Disease activity

    Progression independent of relapses

    (PIRA)

    Progression

    NEDA-3, 4 and NEPAD*

    Treatment response scores (Rio, etc.)

    Patient reported outcomes

    *No evidence of progression or active disease

    Speaker notes

    https://www.uptodate.com/contents/indications-for-switching-or-stopping-disease-modifying-therapy-for-multiple-sclerosis

  8. Slide 14

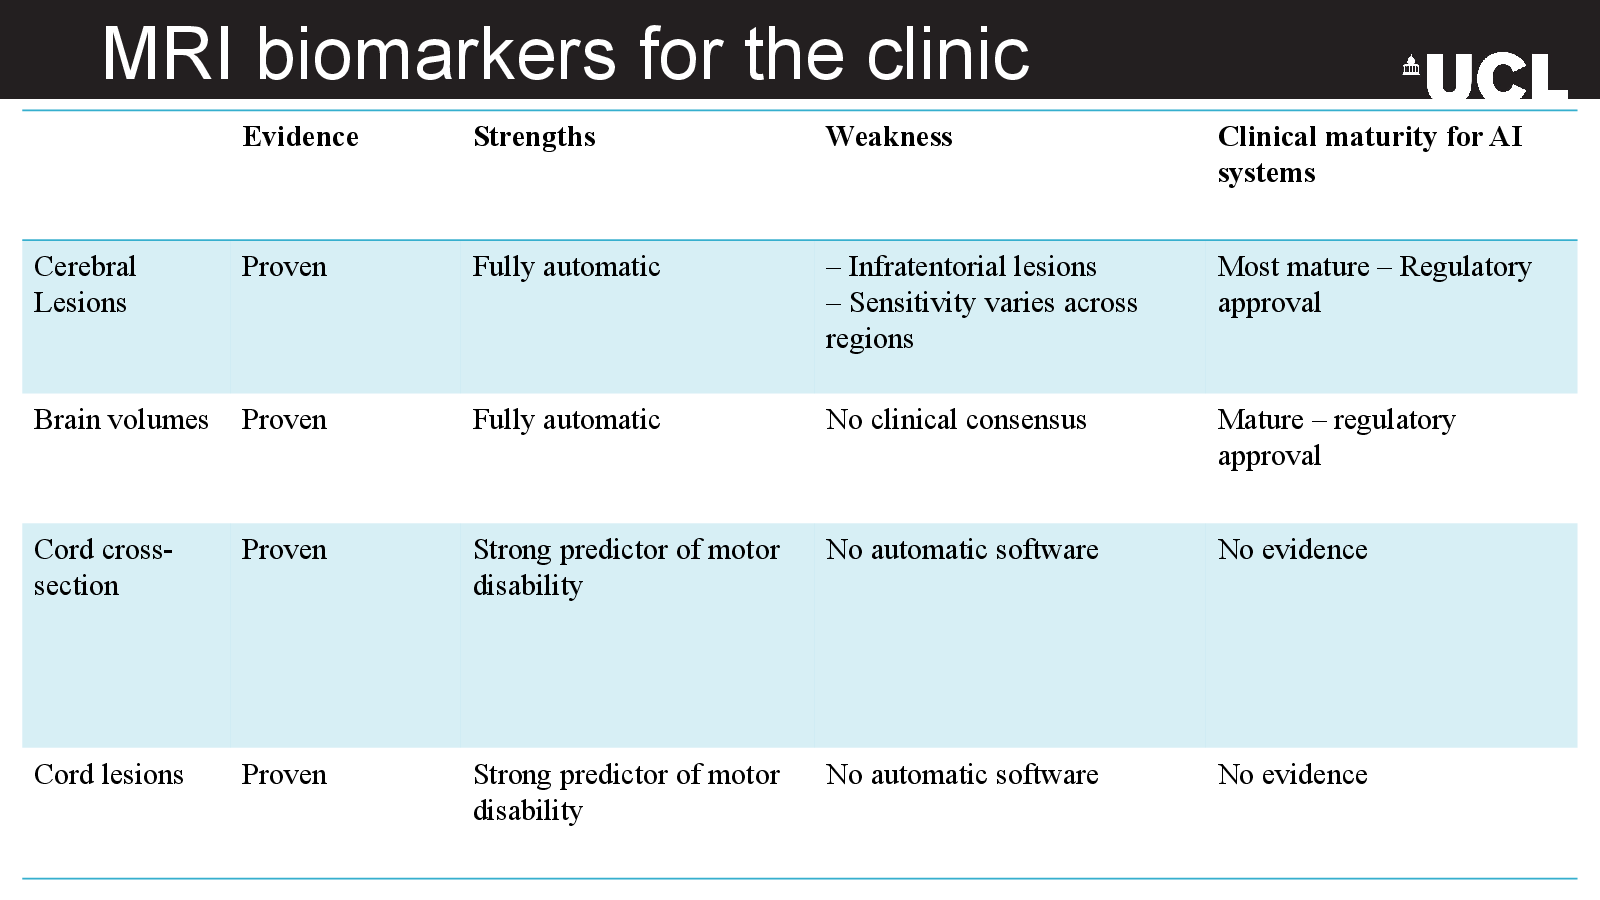
    MRI biomarkers for the clinic
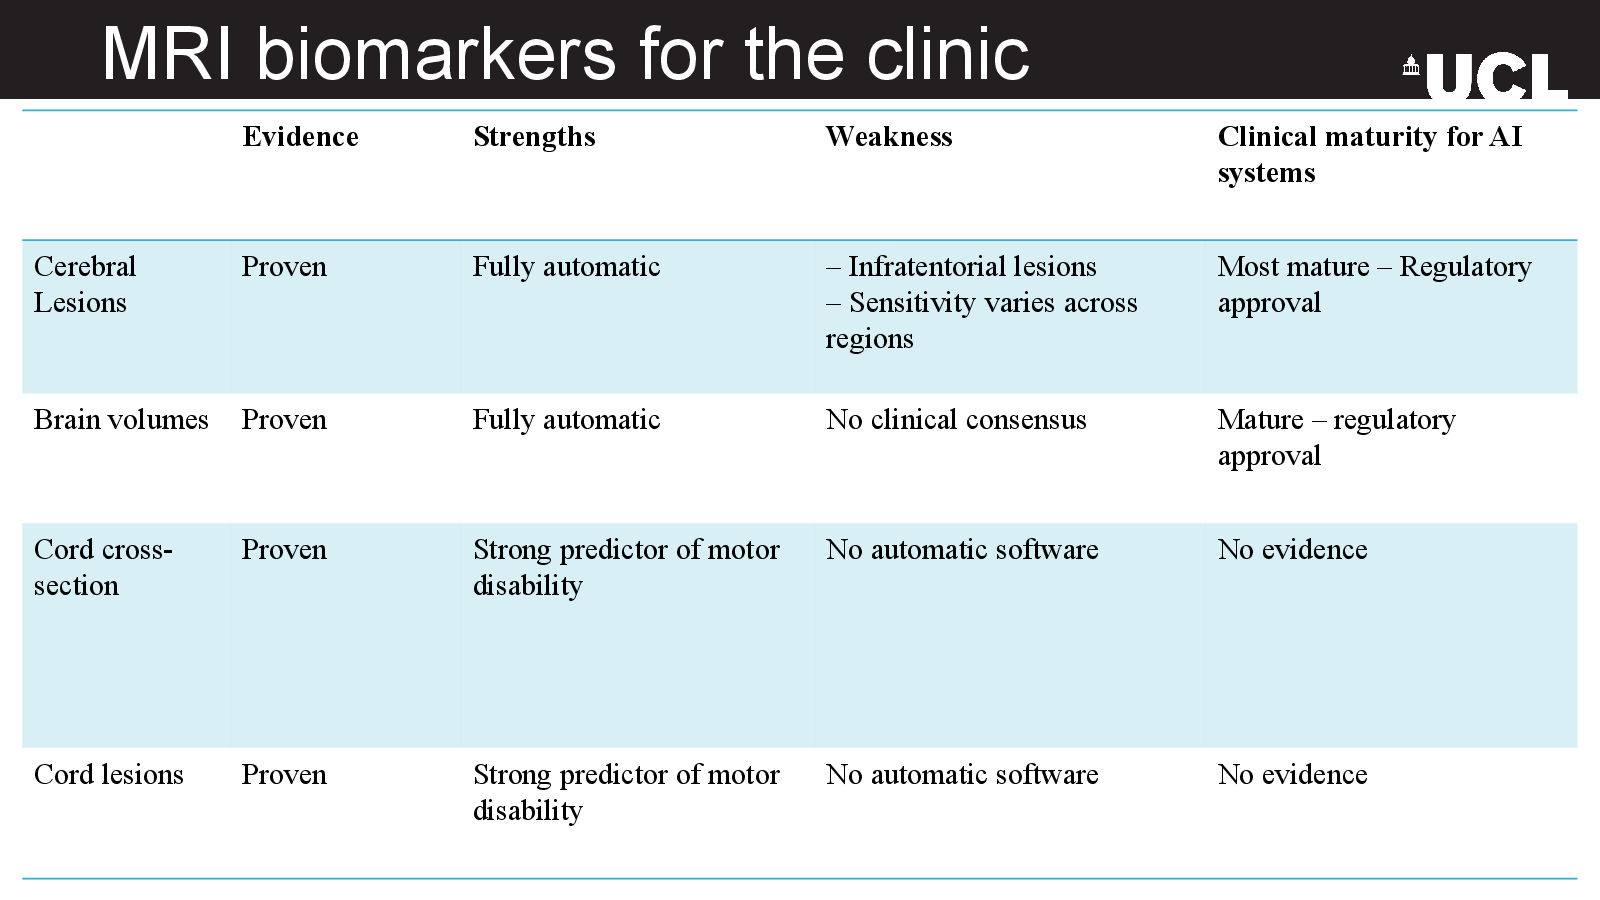
    Slide 14: MRI biomarkers for the clinicOpen full-size slide
    • Evidence — Strengths — Weakness — Clinical maturity for AI systems
    • Cerebral Lesions — Proven — Fully automatic — – Infratentorial lesions / – Sensitivity varies across regions — Most mature – Regulatory approval
    • Brain volumes — Proven — Fully automatic — No clinical consensus — Mature – regulatory approval
    • Cord cross-section — Proven — Strong predictor of motor disability — No automatic software — No evidence
    • Cord lesions — Proven — Strong predictor of motor disability — No automatic software — No evidence
  9. Slide 18

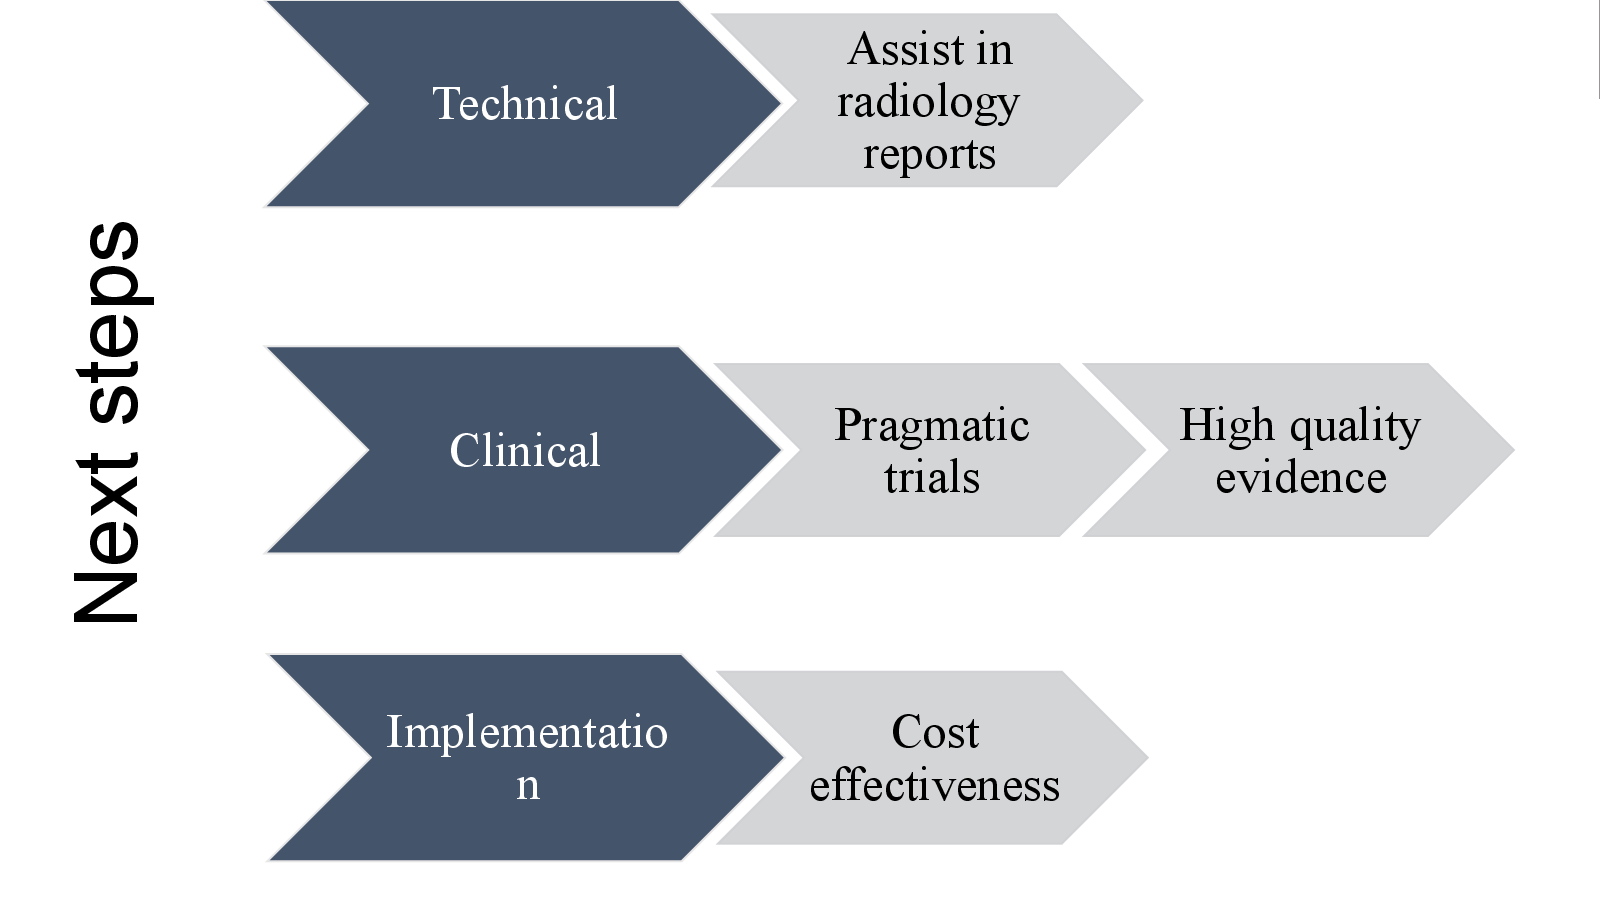
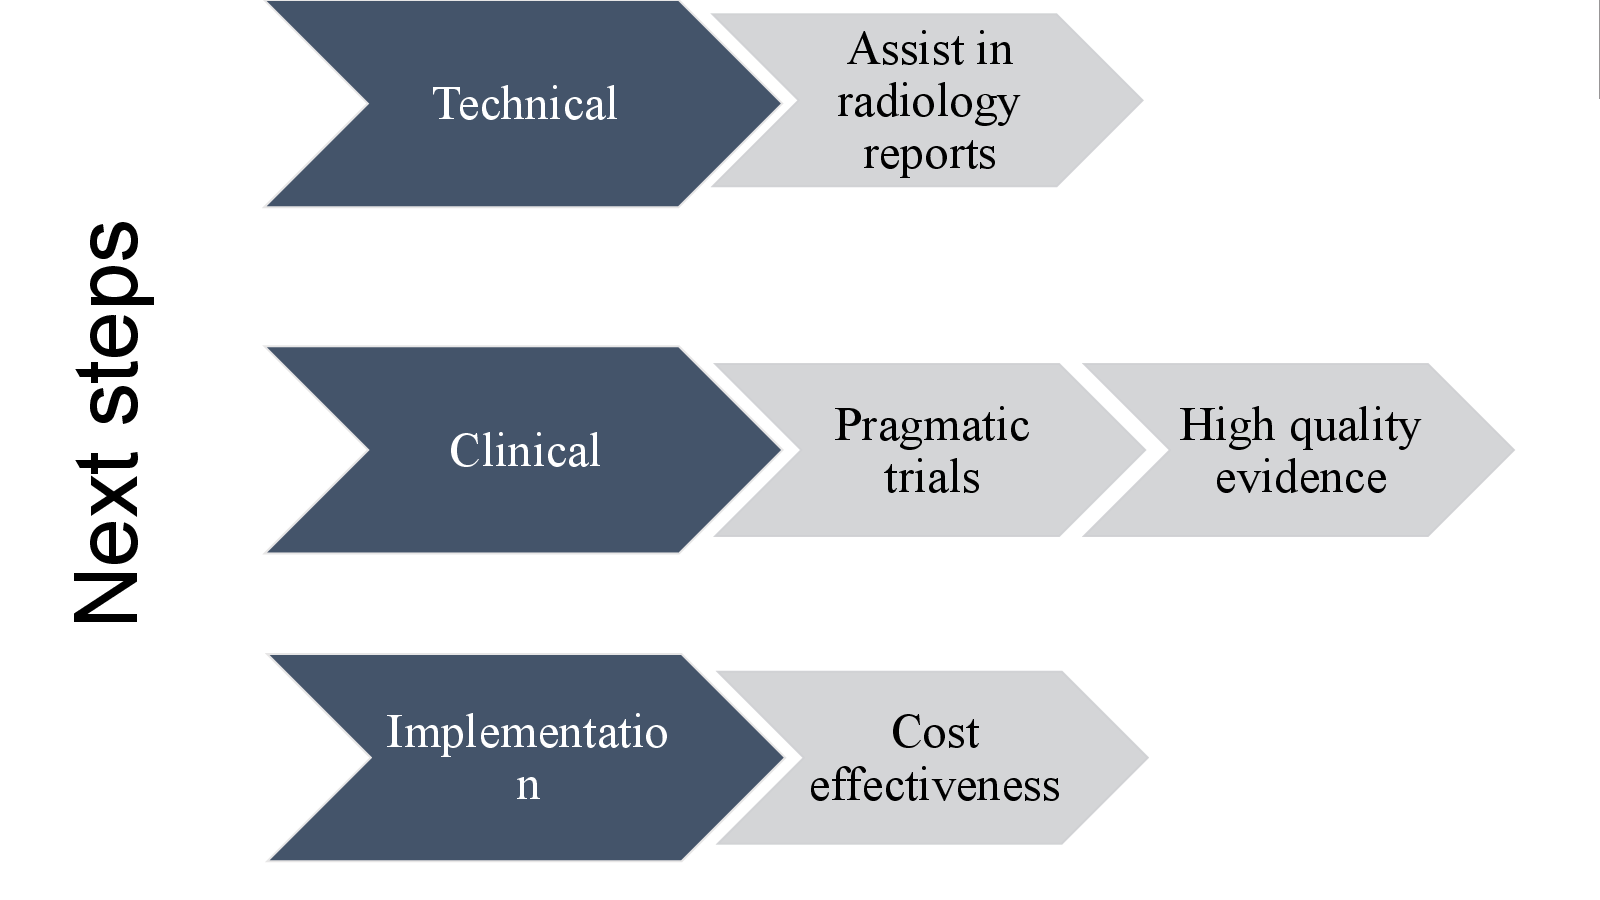
    Next steps

    Slide 18: Next stepsOpen full-size slide
    • Technical
    • Clinical
    • Pragmatic trials
    • High quality evidence
    • Implementation
    • Assist in radiology reports
    • Cost effectiveness