Conference ·
Using artificial intelligence and multimodal imaging to understand multiple sclerosis
How data-driven imaging can connect multiple sclerosis heterogeneity with prognosis and clinically meaningful subtypes.
2nd Inflammation & Imaging Symposium · Multiscale Imaging Centre, Münster, Germany
- Delivered
- Event
- 2nd Inflammation & Imaging Symposium
- Place
- Multiscale Imaging Centre, Münster, Germany
- Format
- Conference
- Published deck
- 26 slides
From the slides
Deck notes
Presented at the Multiscale Imaging Centre, this talk brought together artificial intelligence and multimodal imaging to examine heterogeneity in multiple sclerosis. The emphasis was on disease classification, prognosis and robust translation.
The question
Can patterns across imaging modalities provide a more useful account of multiple sclerosis than conventional clinical categories?
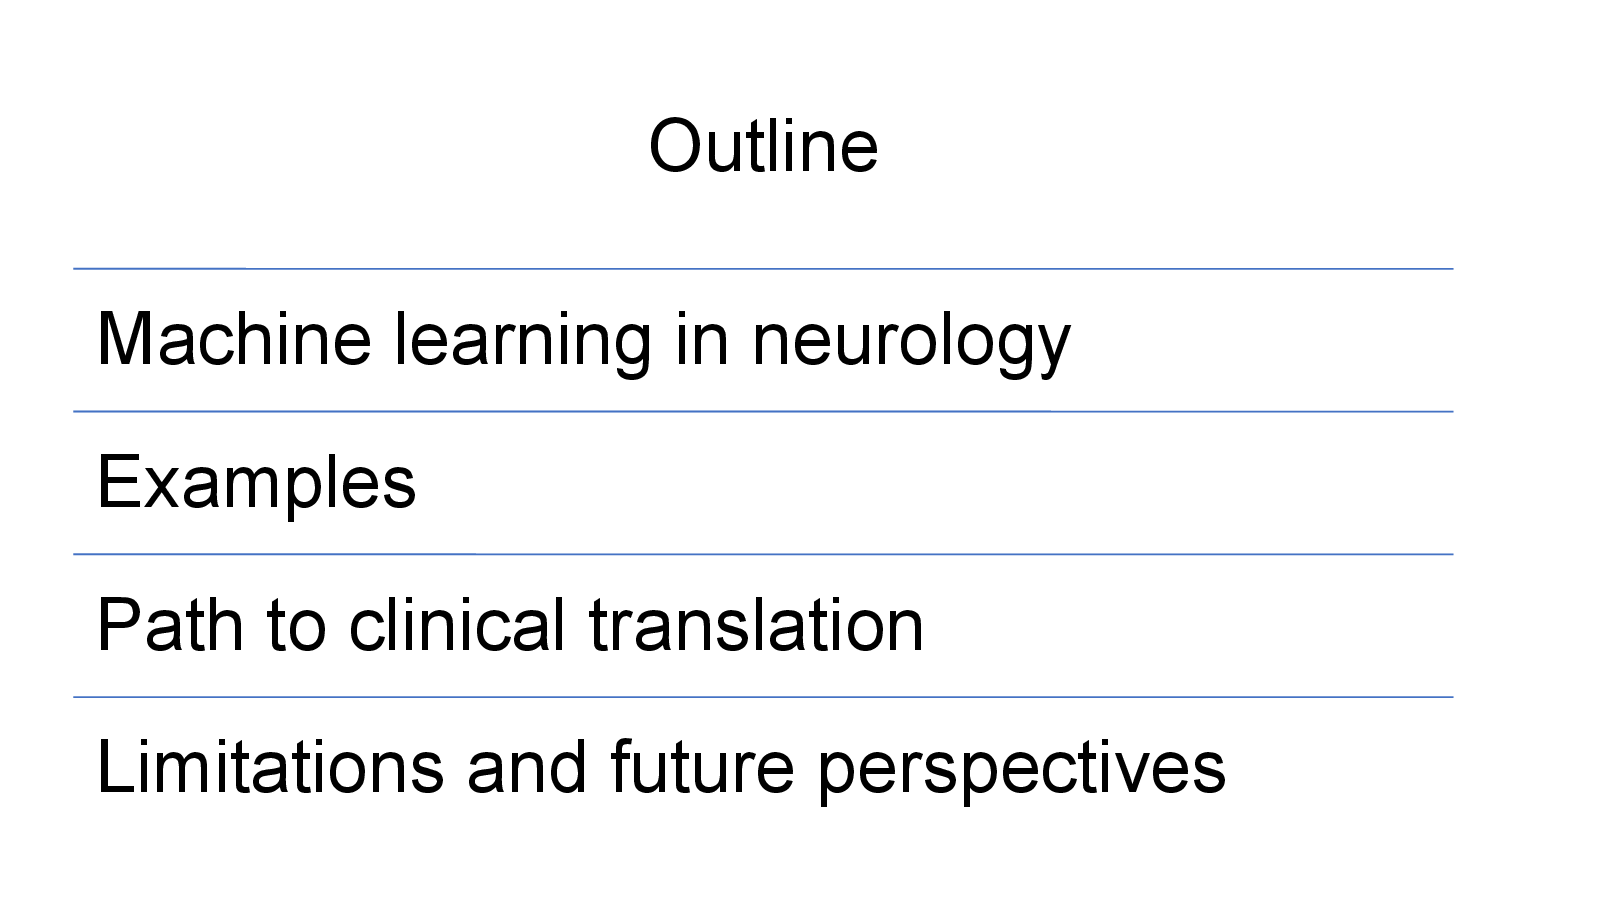
Deck outline
- The problem of disease heterogeneity
- Limits of clinical phenotype labels
- Regional atrophy and imaging-derived patterns
- Data-driven multiple sclerosis subtypes
- Prognosis and phenotypic conversion
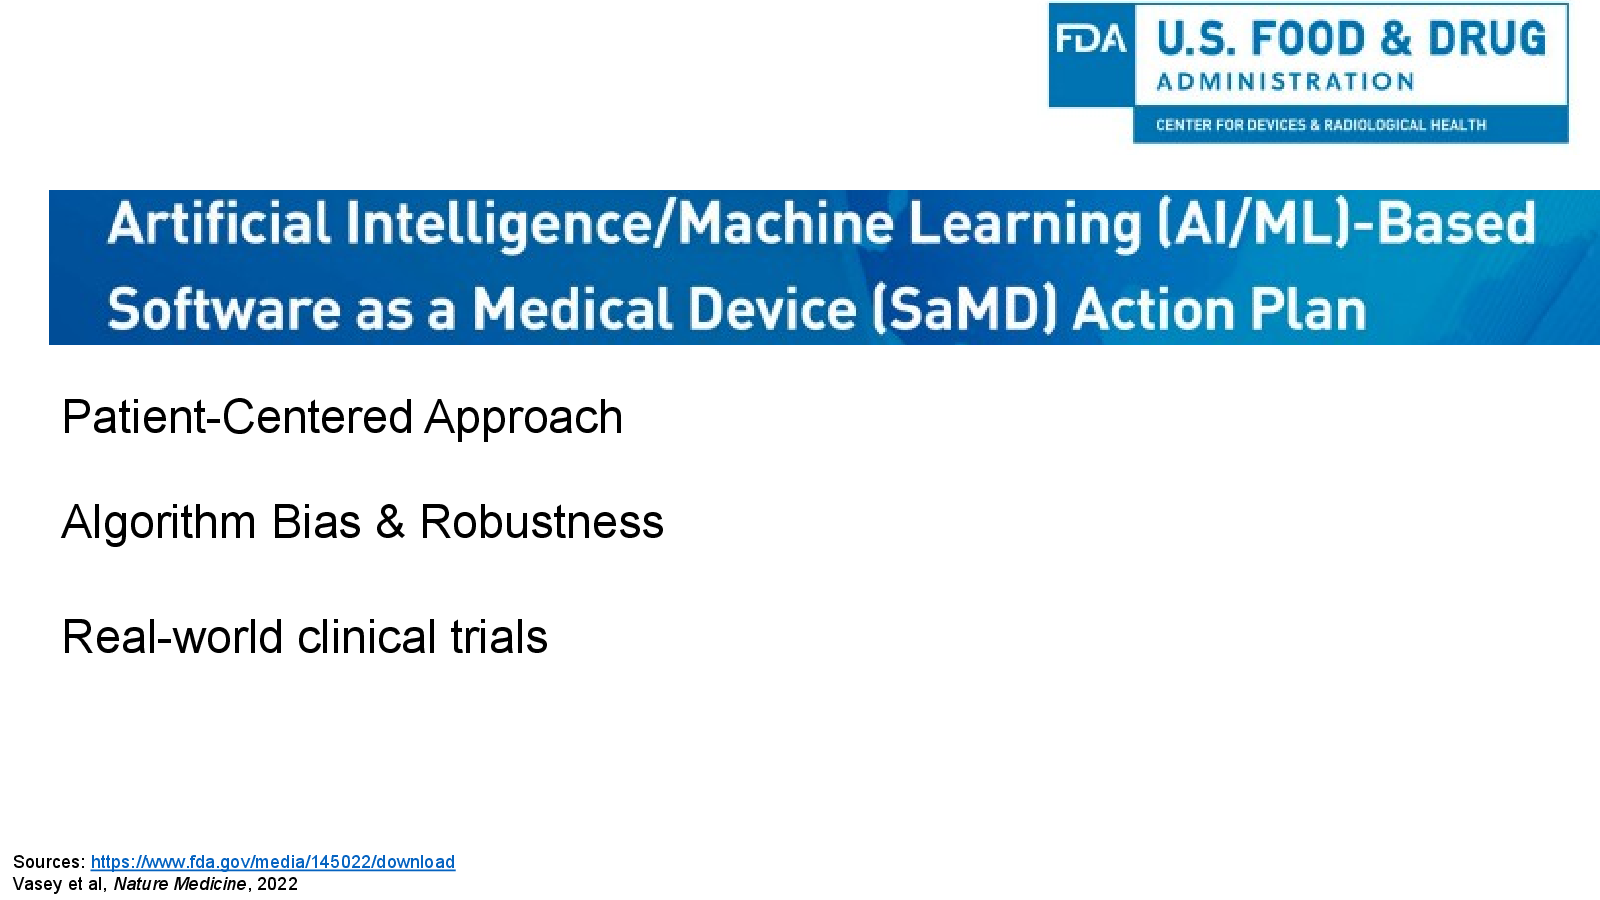
- Algorithmic bias, robustness and translation
Take-away
Data-driven imaging patterns offer a route from heterogeneous scans to more informative disease subtypes and individual prognosis.
Original deck
Slide by slide
Read the 26-slide presentation in order, or use the index to jump.
Slide 01
Using artificial intelligence and multimodal imaging to understand multiple sclerosis
Slide 02
Disclosures
Slide 03
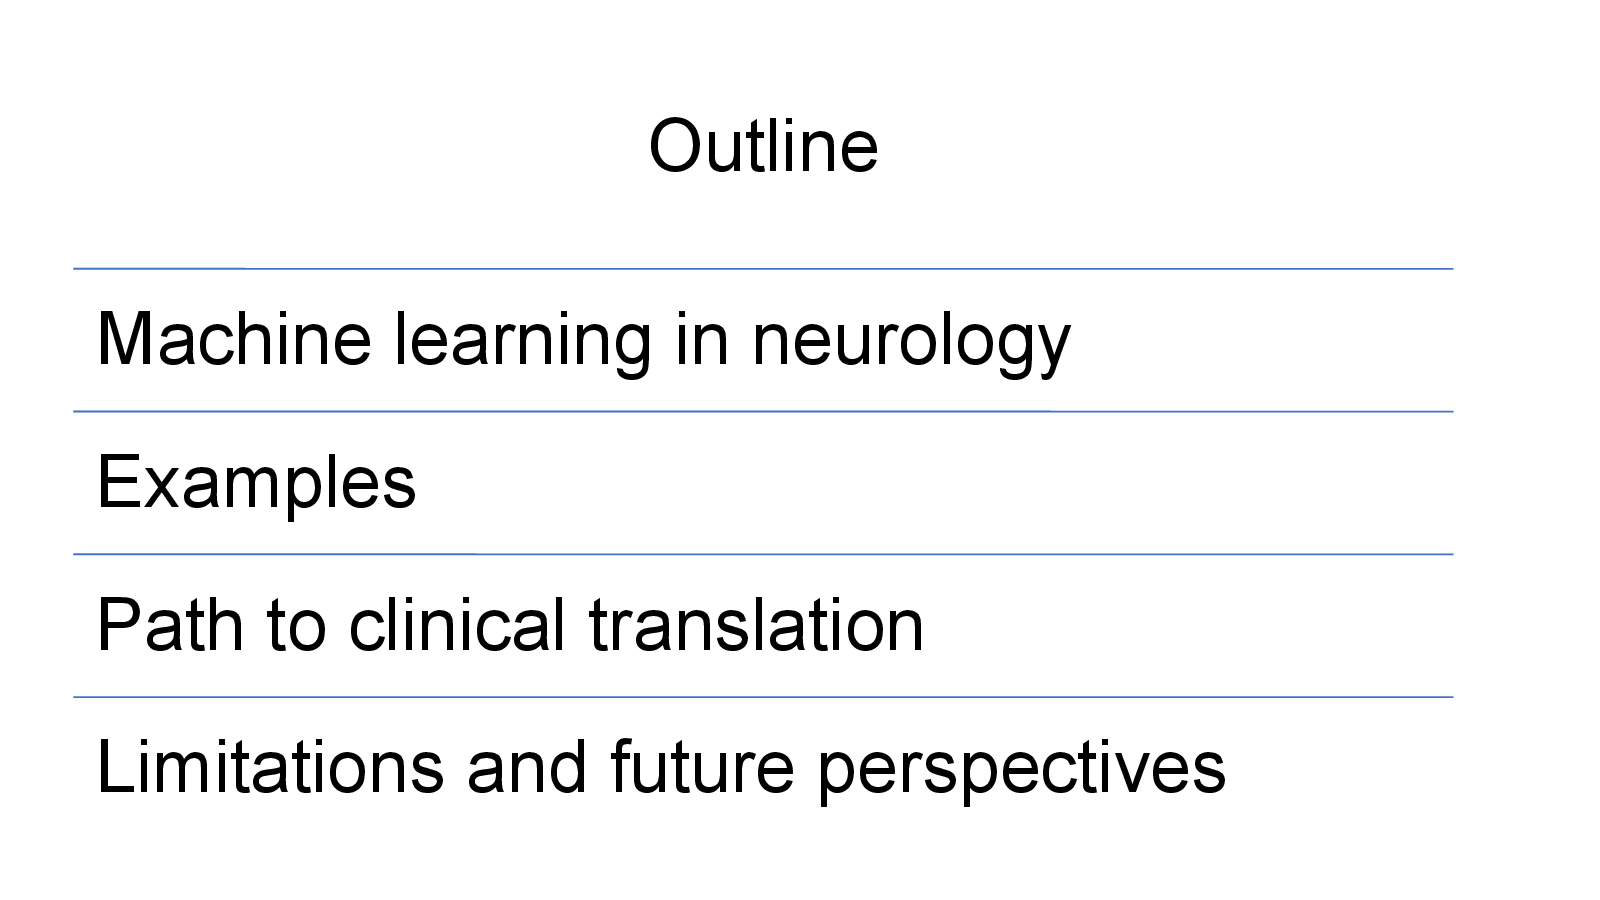
Outline
Slide 04
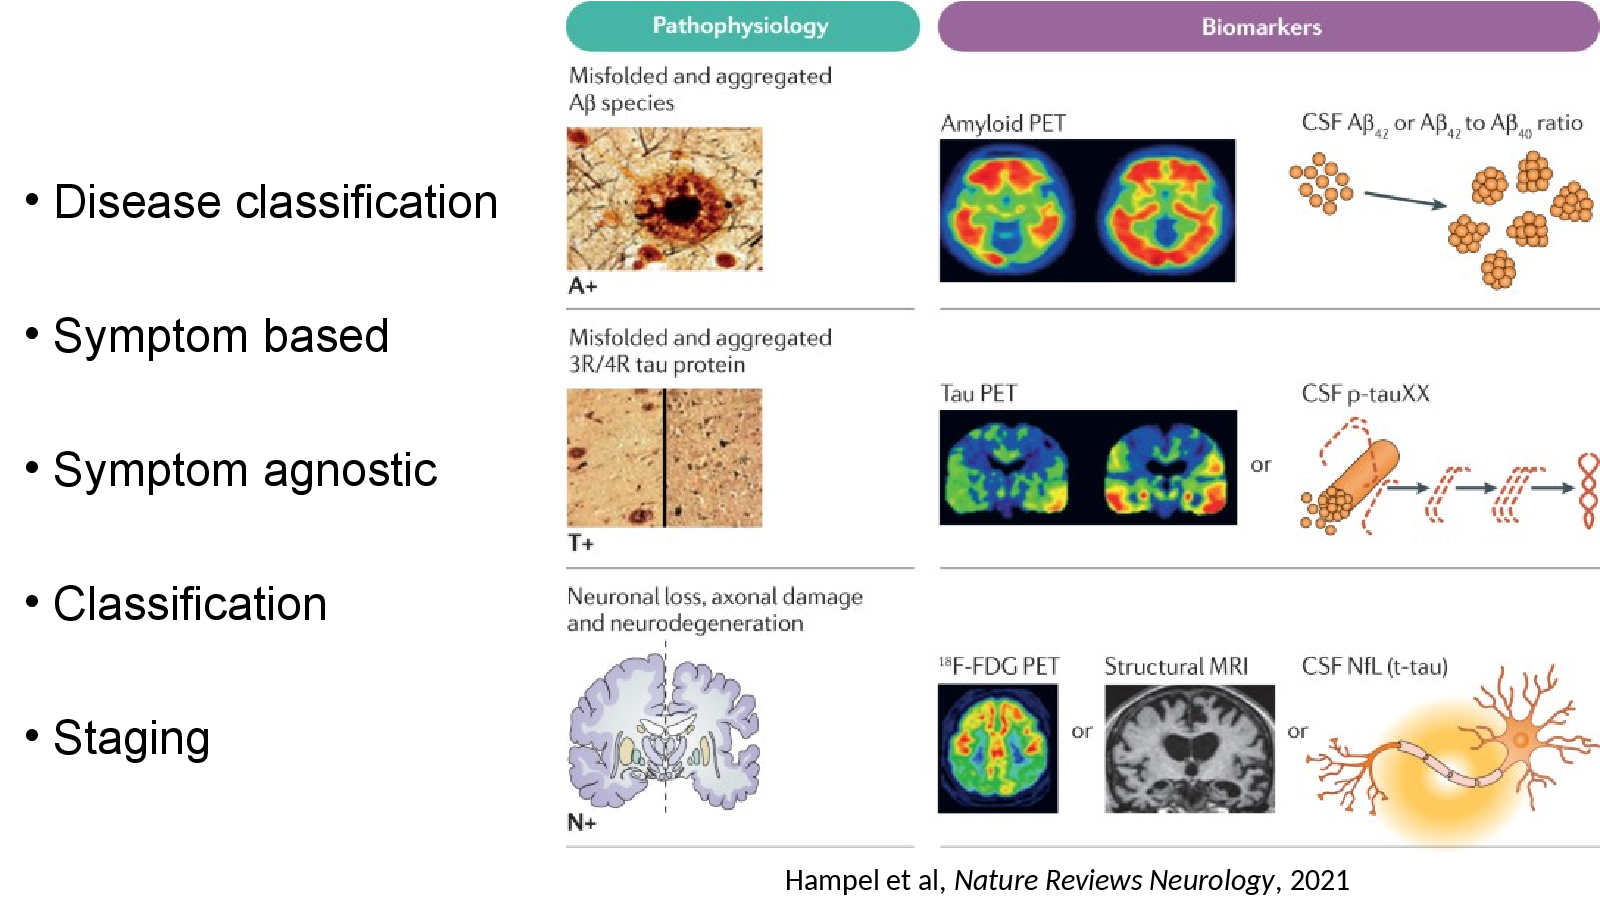
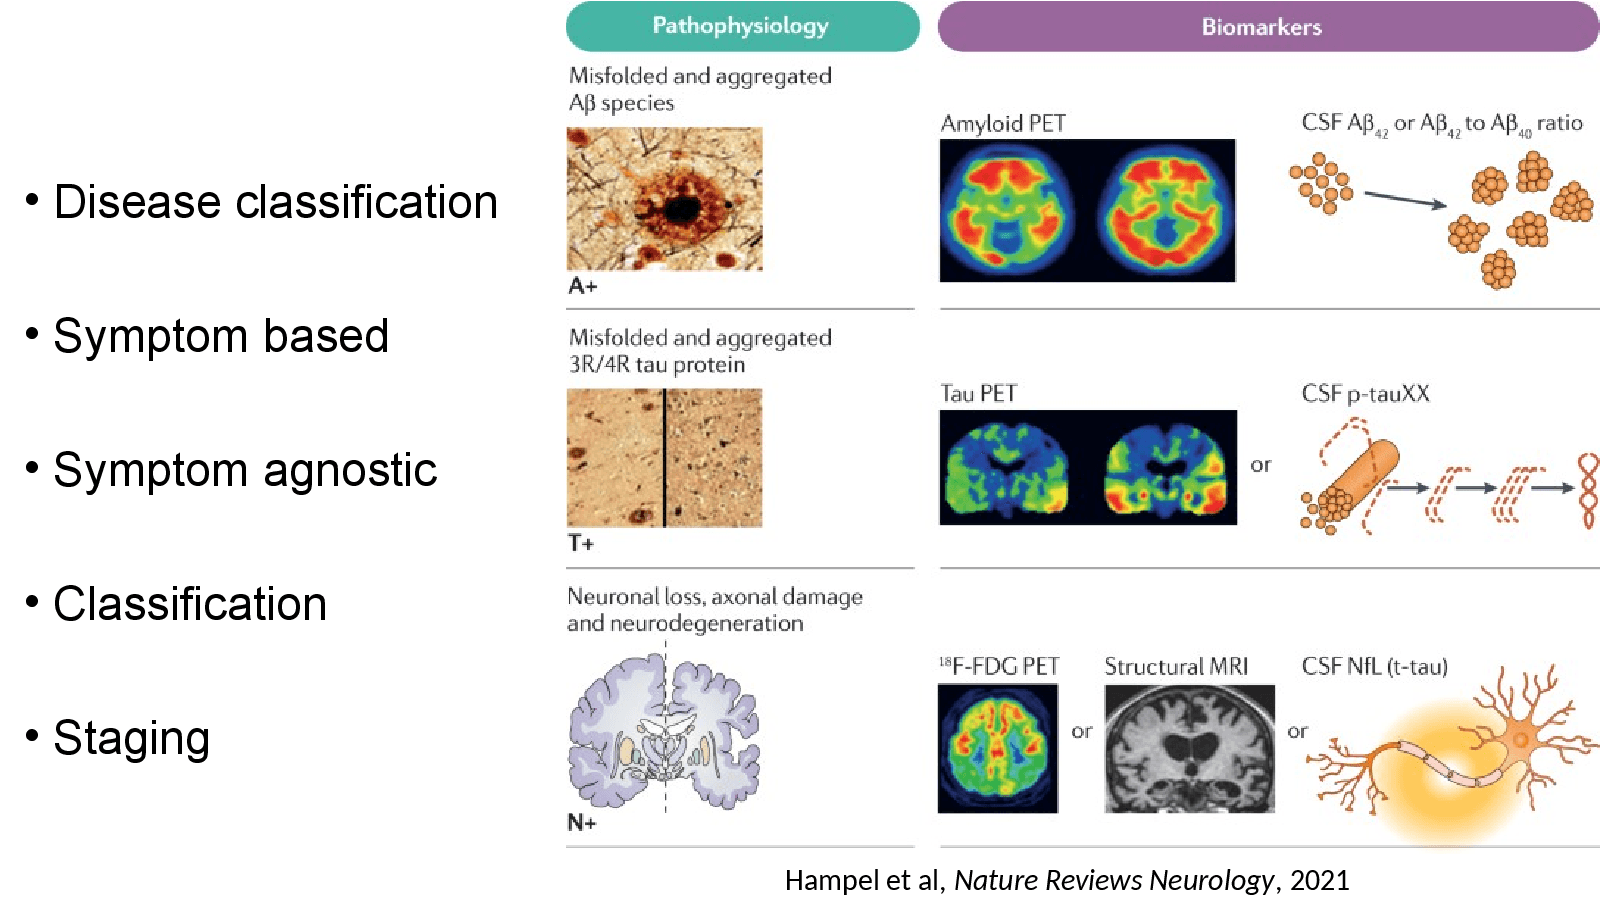
Hampel et al, Nature Reviews Neurology, 2021
Slide 05
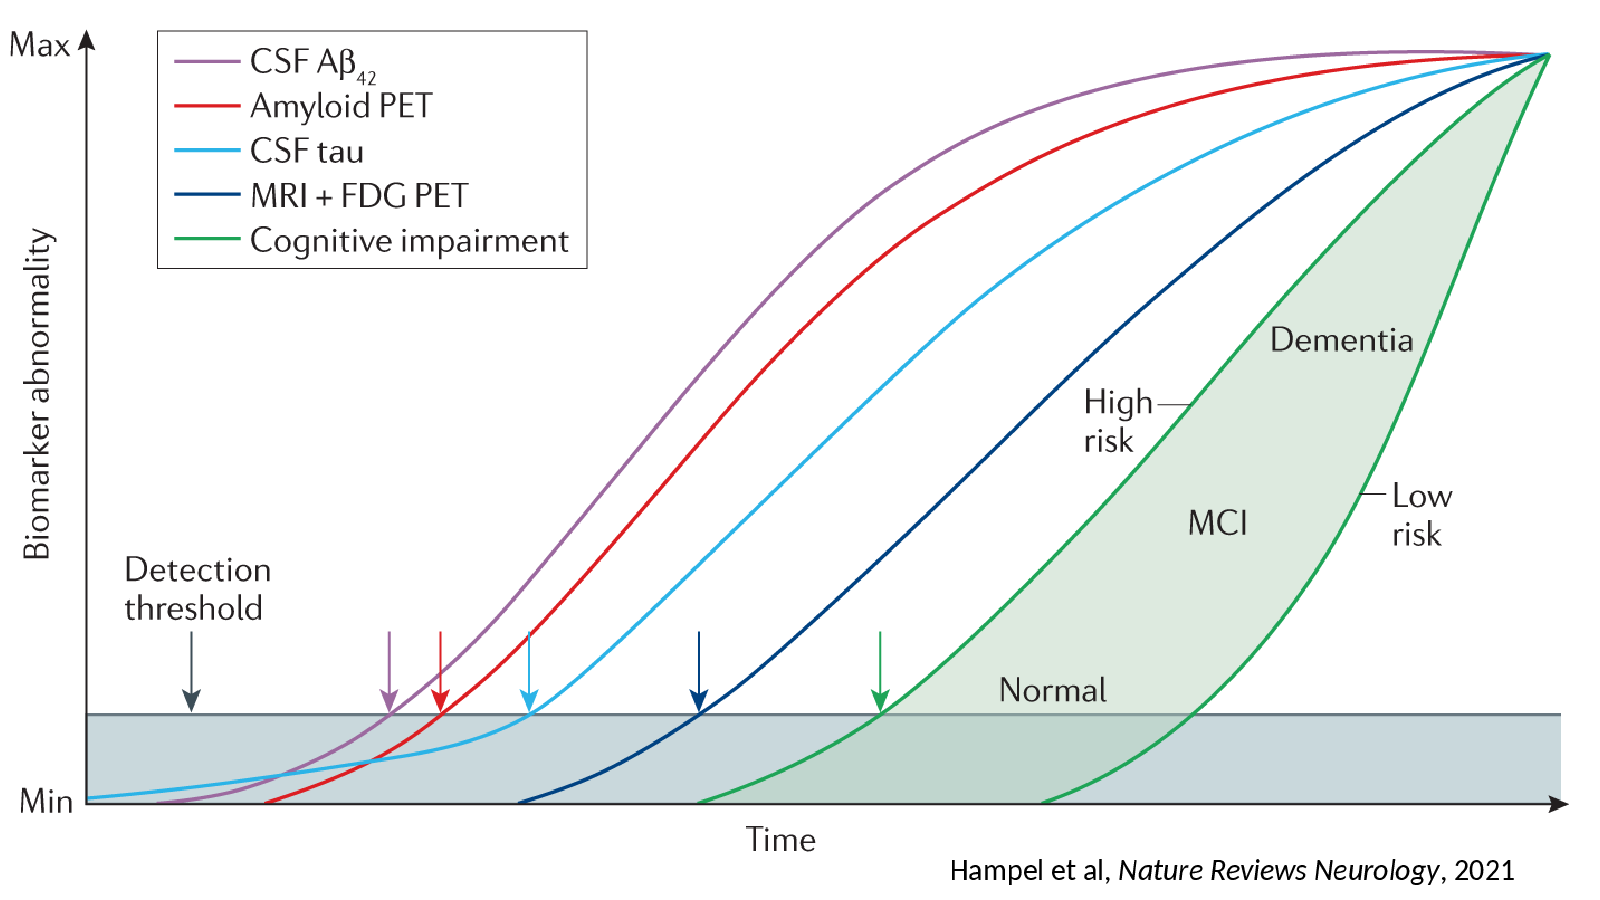
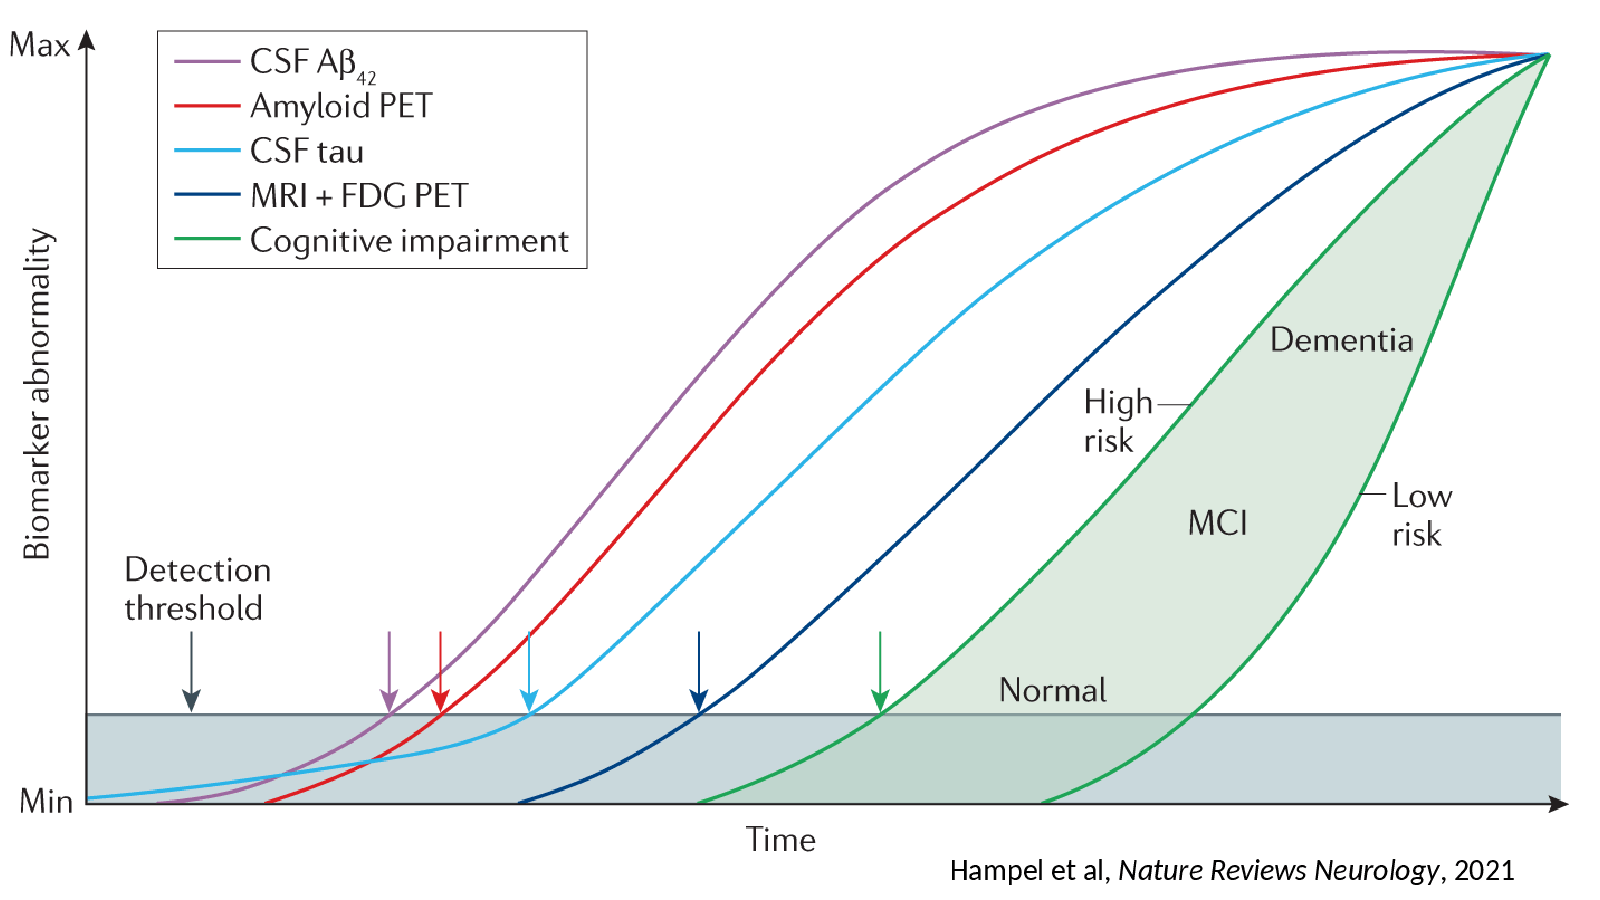
Hampel et al, Nature Reviews Neurology, 2021
Slide 06
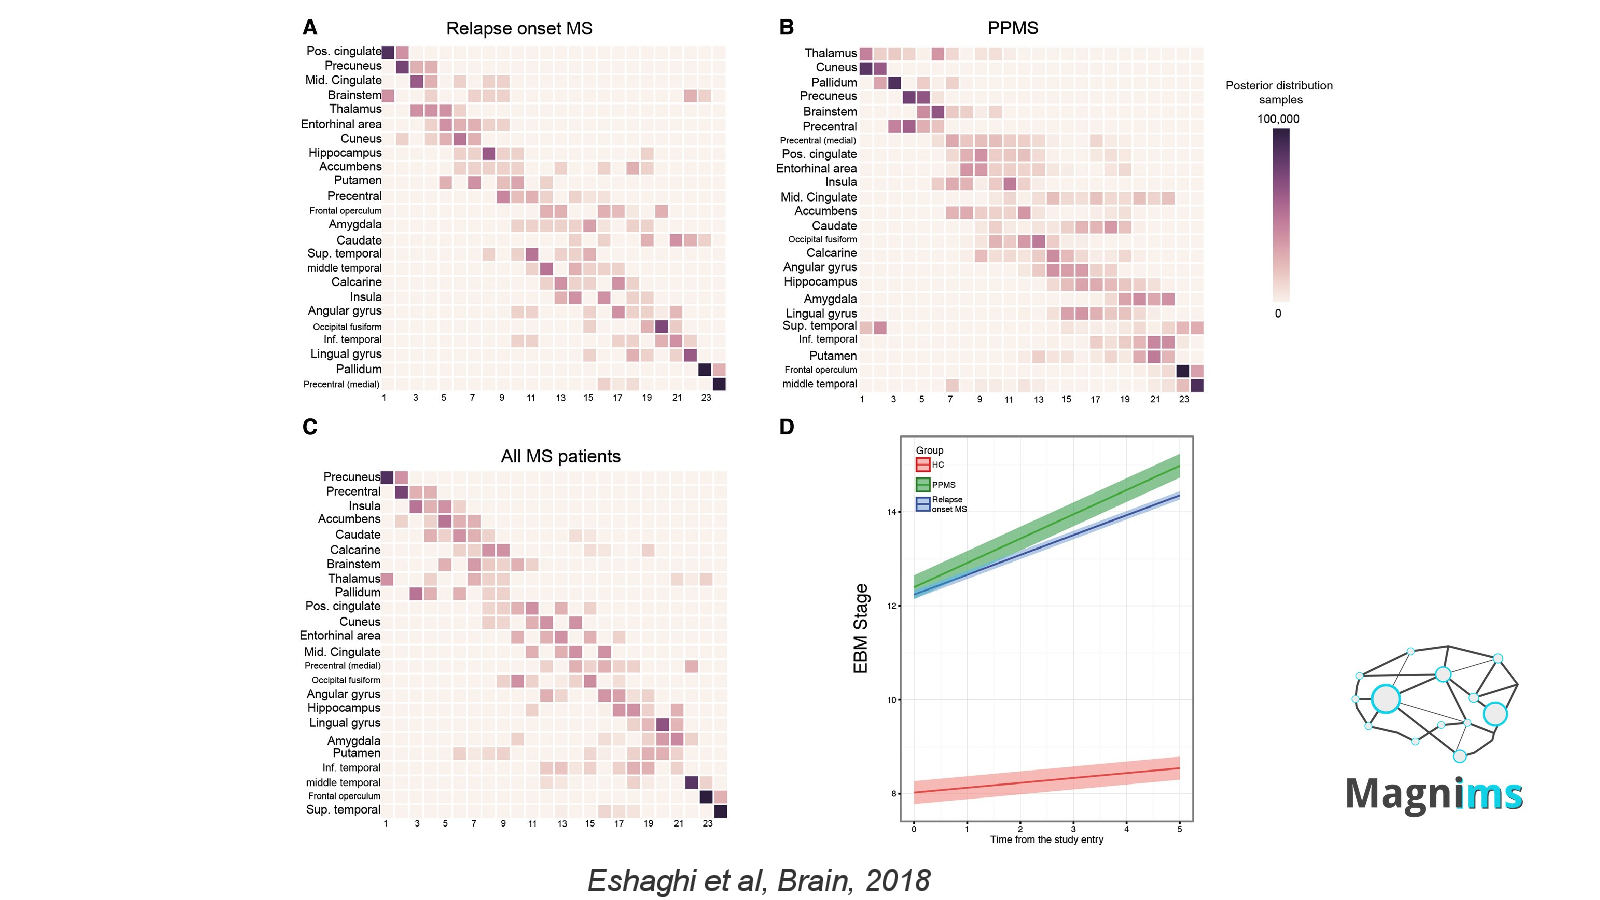
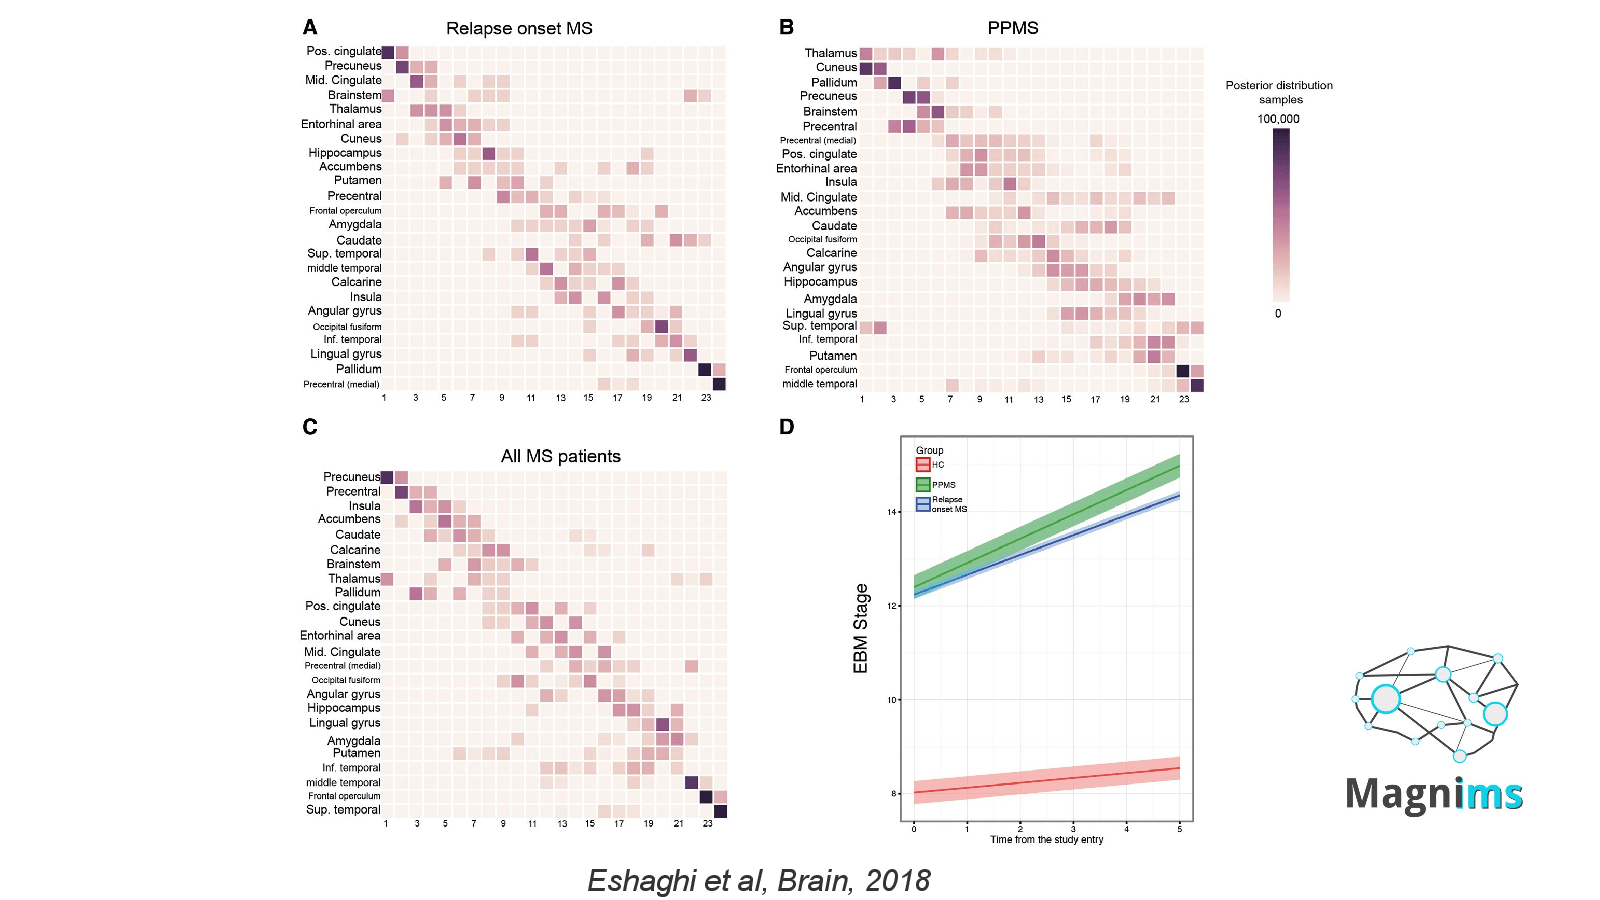
Sequences of atrophy progression and patient staging
Slide 07
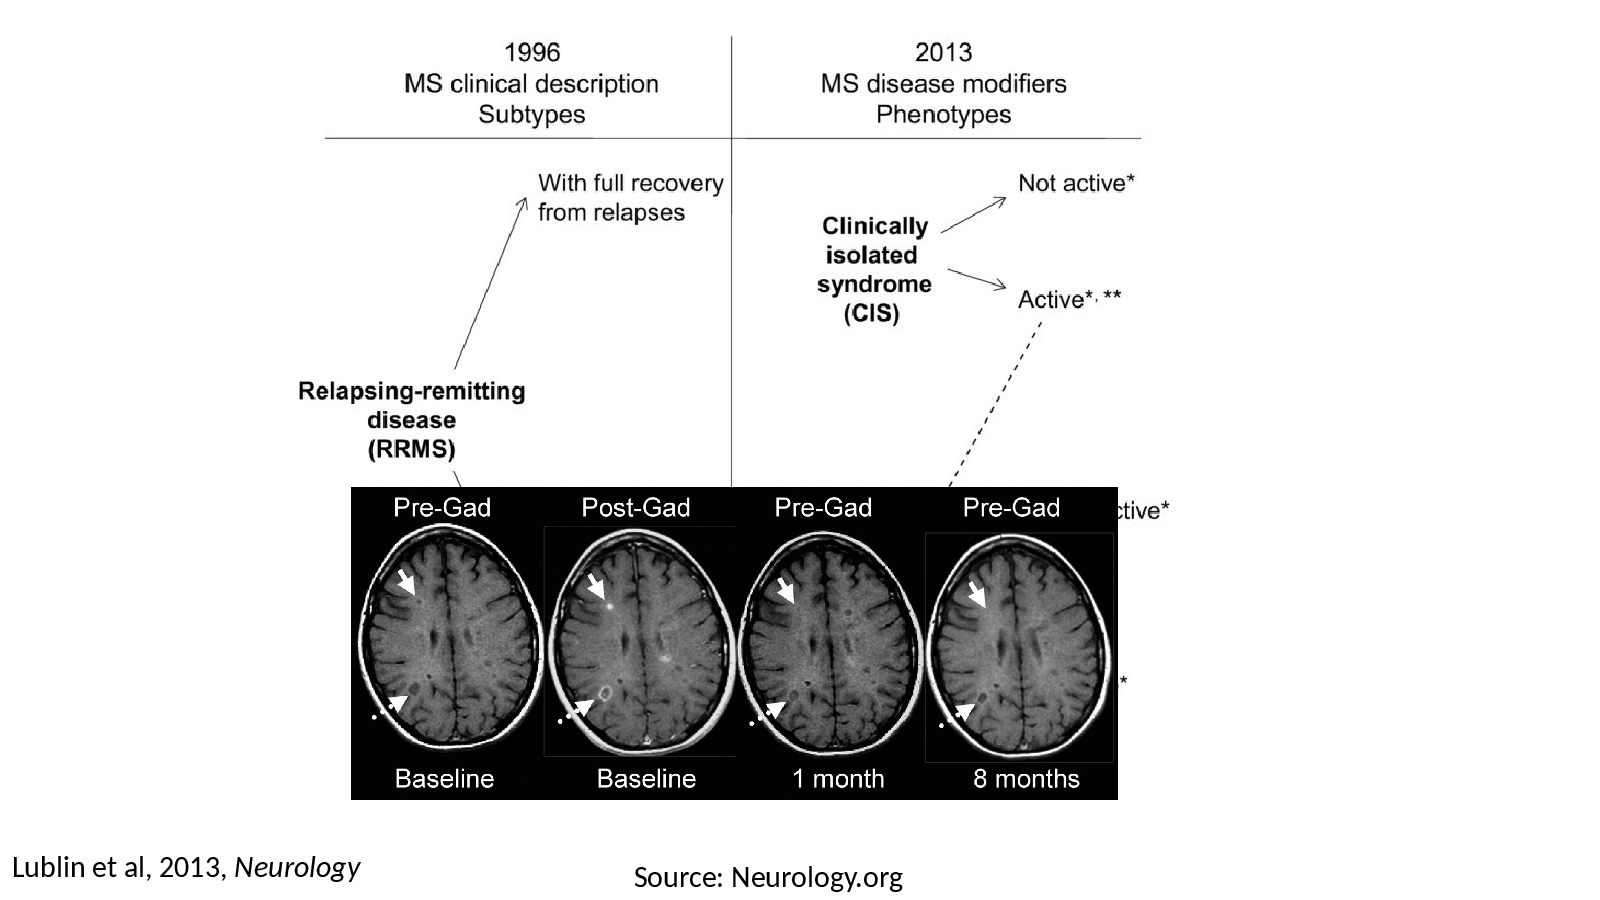
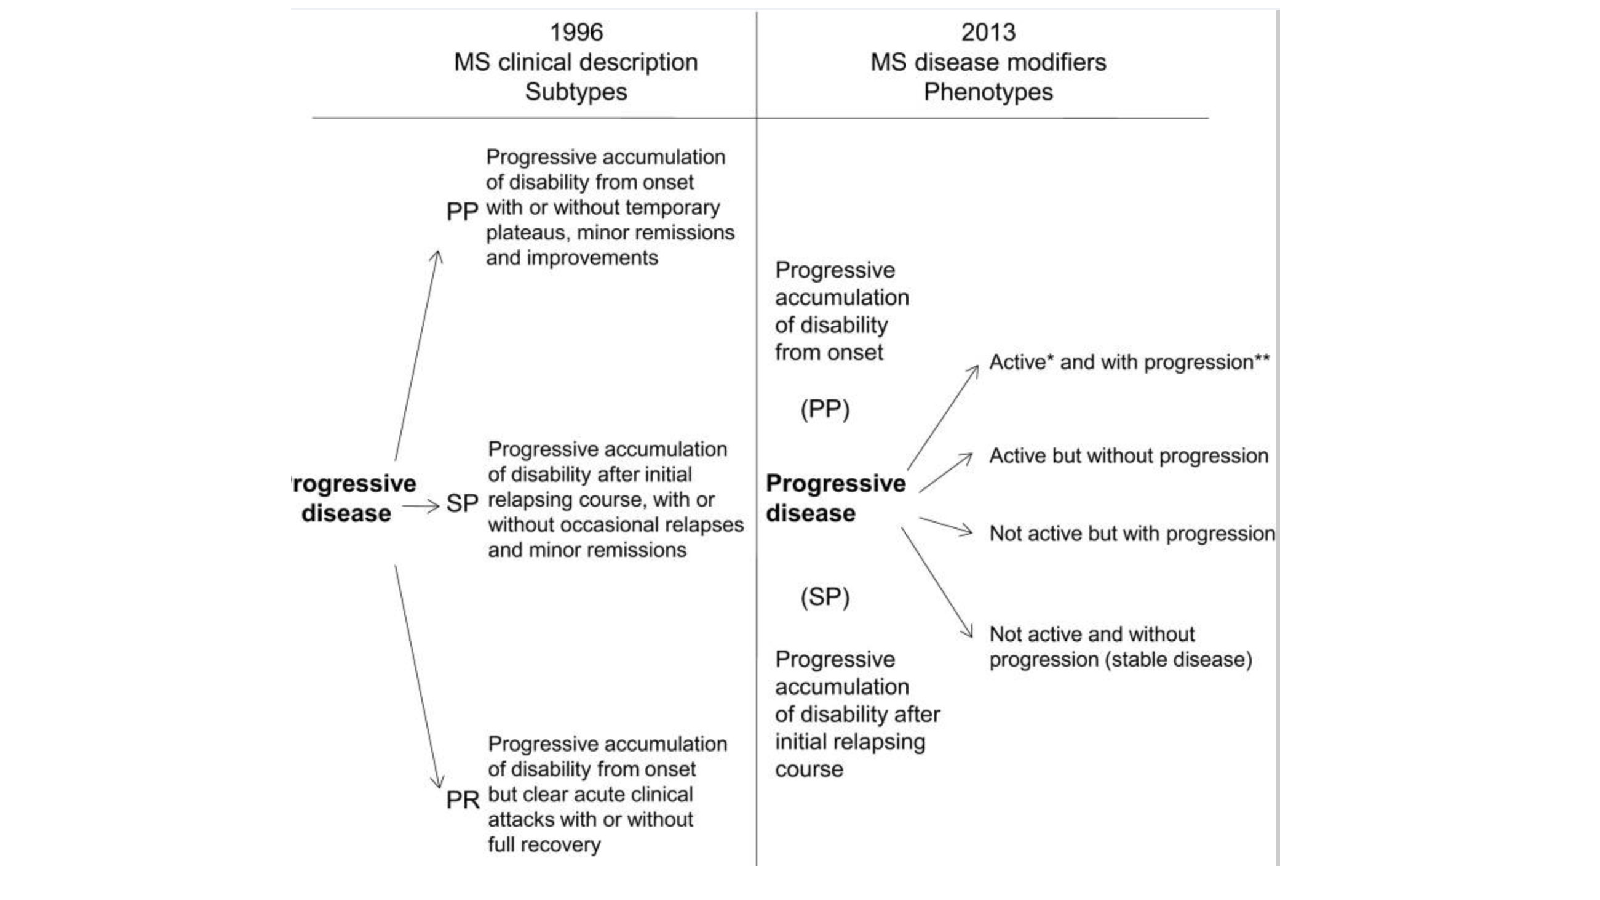
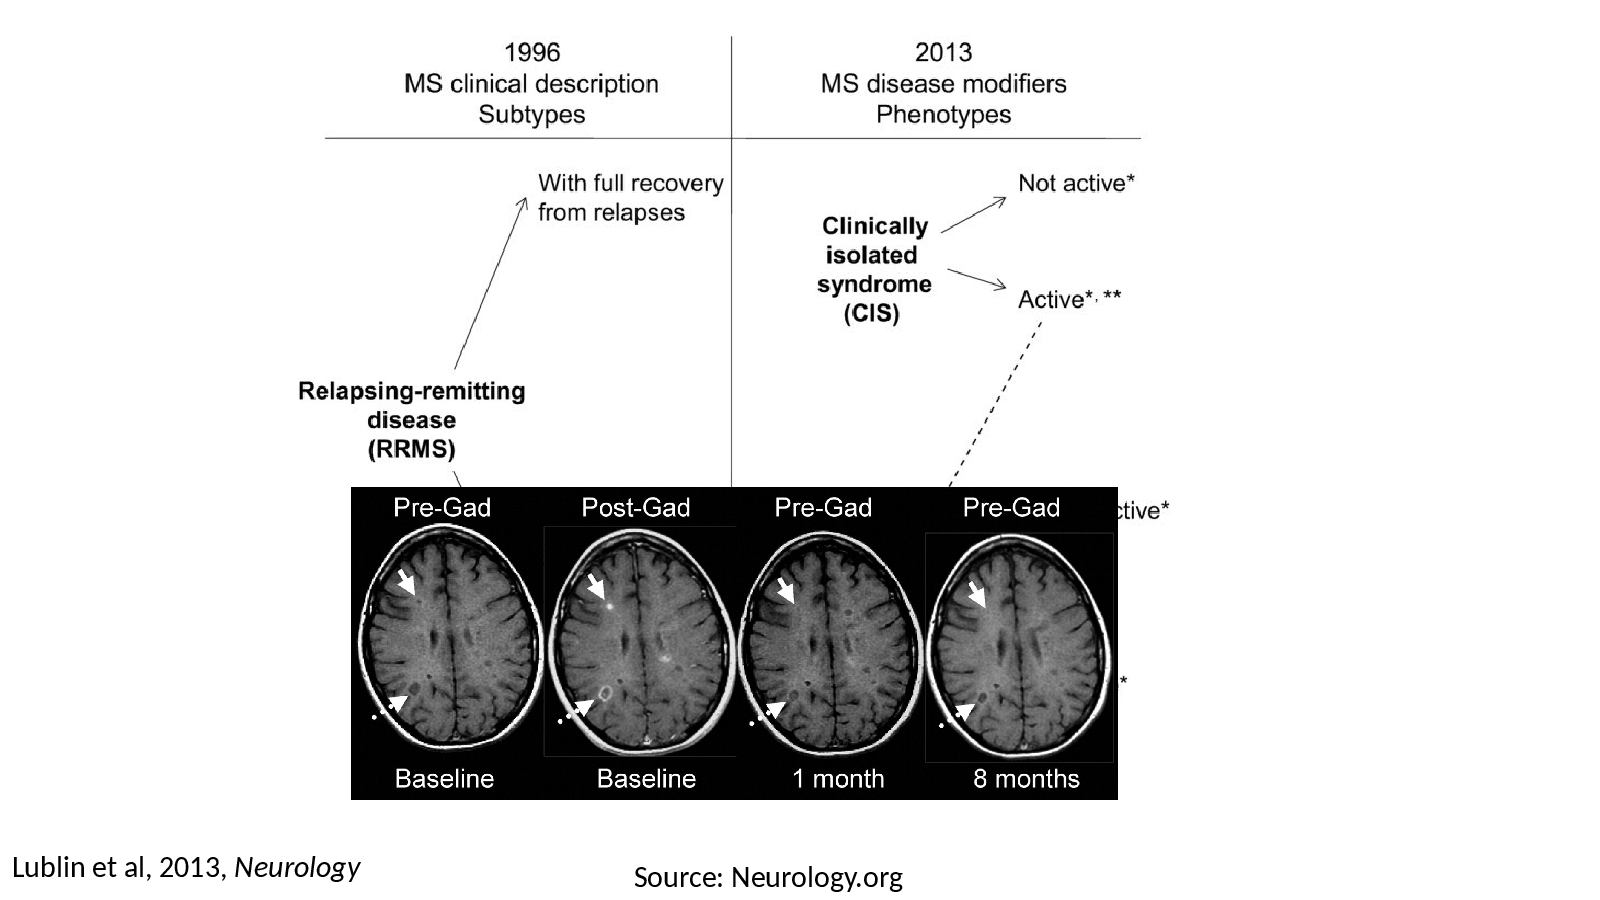
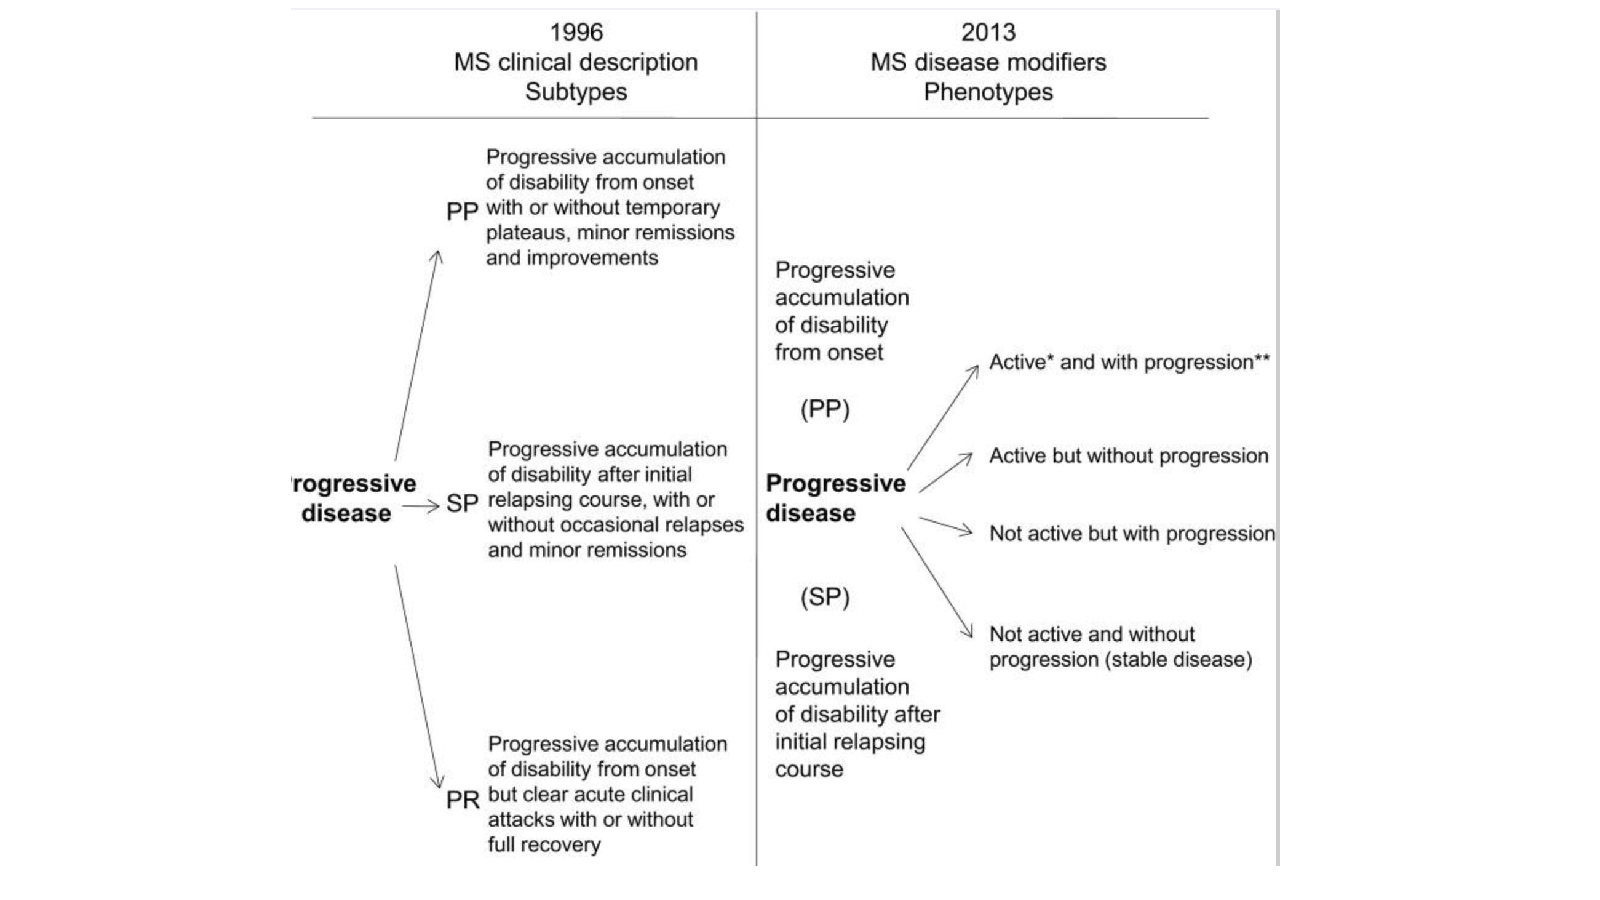
Lublin et al, 2013, Neurology
Slide 08
Slide 8
Slide 09
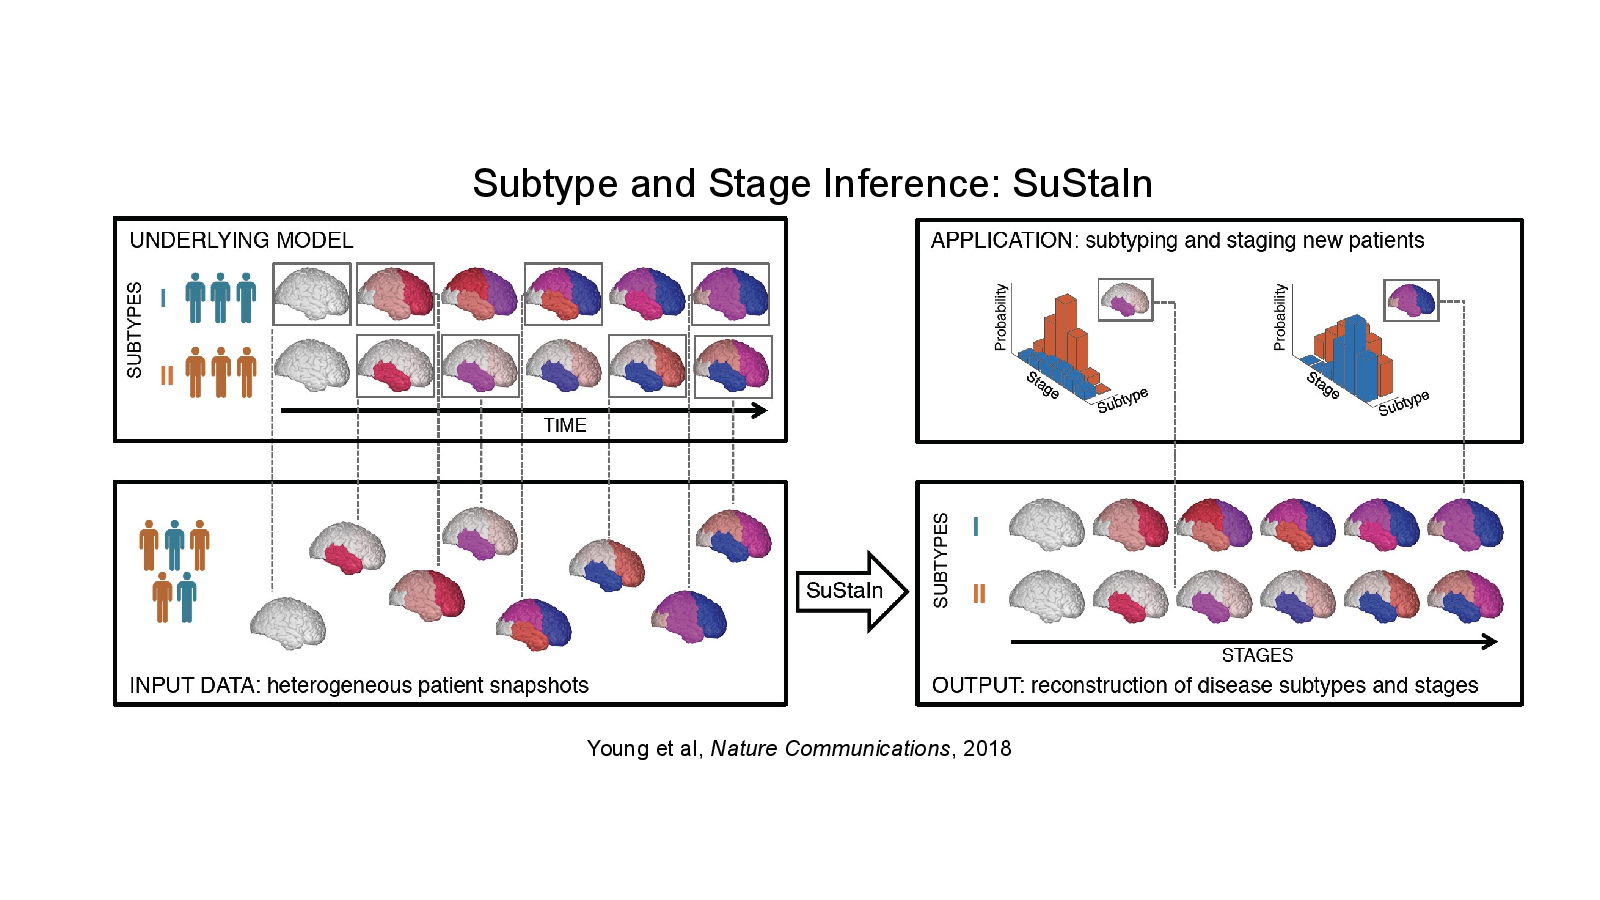
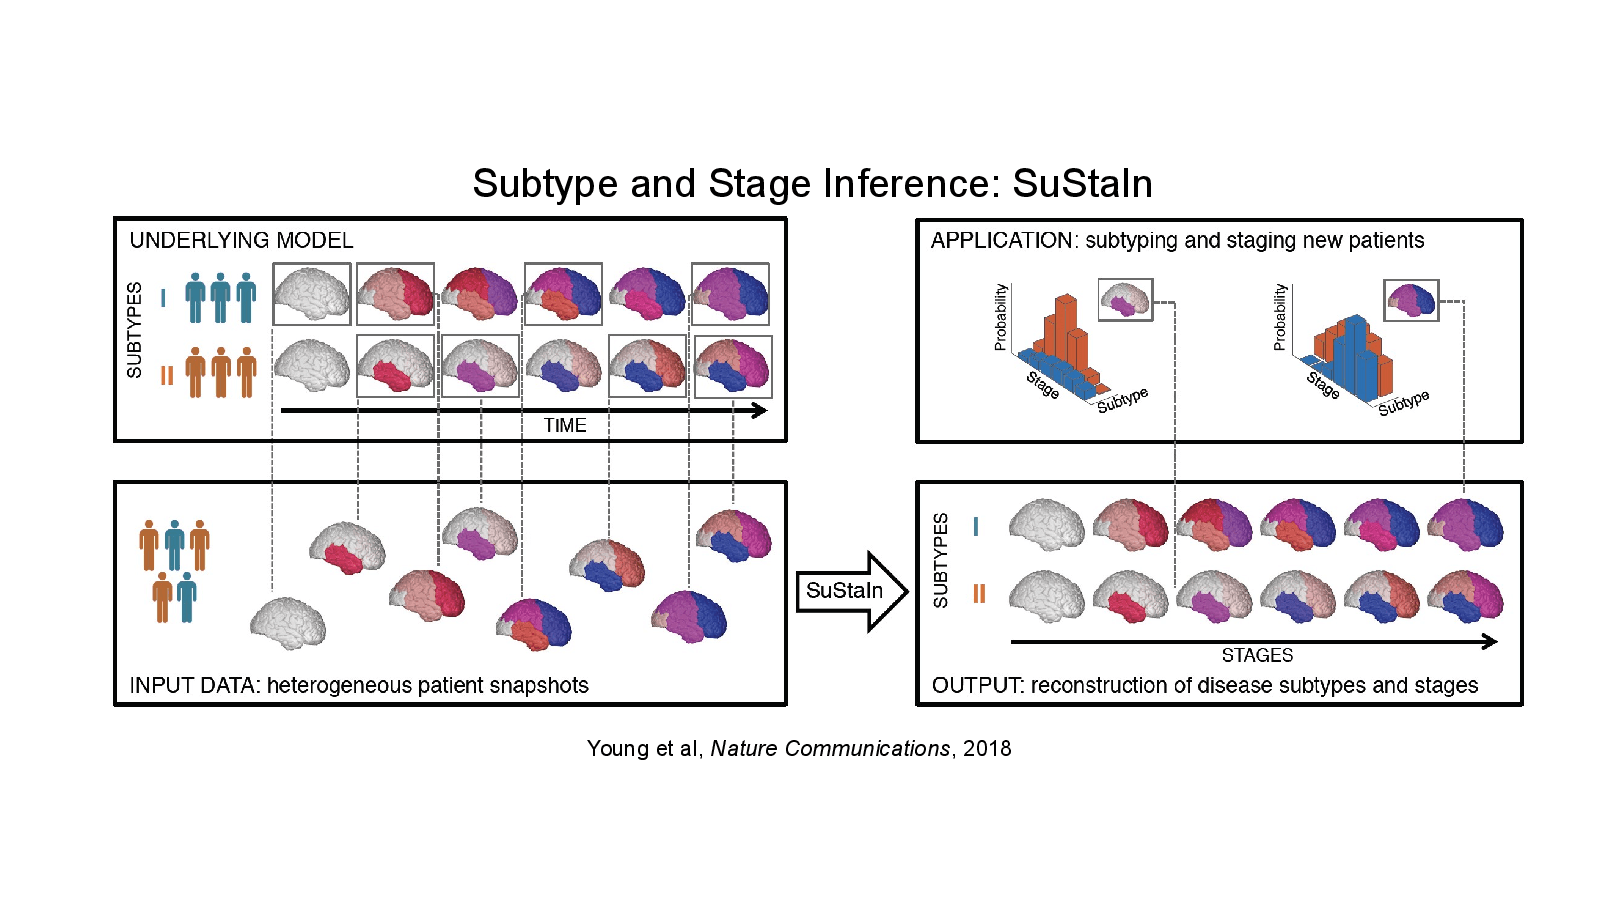
Young et al, Nature Communications, 2018
Slide 10
Slide 10
Slide 11
Slide 11
Slide 12
Slide 12
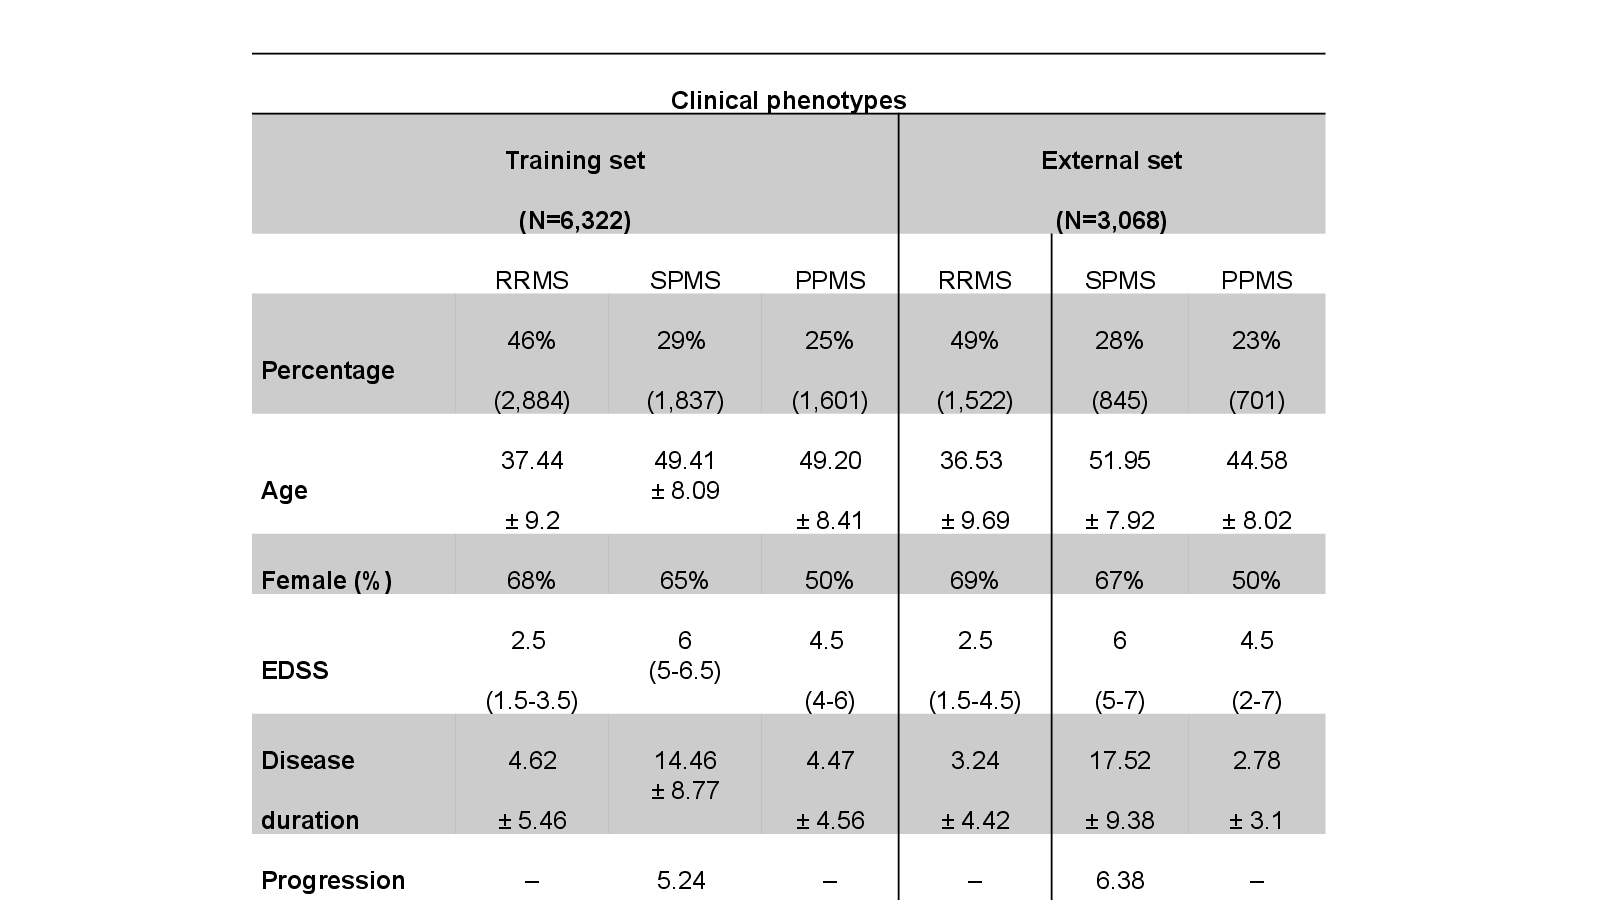
Slide 13
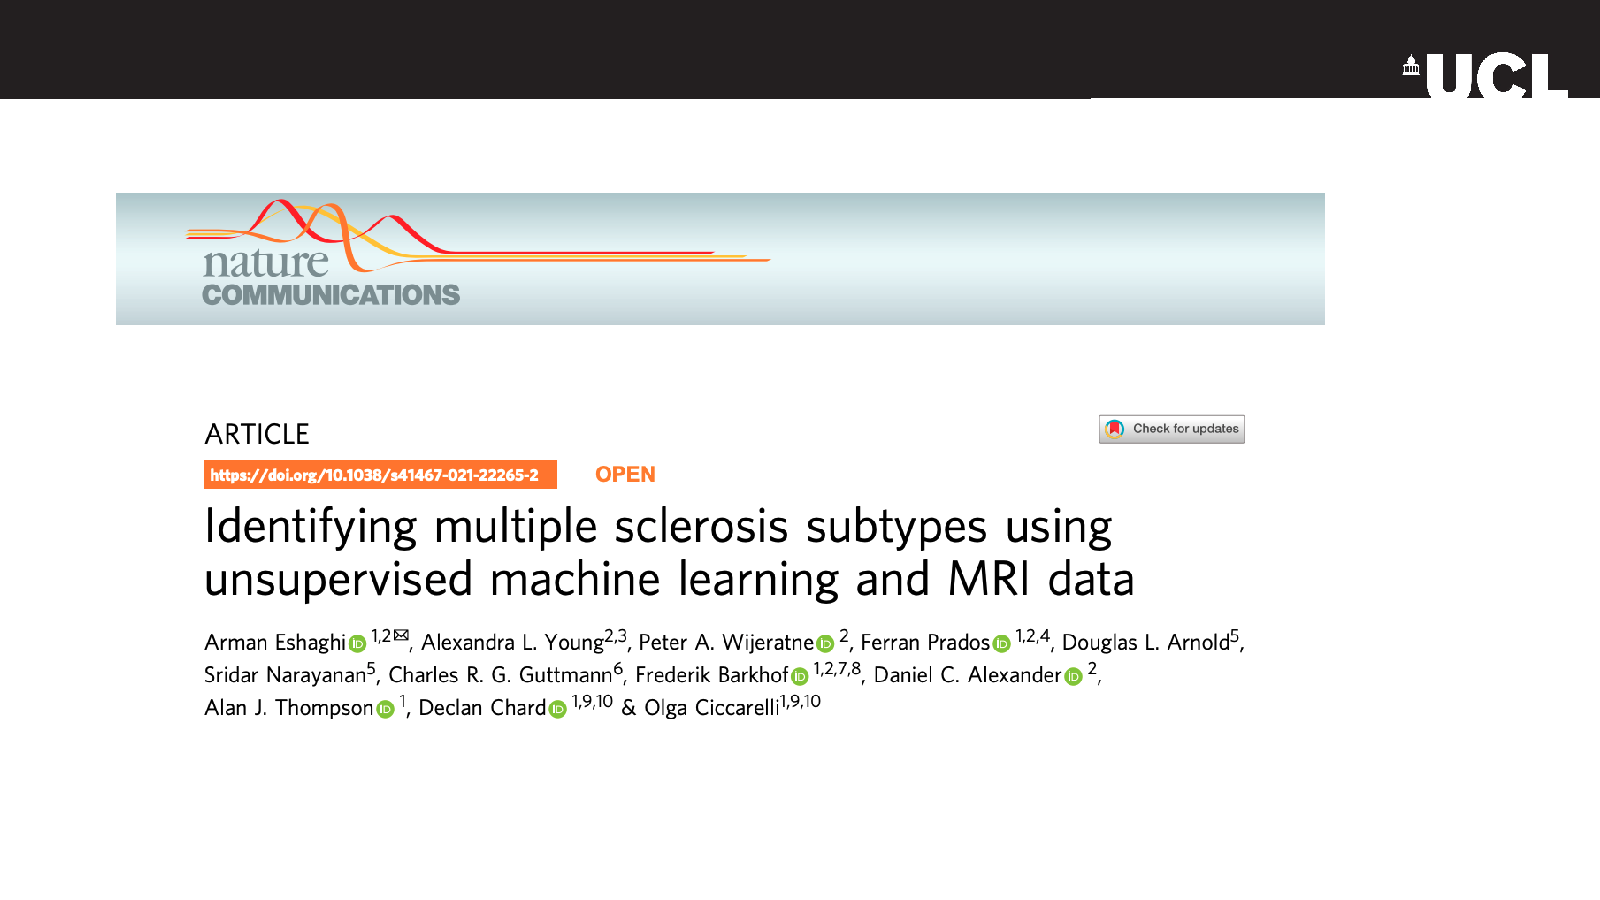
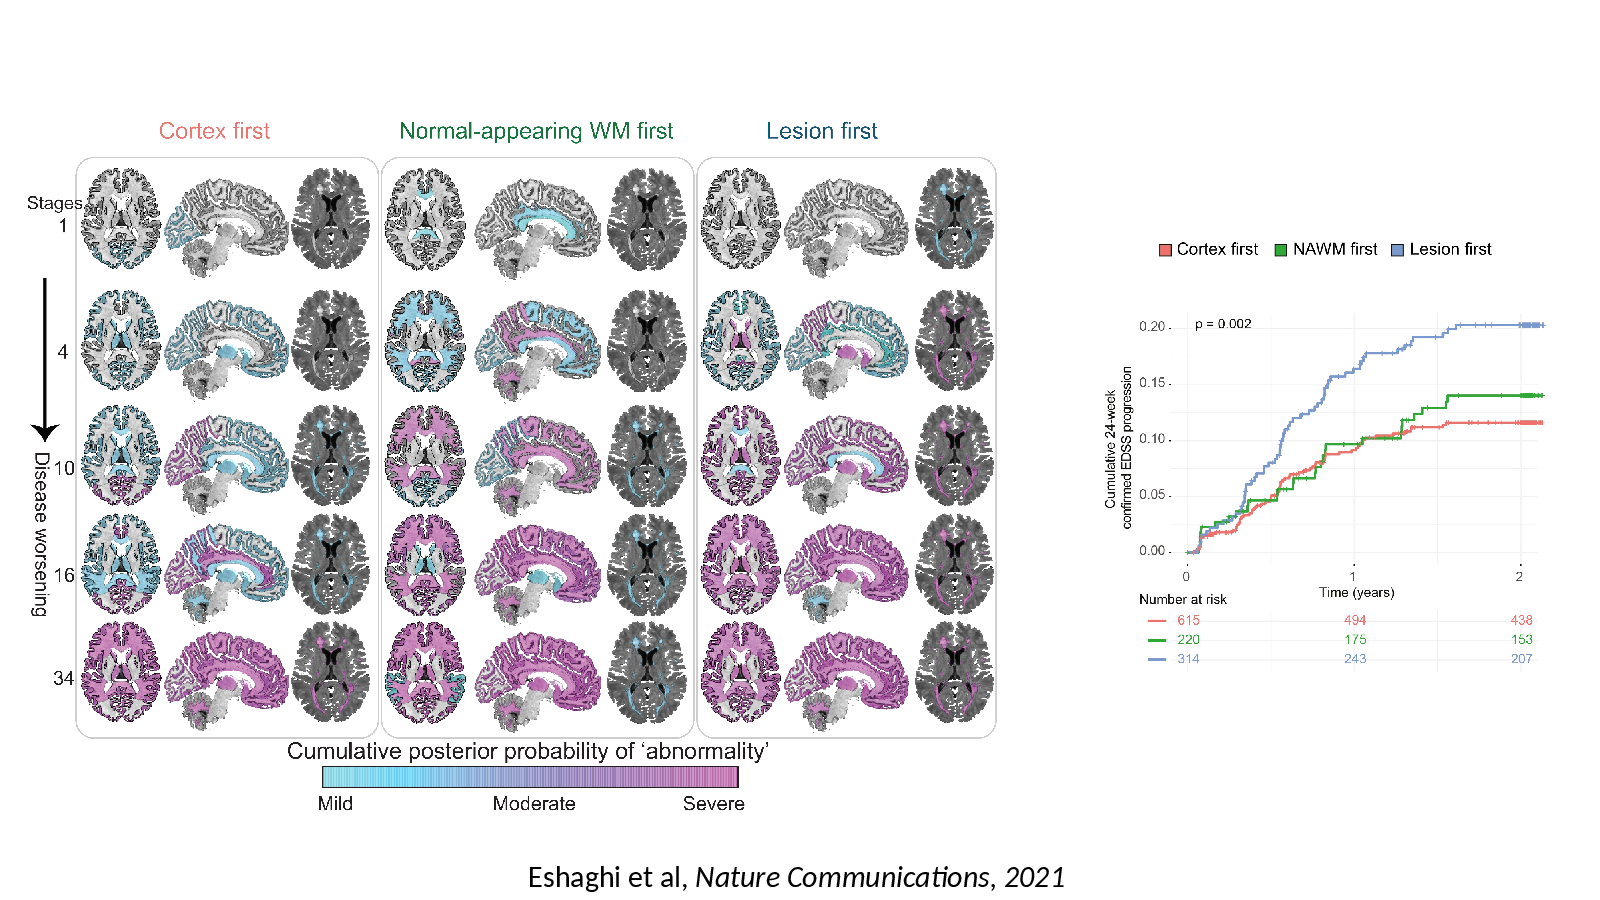
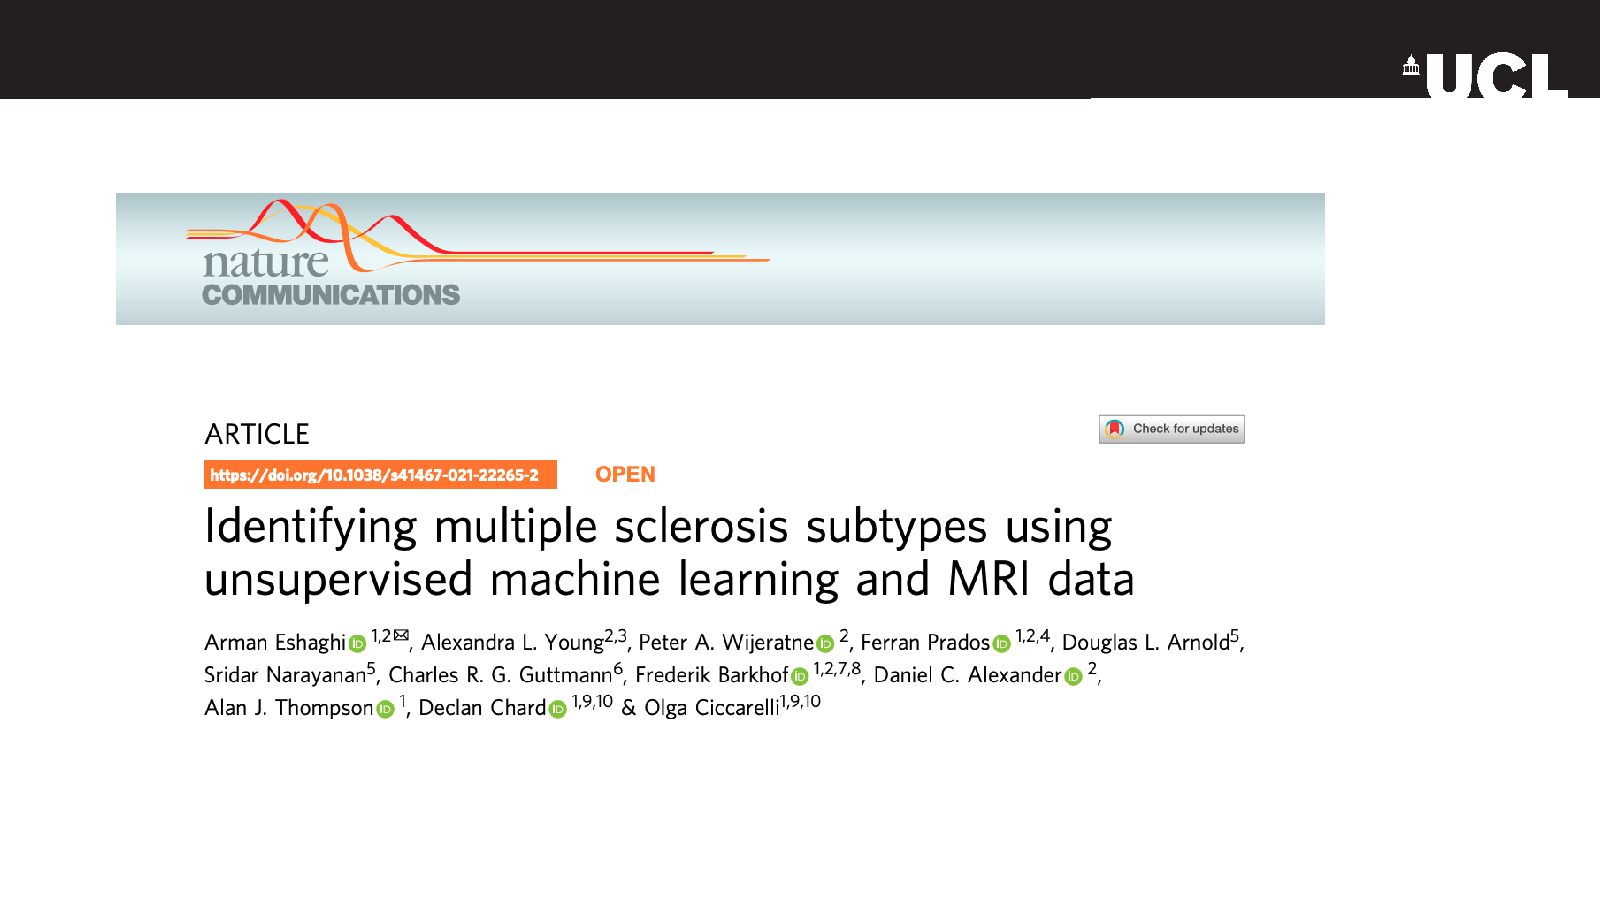
Eshaghi et al, Nature Communications, 2021
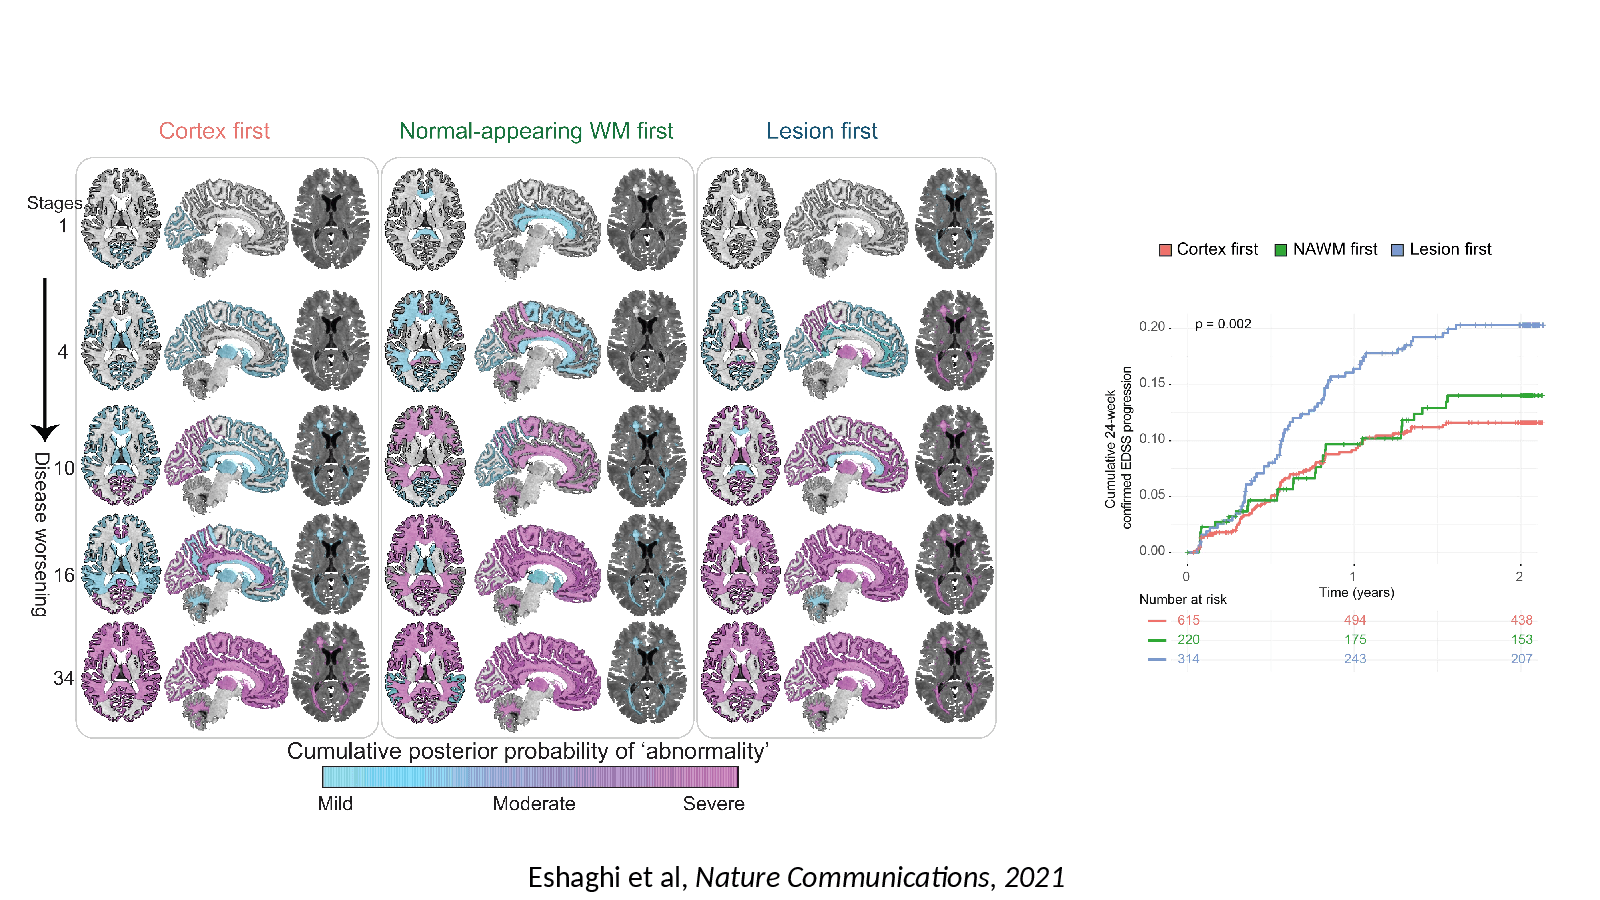
Slide 14
Slide 14
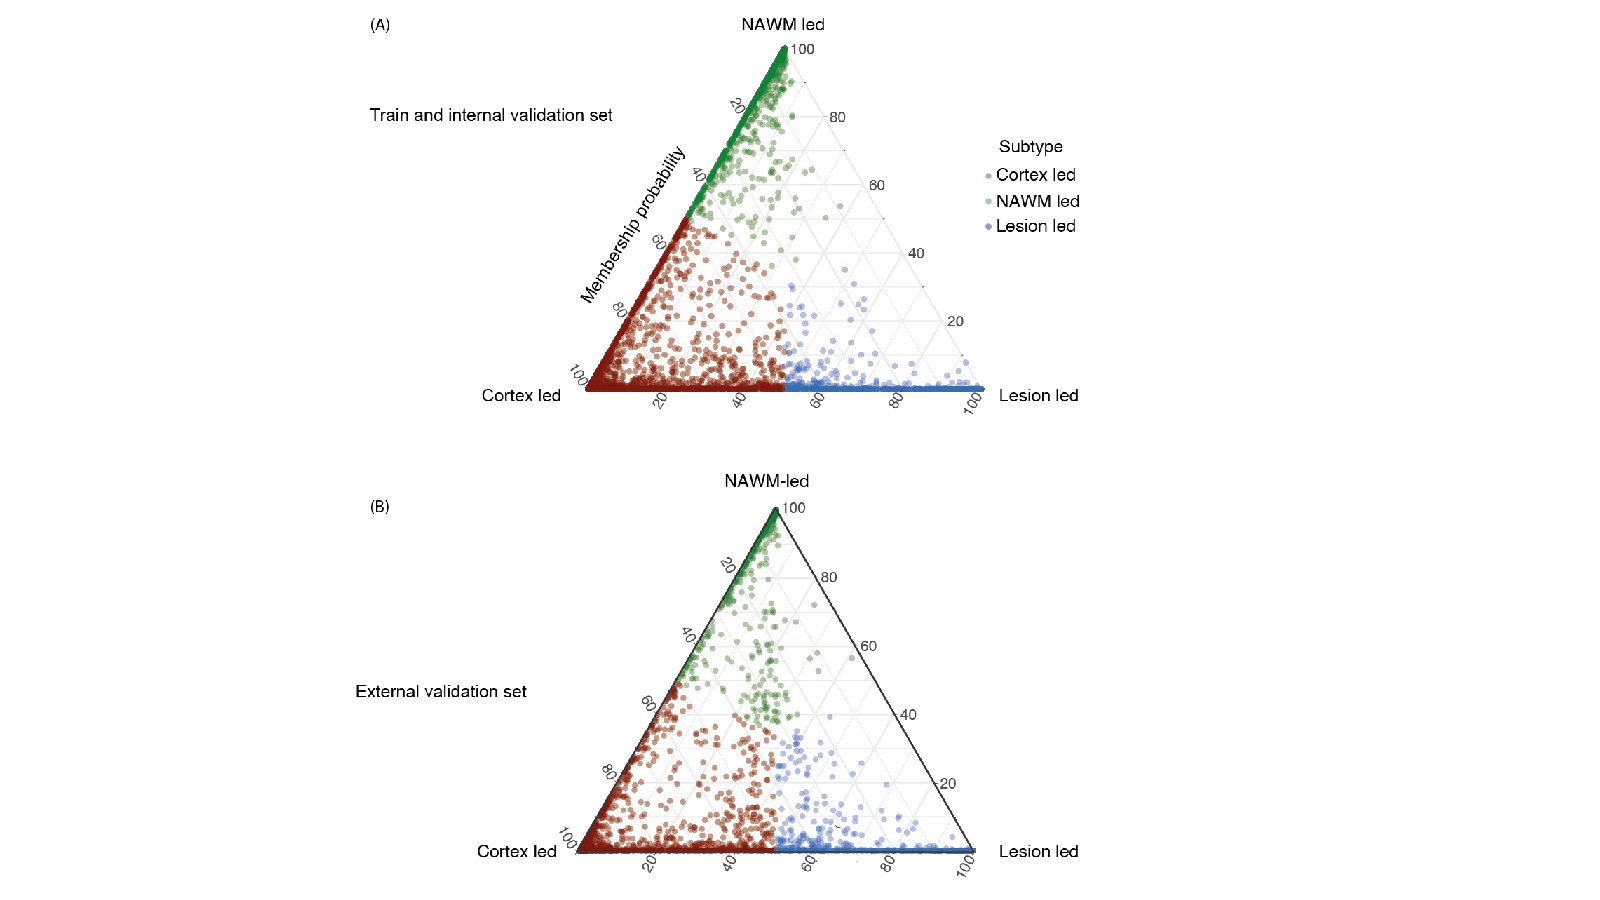
Slide 15
Slide 15
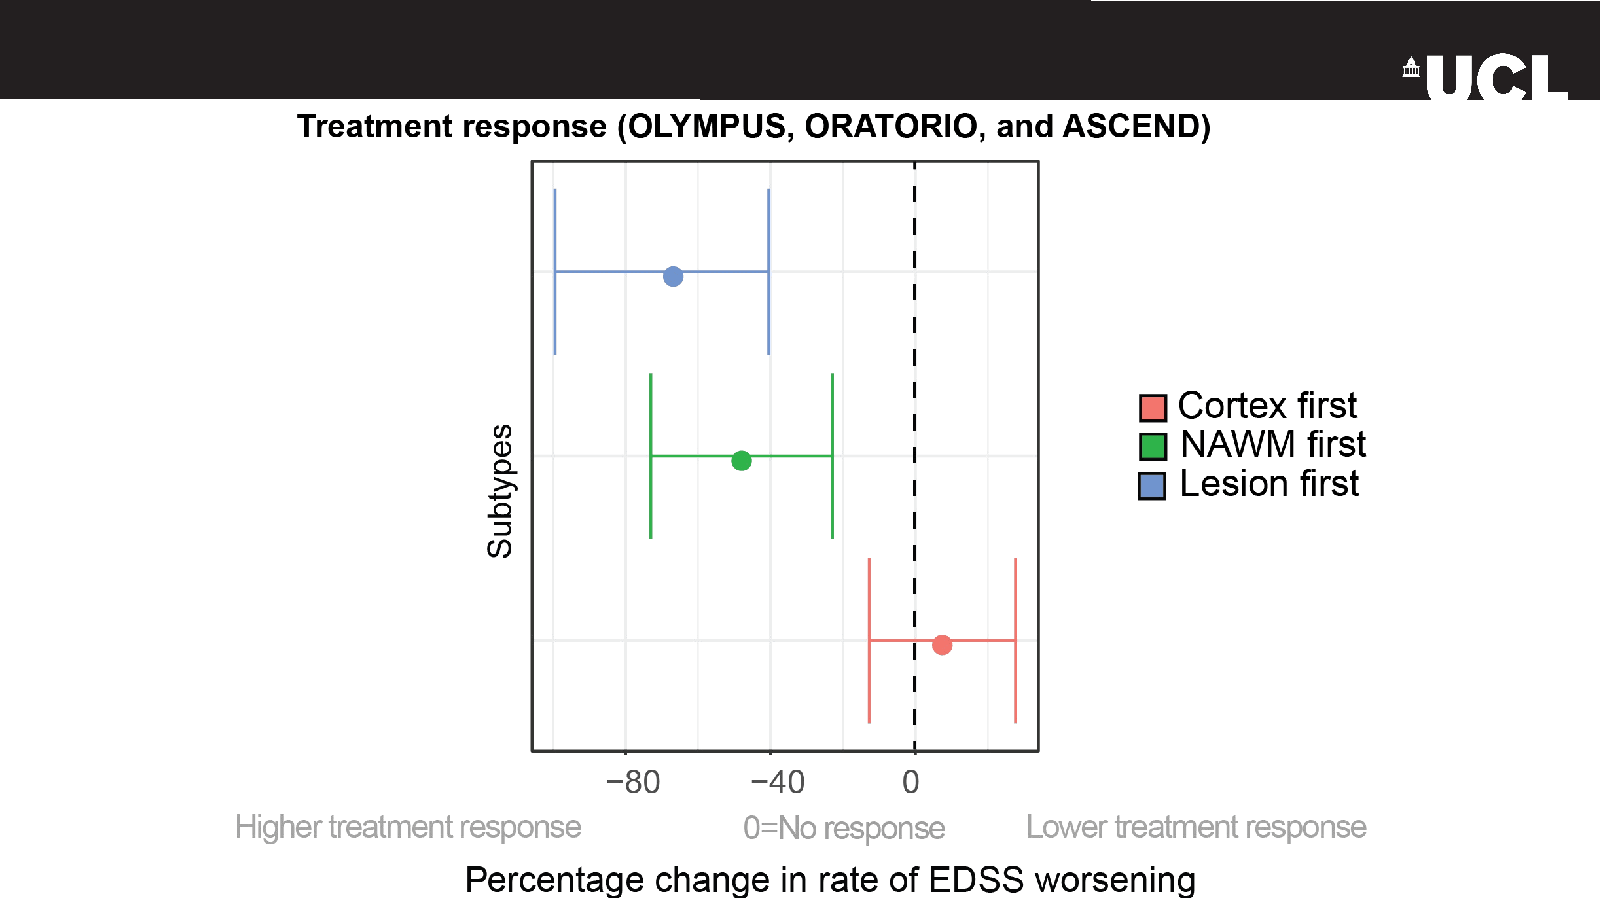
Slide 16
Slide 16
Slide 17
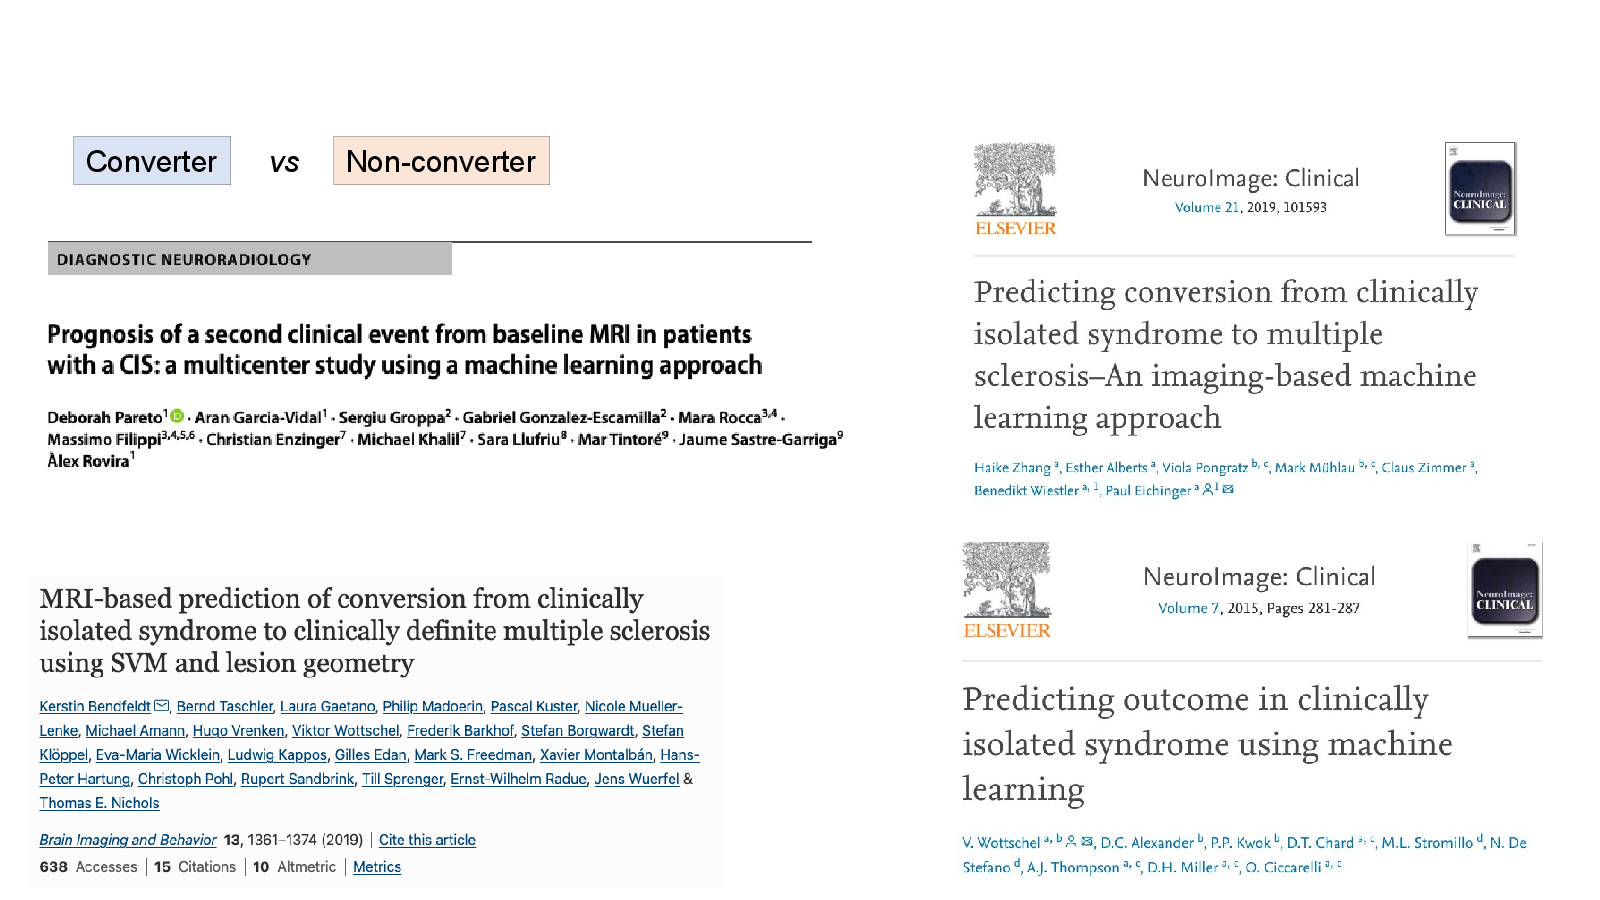
Phenotypic conversion
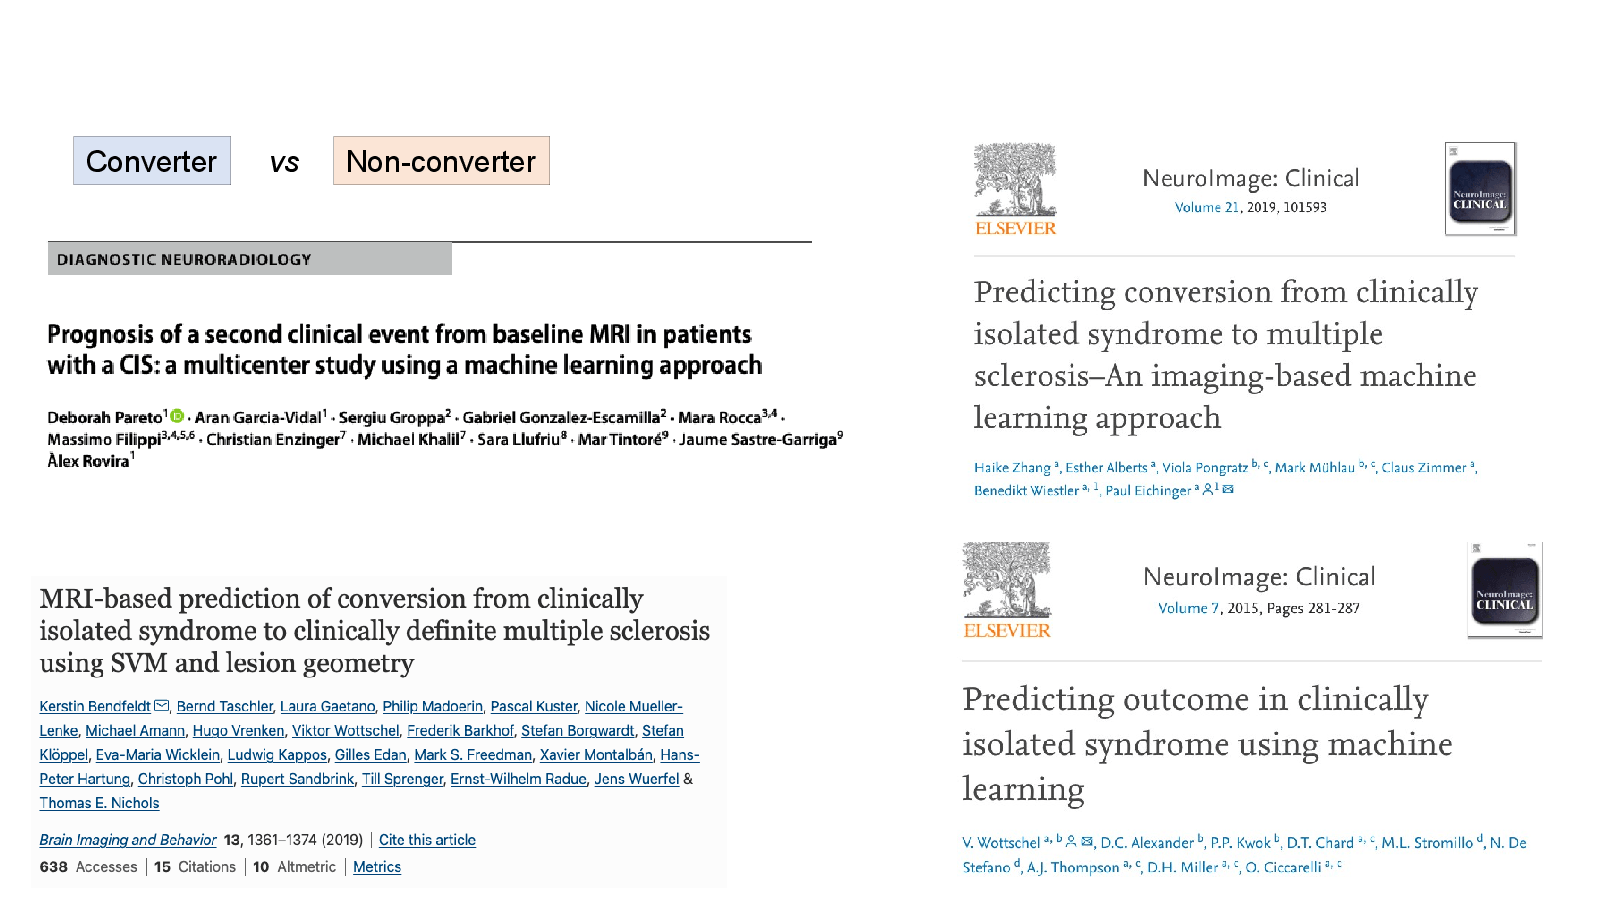
Slide 18
Slide 18
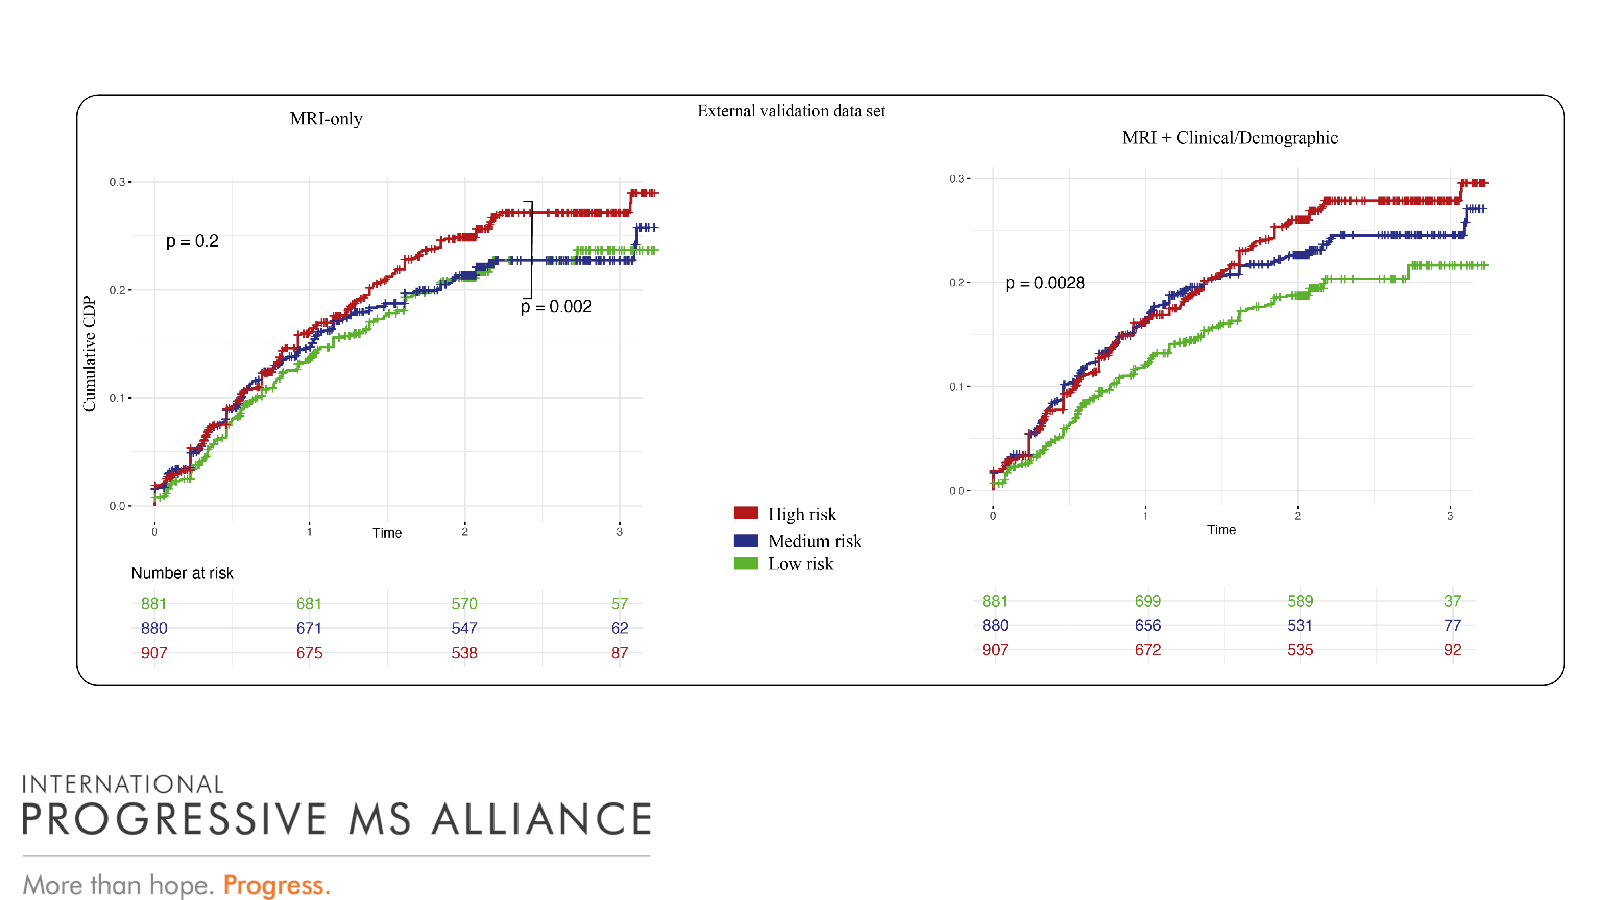
Slide 19
Slide 19
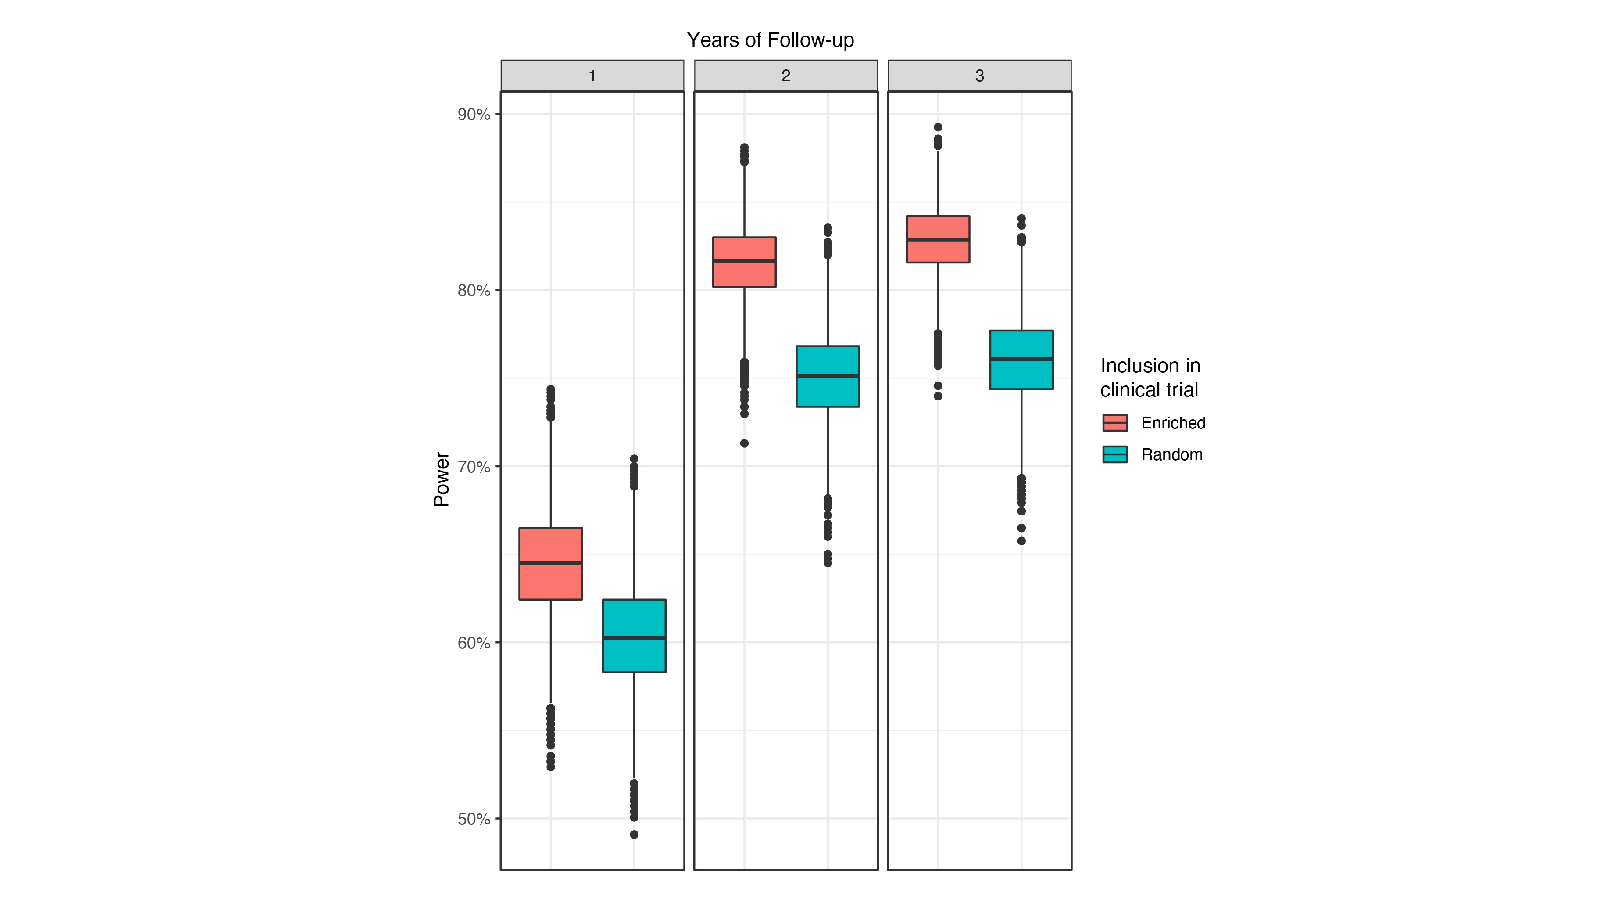
Slide 20
Future perspectives
Slide 21
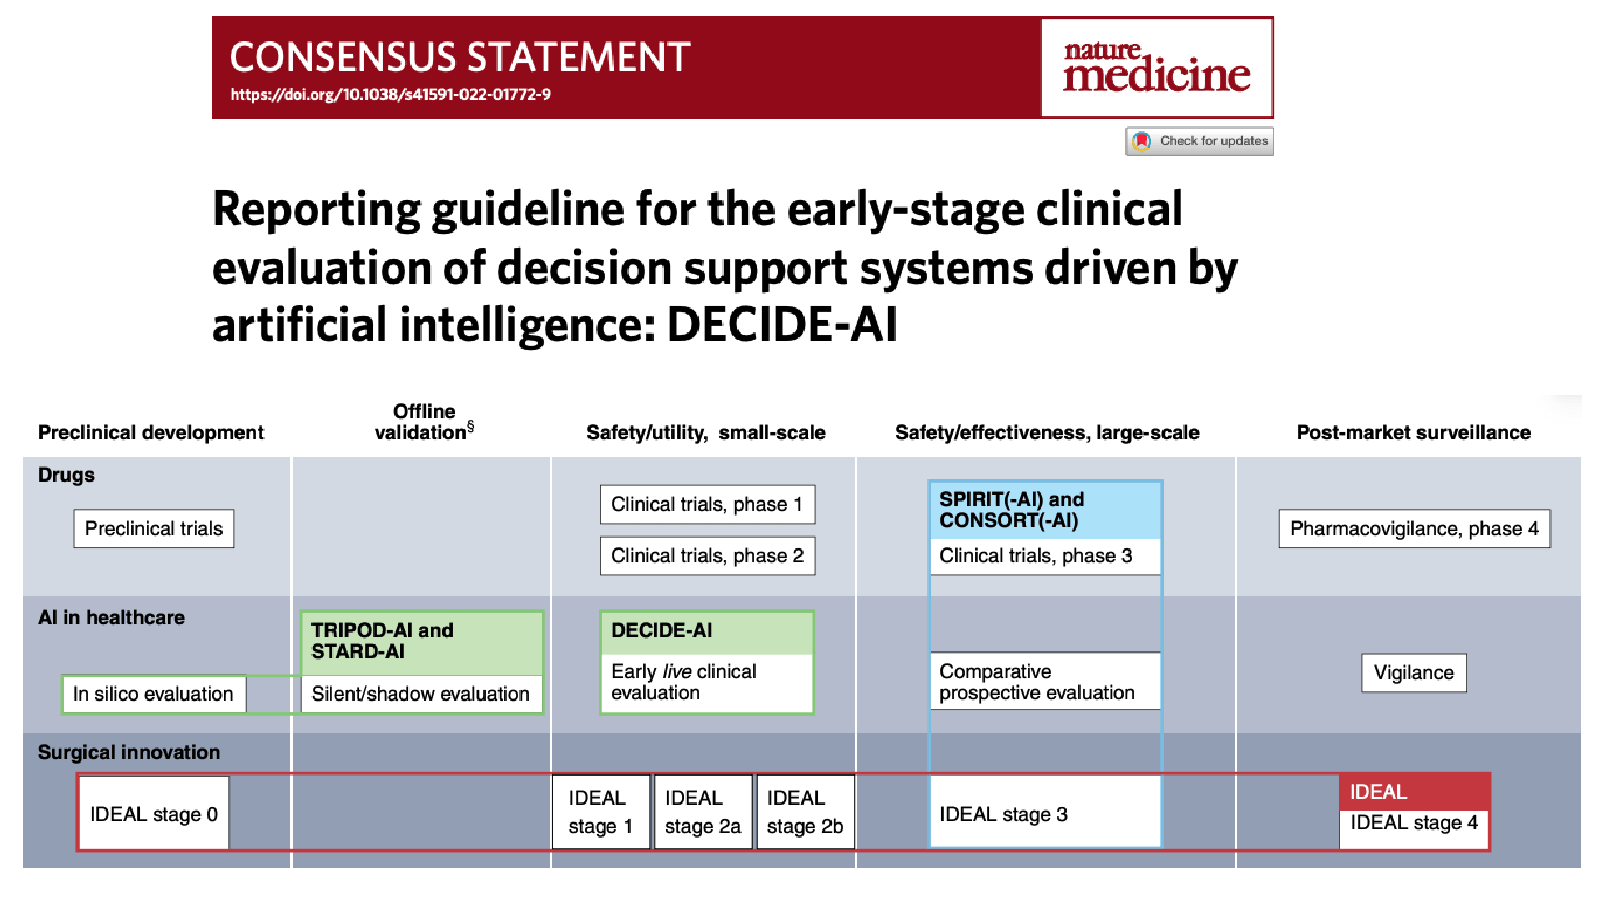
Slide 21
Slide 22
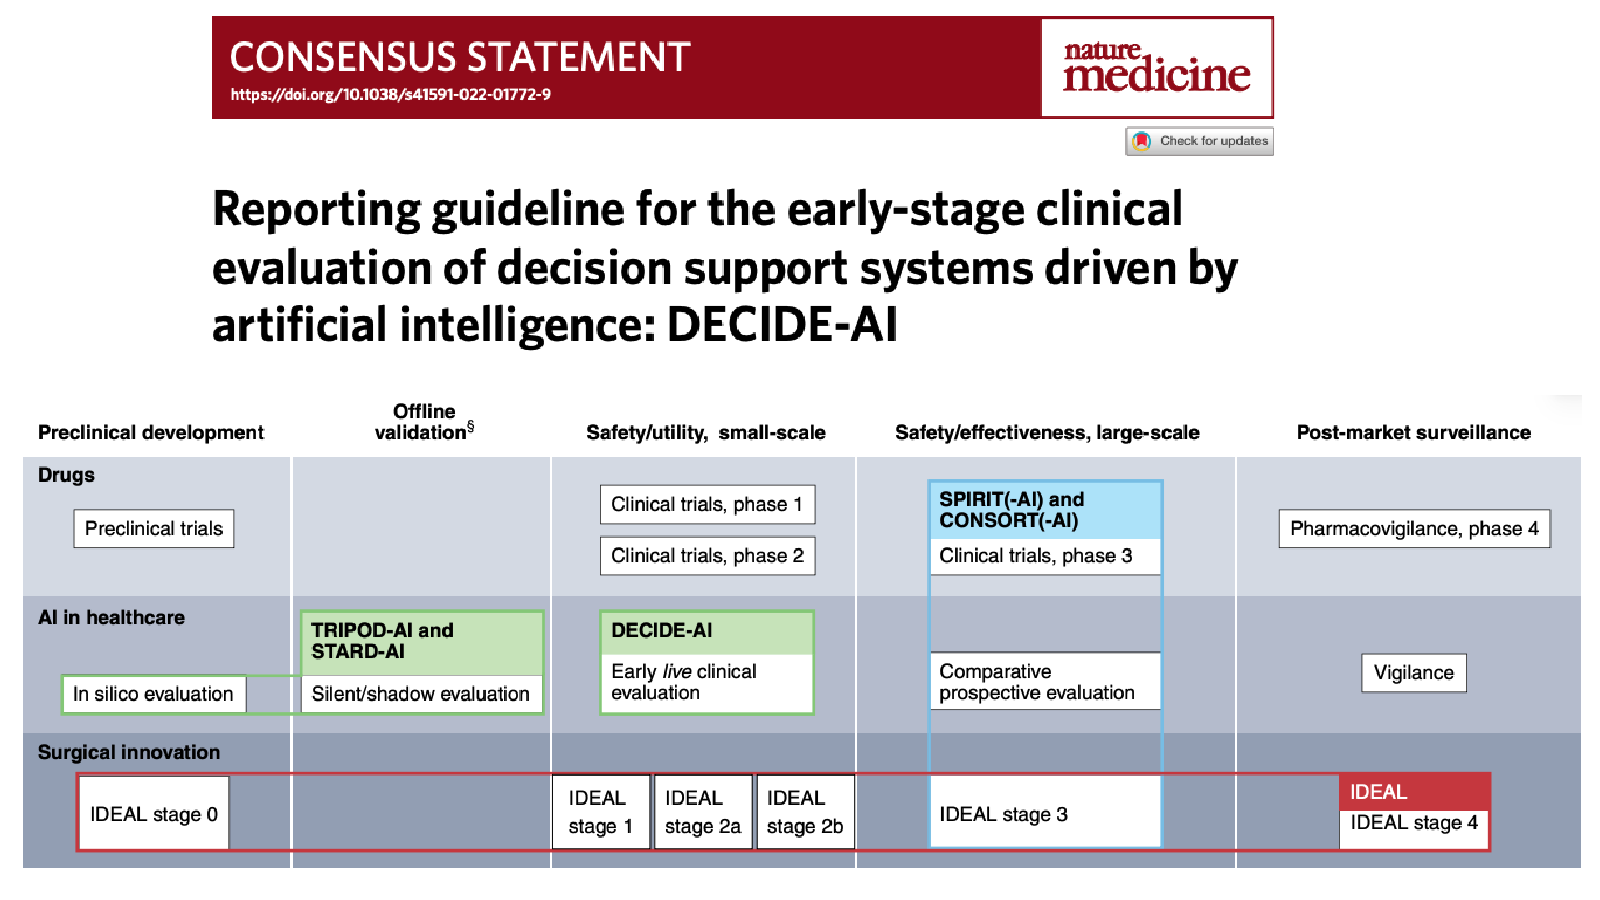
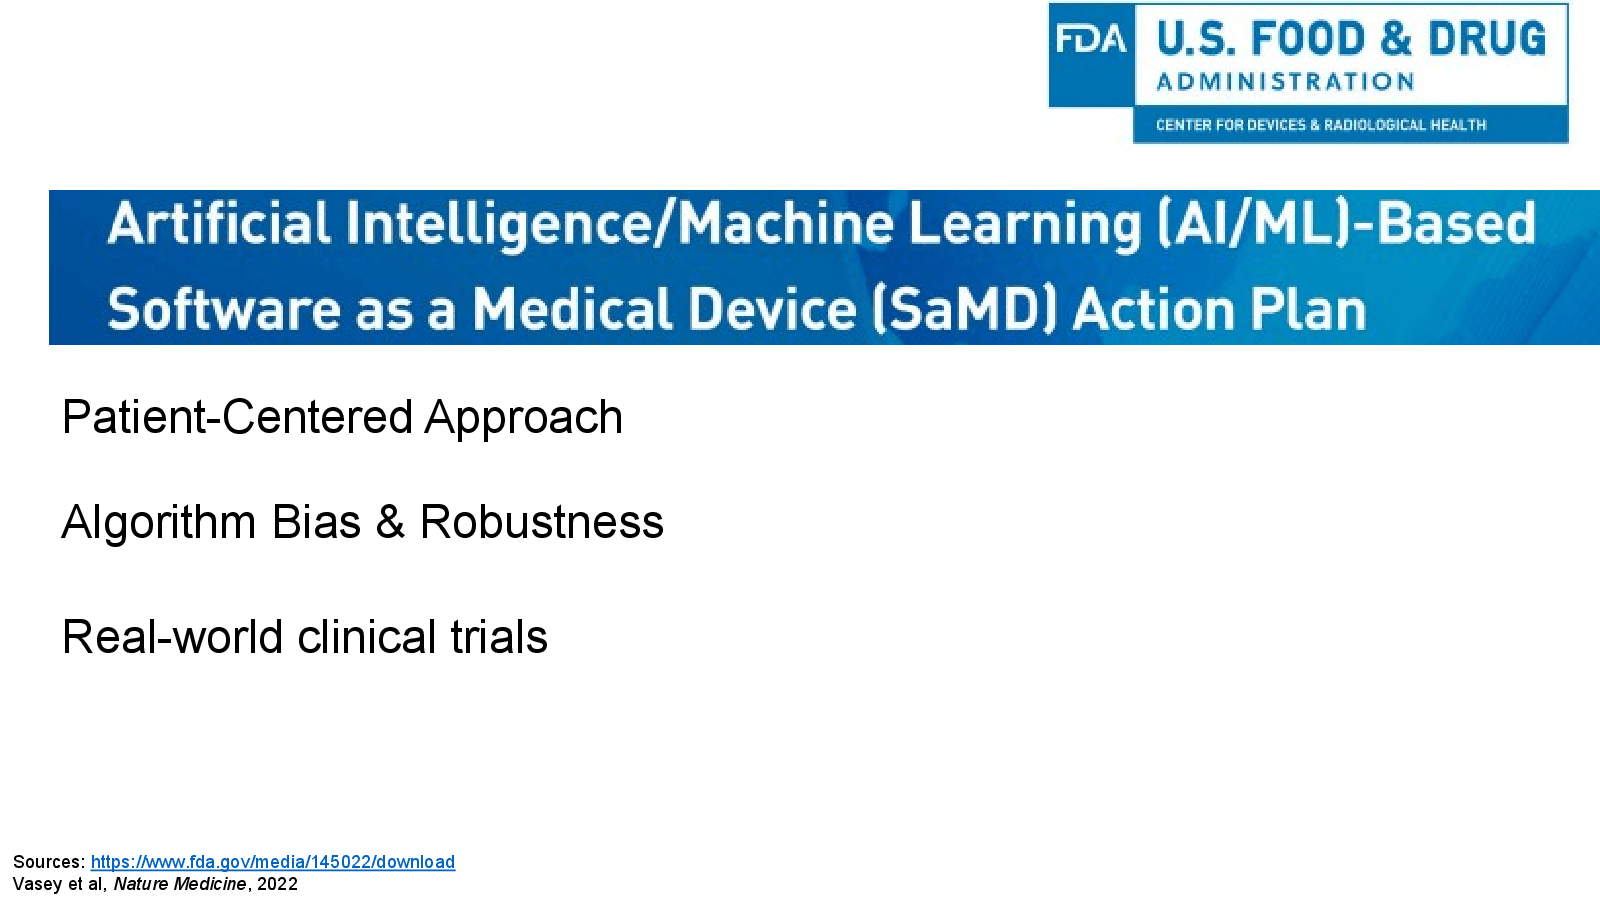
Vasey et al, Nature Medicine, 2022
Slide 23
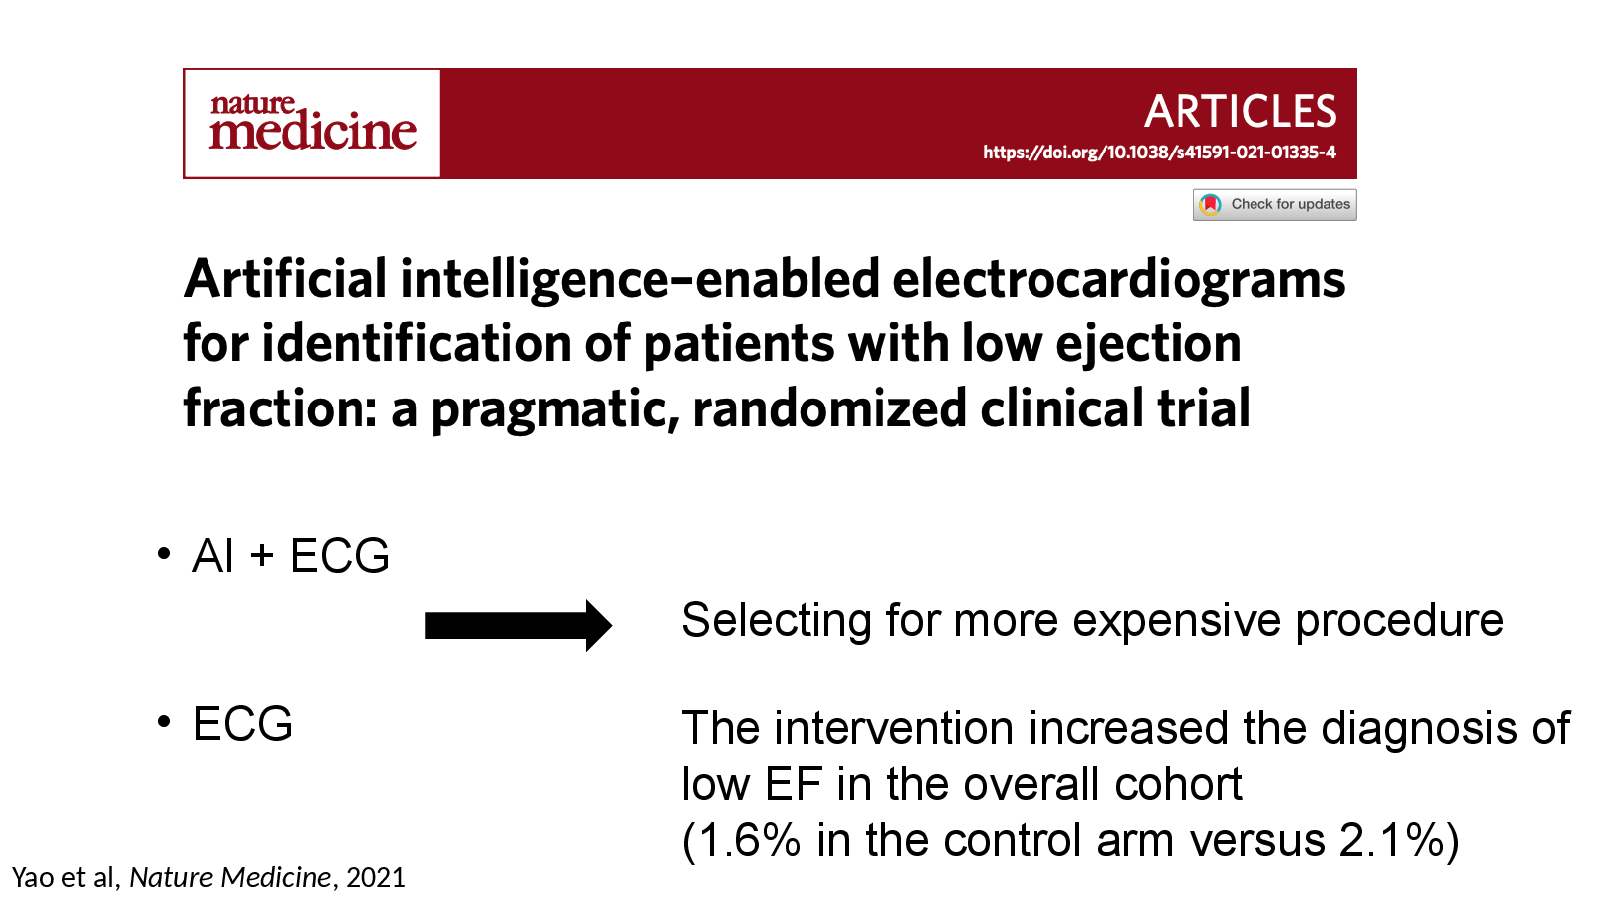
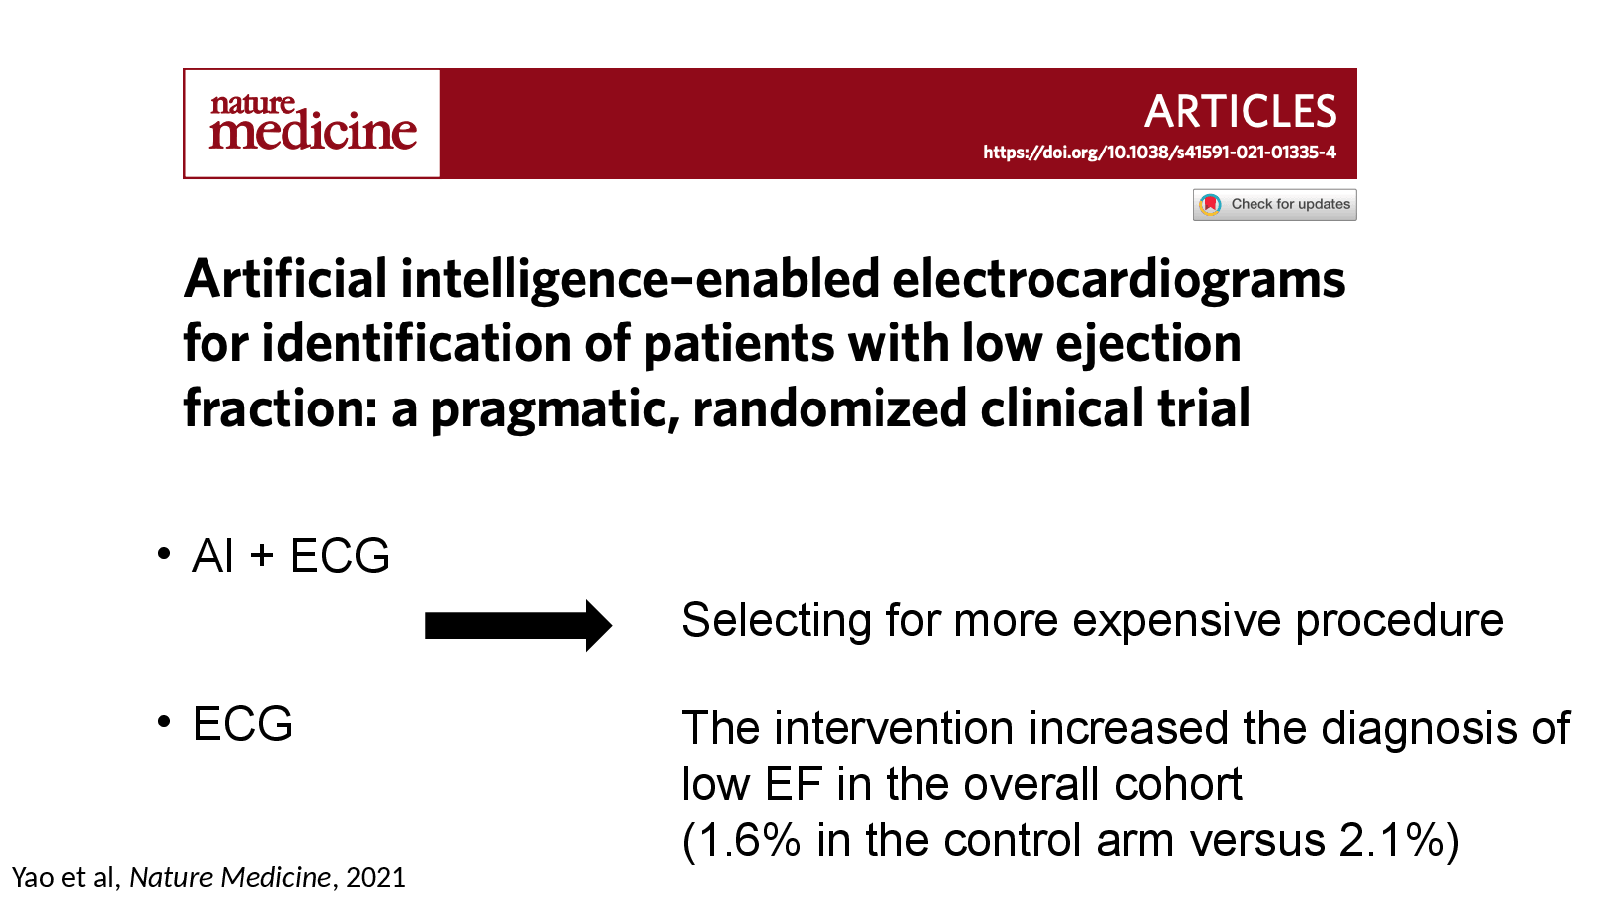
Yao et al, Nature Medicine, 2021
Slide 24
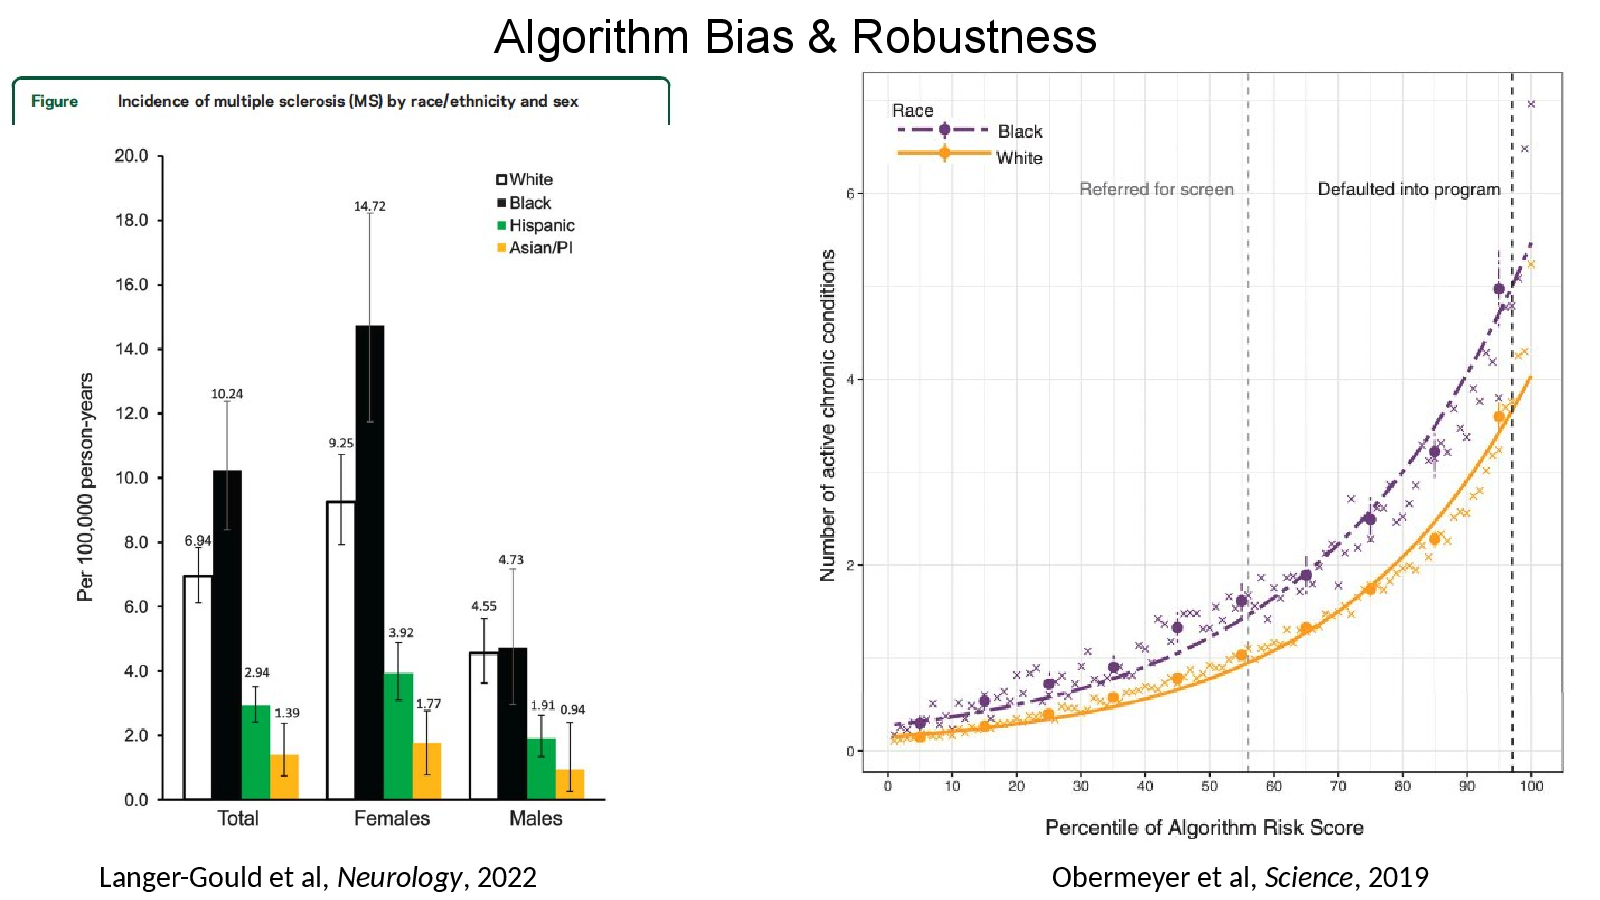
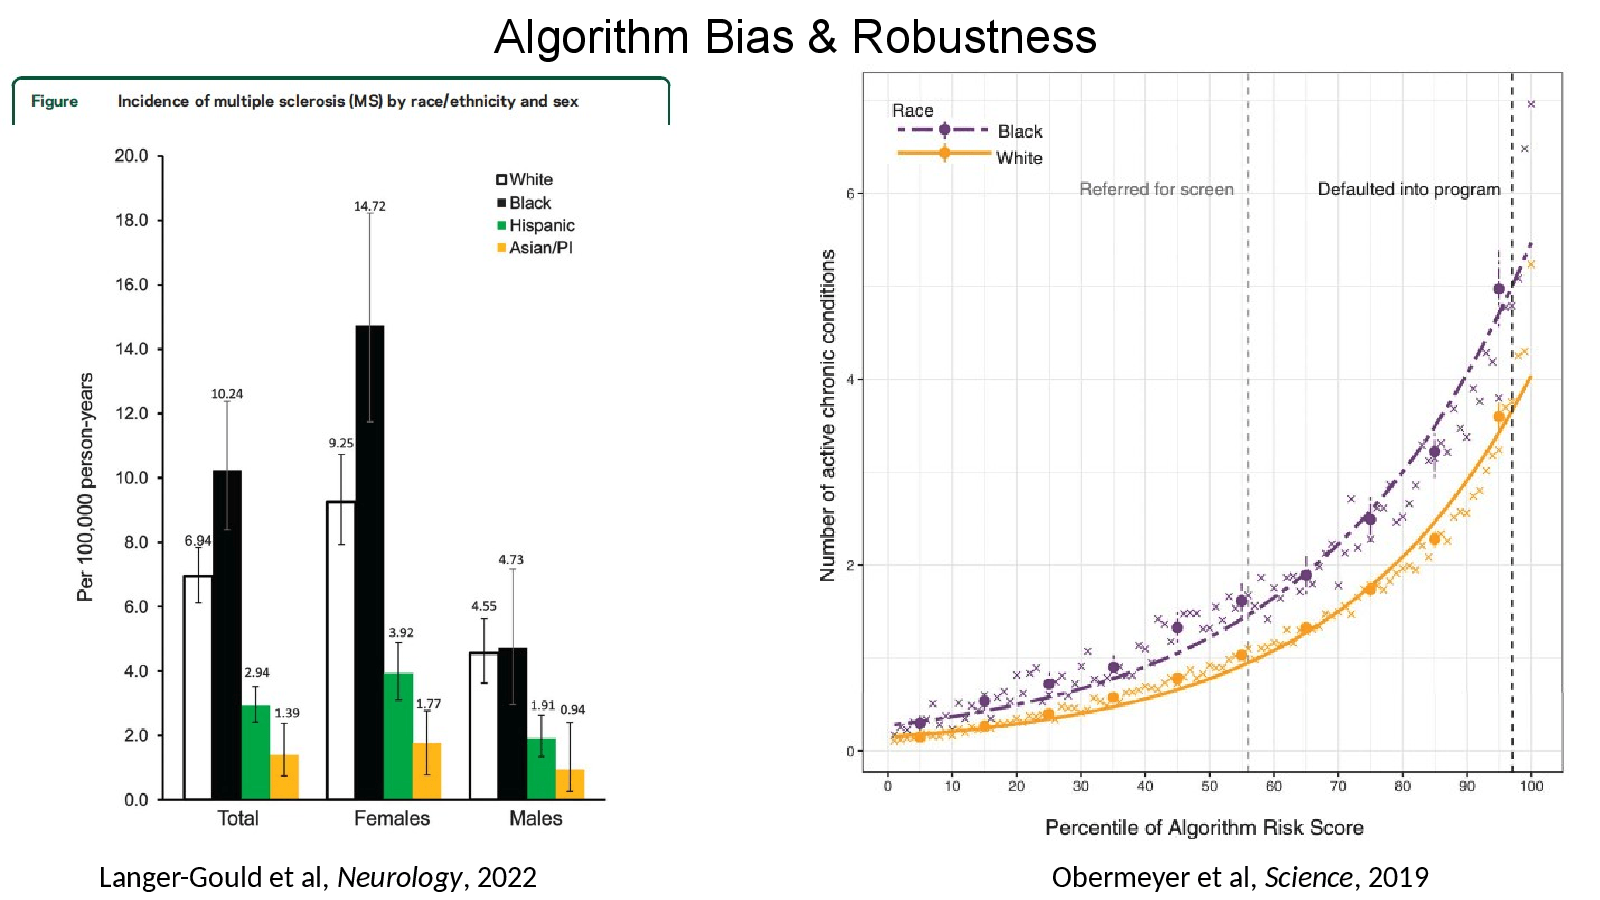
Langer-Gould et al, Neurology, 2022
Slide 25
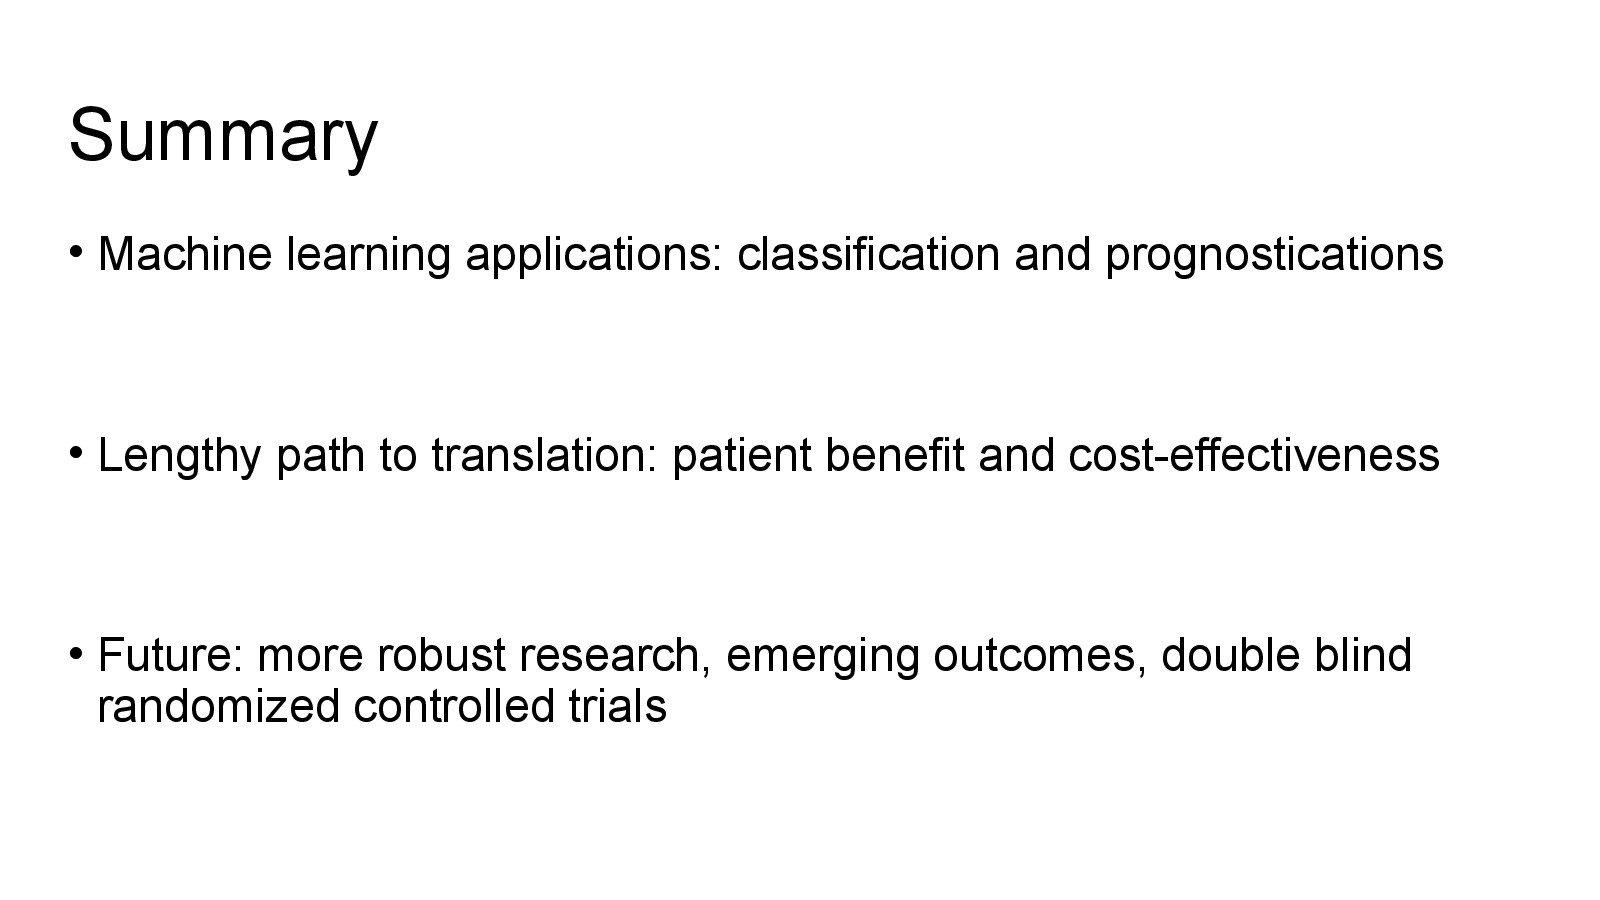
Summary
Slide 26
Organizing committee: