Workshop ·
Prognosis and monitoring
A practical survey of prognostic modelling in multiple sclerosis and the steps needed to move prediction into clinical use.
EAN 2022 — AI & MS Workshop
- Delivered
- Event
- EAN 2022 — AI & MS Workshop
- Format
- Workshop
- Published deck
- 31 slides
From the slides
Deck notes
This workshop reviewed how clinical, imaging and biomarker data have been used to predict disease activity and disability in multiple sclerosis. It also examined reporting quality, bias and the path to clinical translation.
The question
What must a prognostic model do before it can support monitoring and decisions for an individual patient?
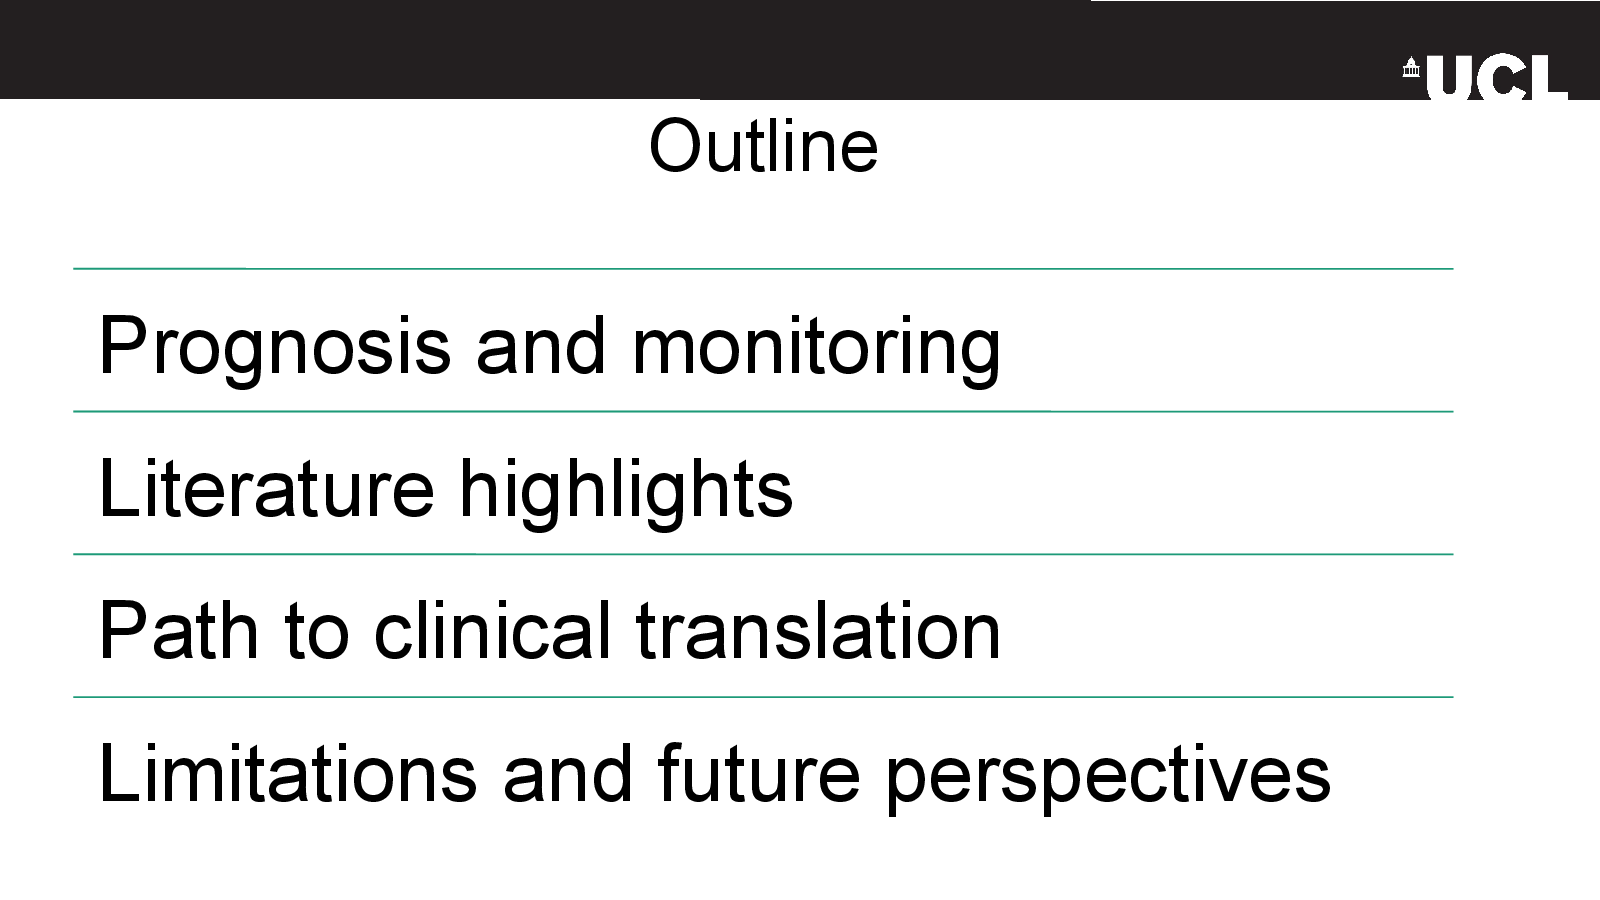
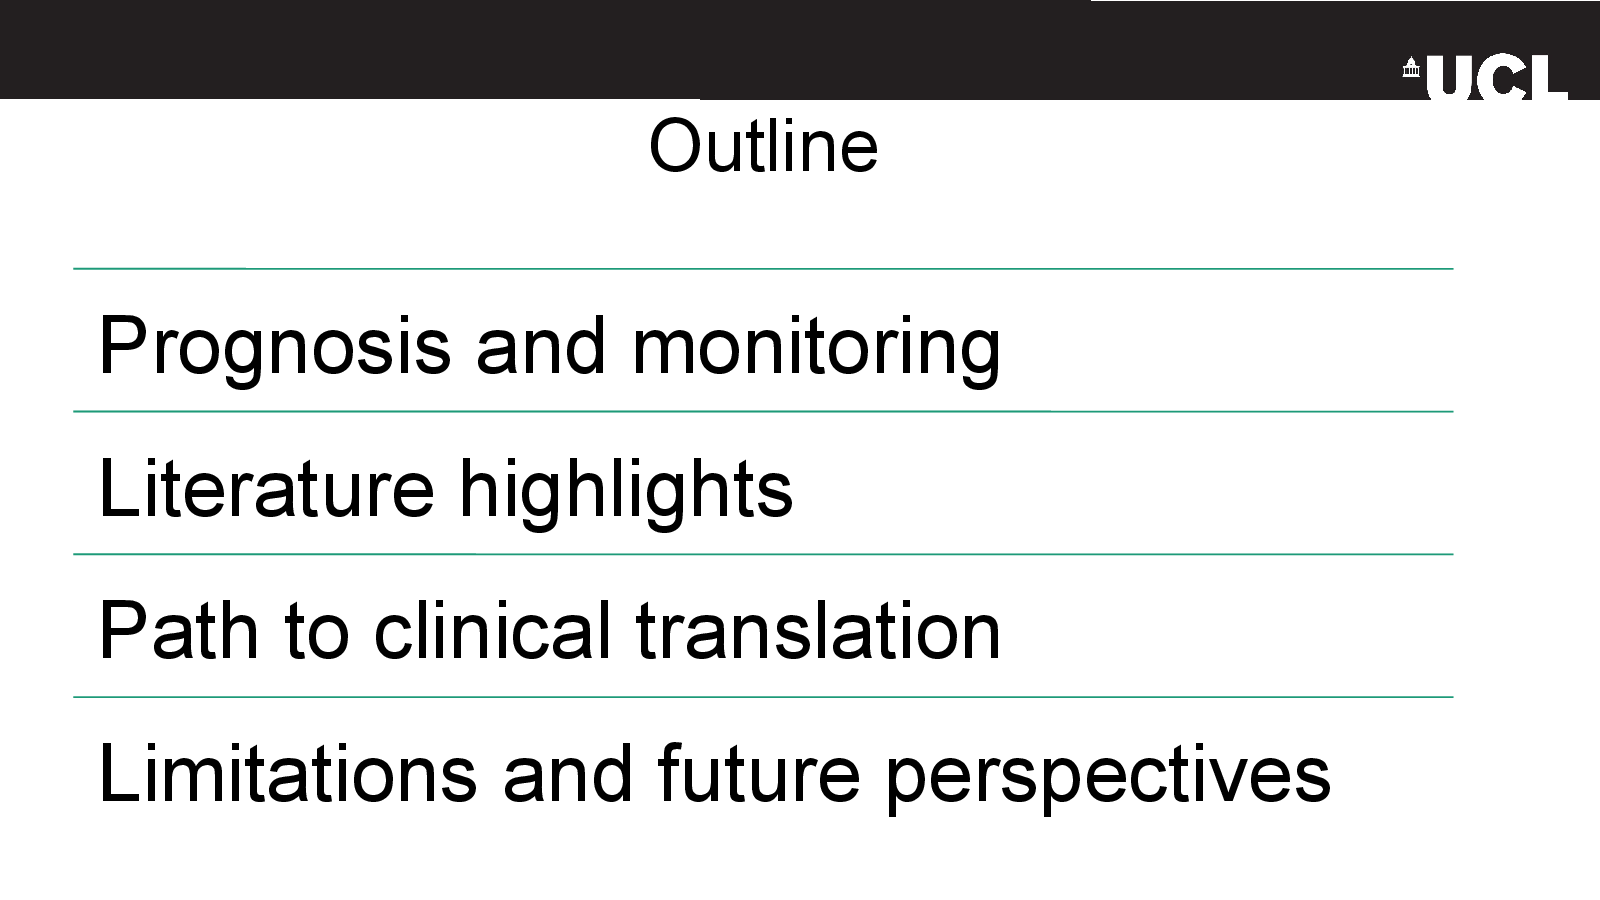
Deck outline
- Prognostic models for disease activity and progression
- Predicting phenotypic conversion and long-term disability
- Imaging and fluid biomarkers
- Reporting standards and risk of bias
- Biomarker qualification and regulatory pathways
- Robustness, recovery endpoints and future directions
Take-away
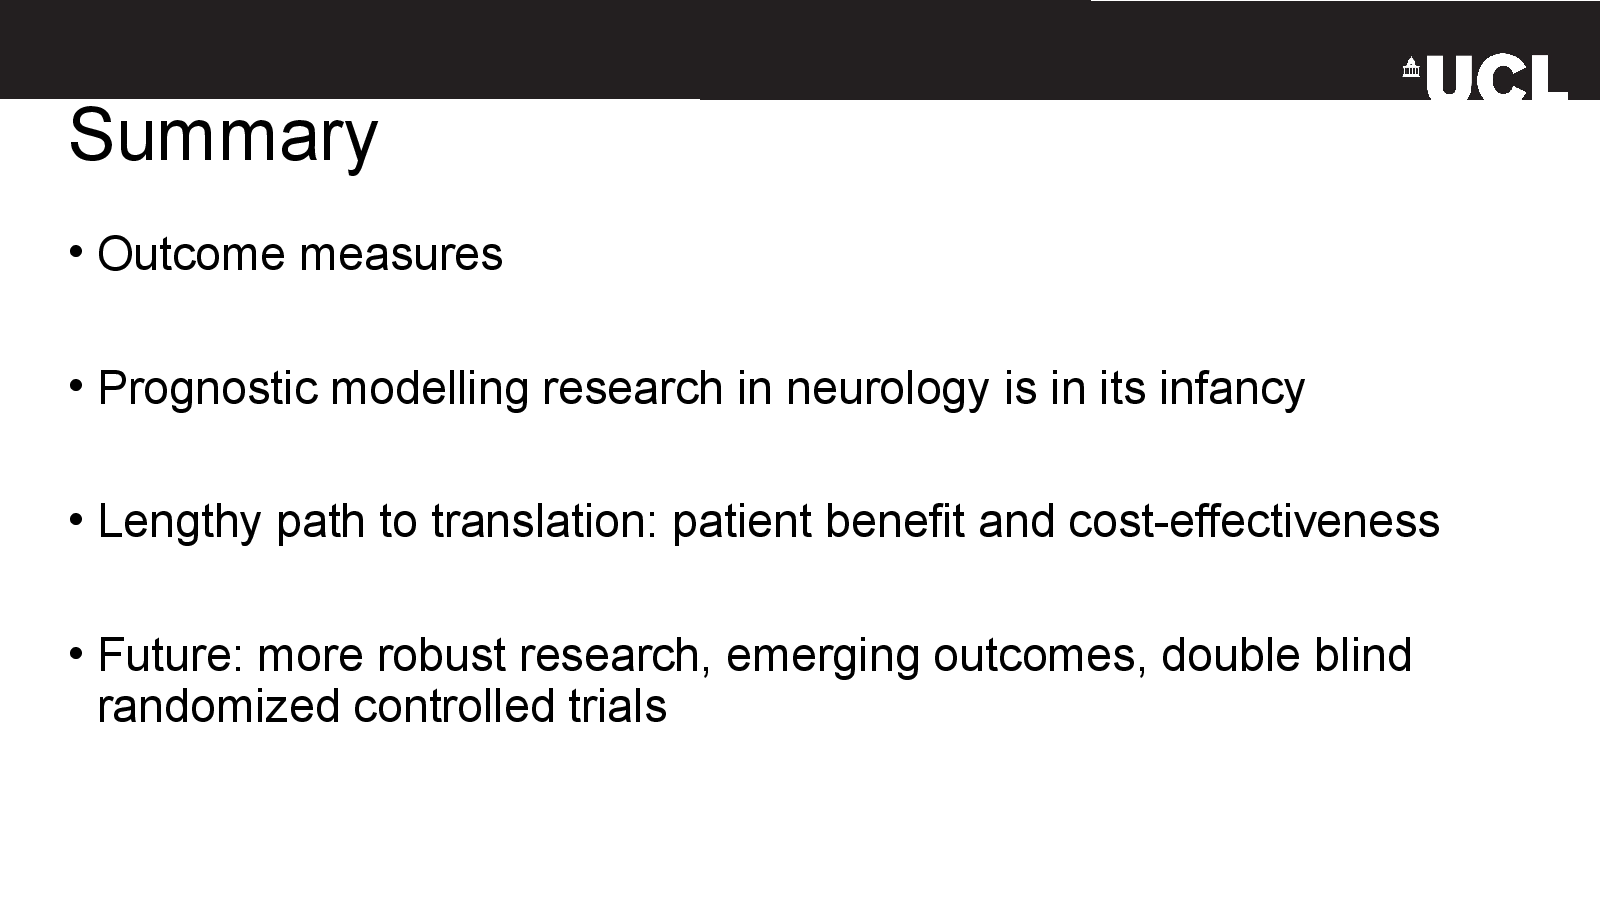
Prediction alone is not enough: useful models need clear outcomes, transparent reporting and evidence that they remain reliable in the setting where they will be used.
Original deck
Slide by slide
Read the 31-slide presentation in order, or use the index to jump.
Slide 01
AI & MS Workshop
Slide 02
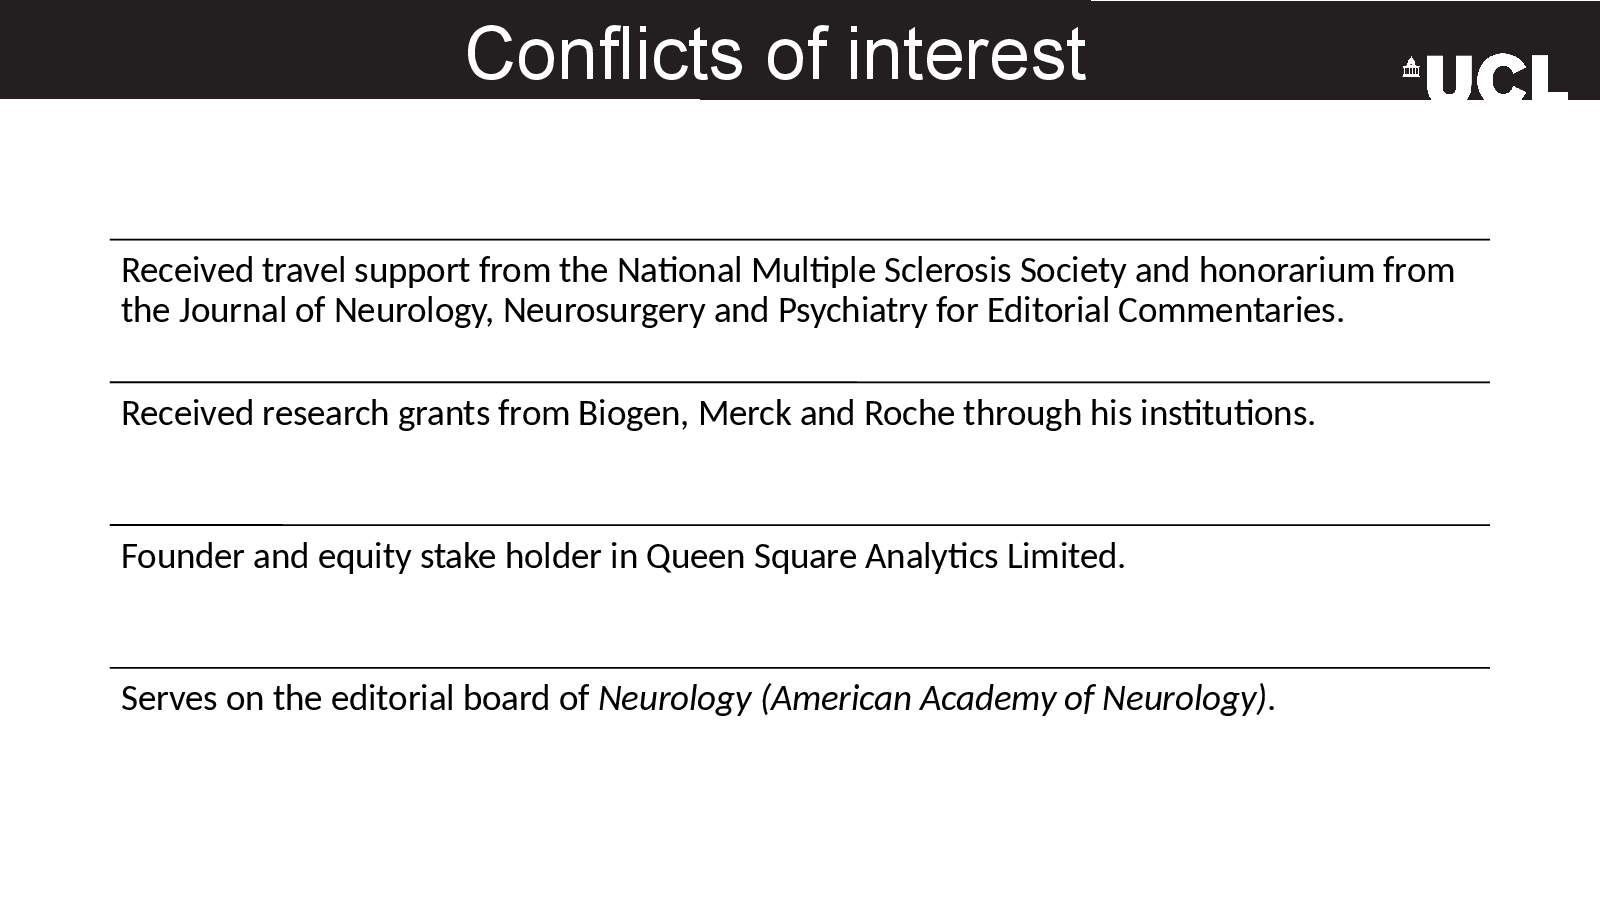
Conflicts of interest
Slide 03
Outline
Slide 04
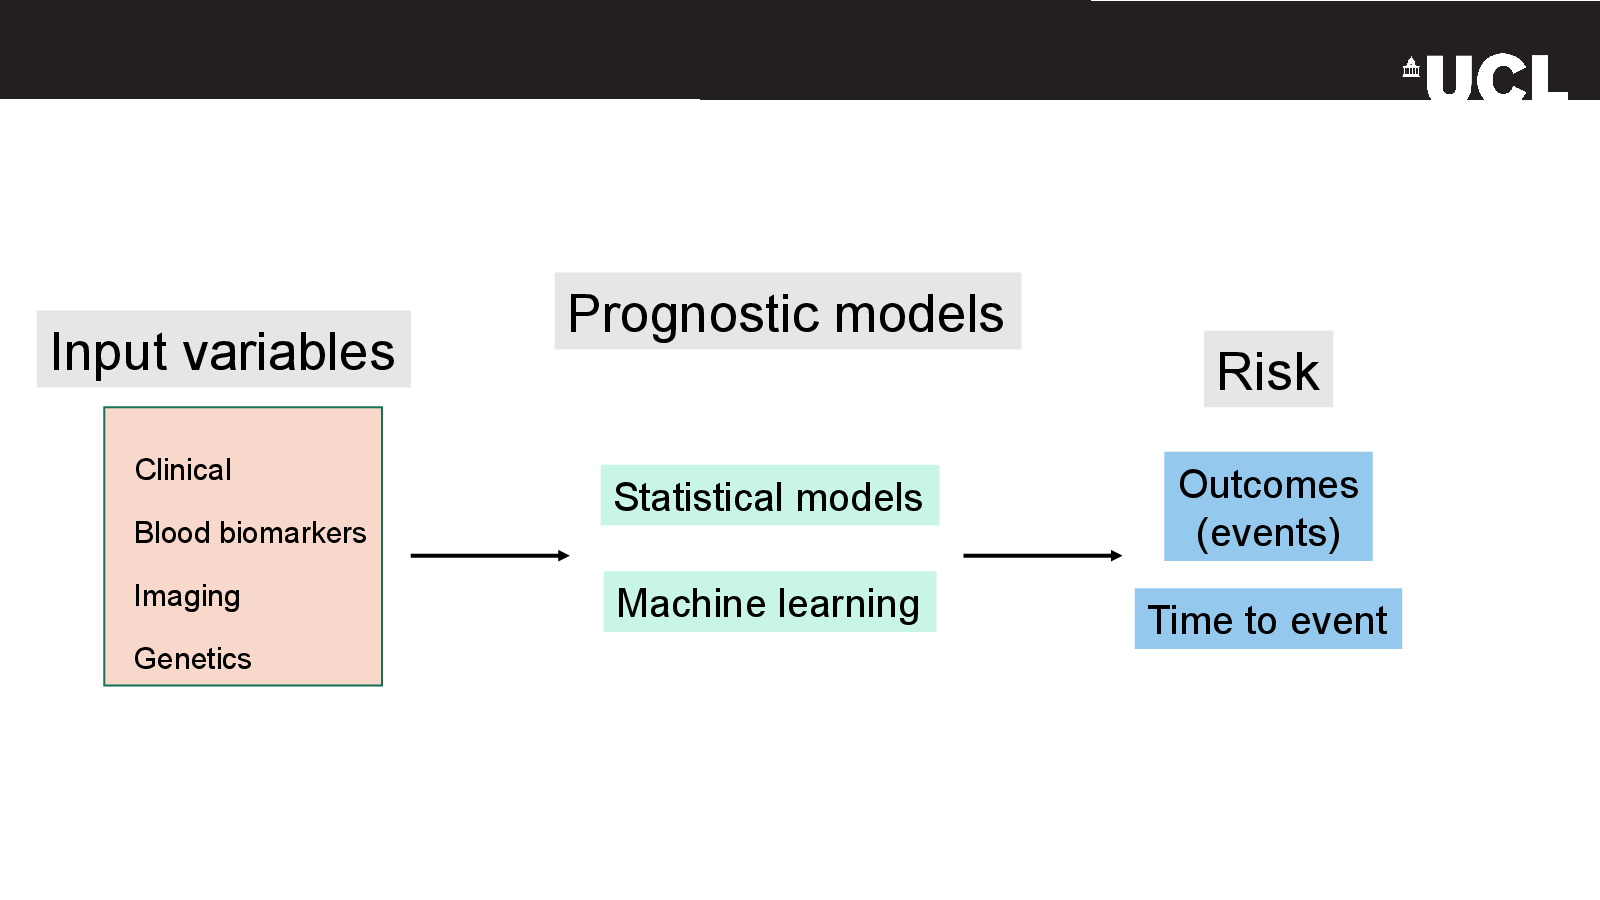
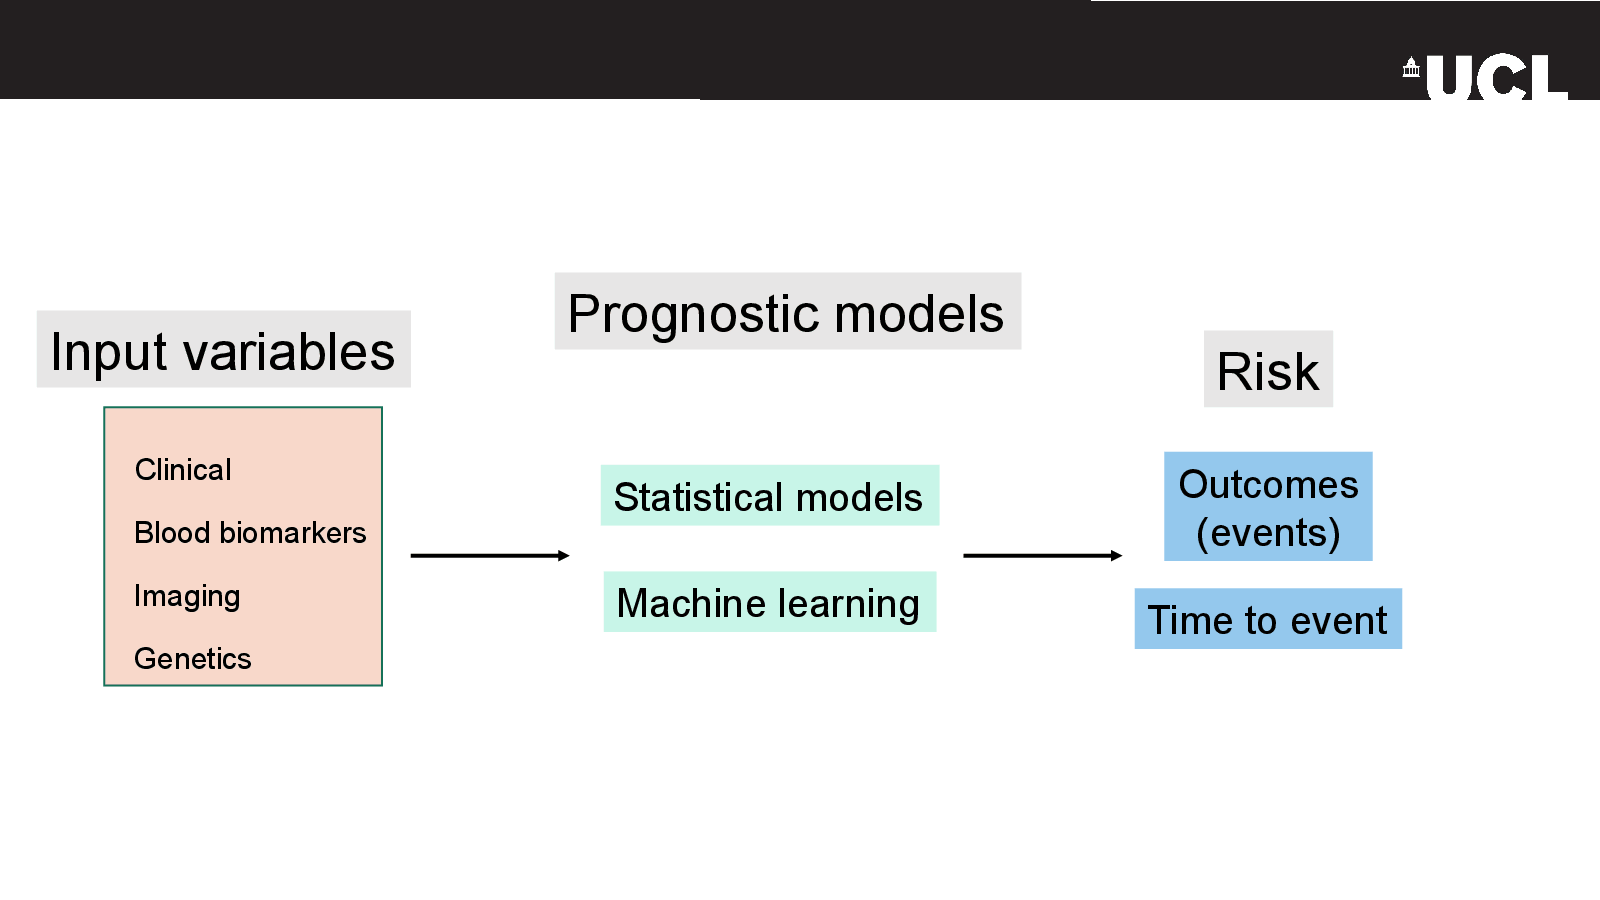
Time to event
Slide 05
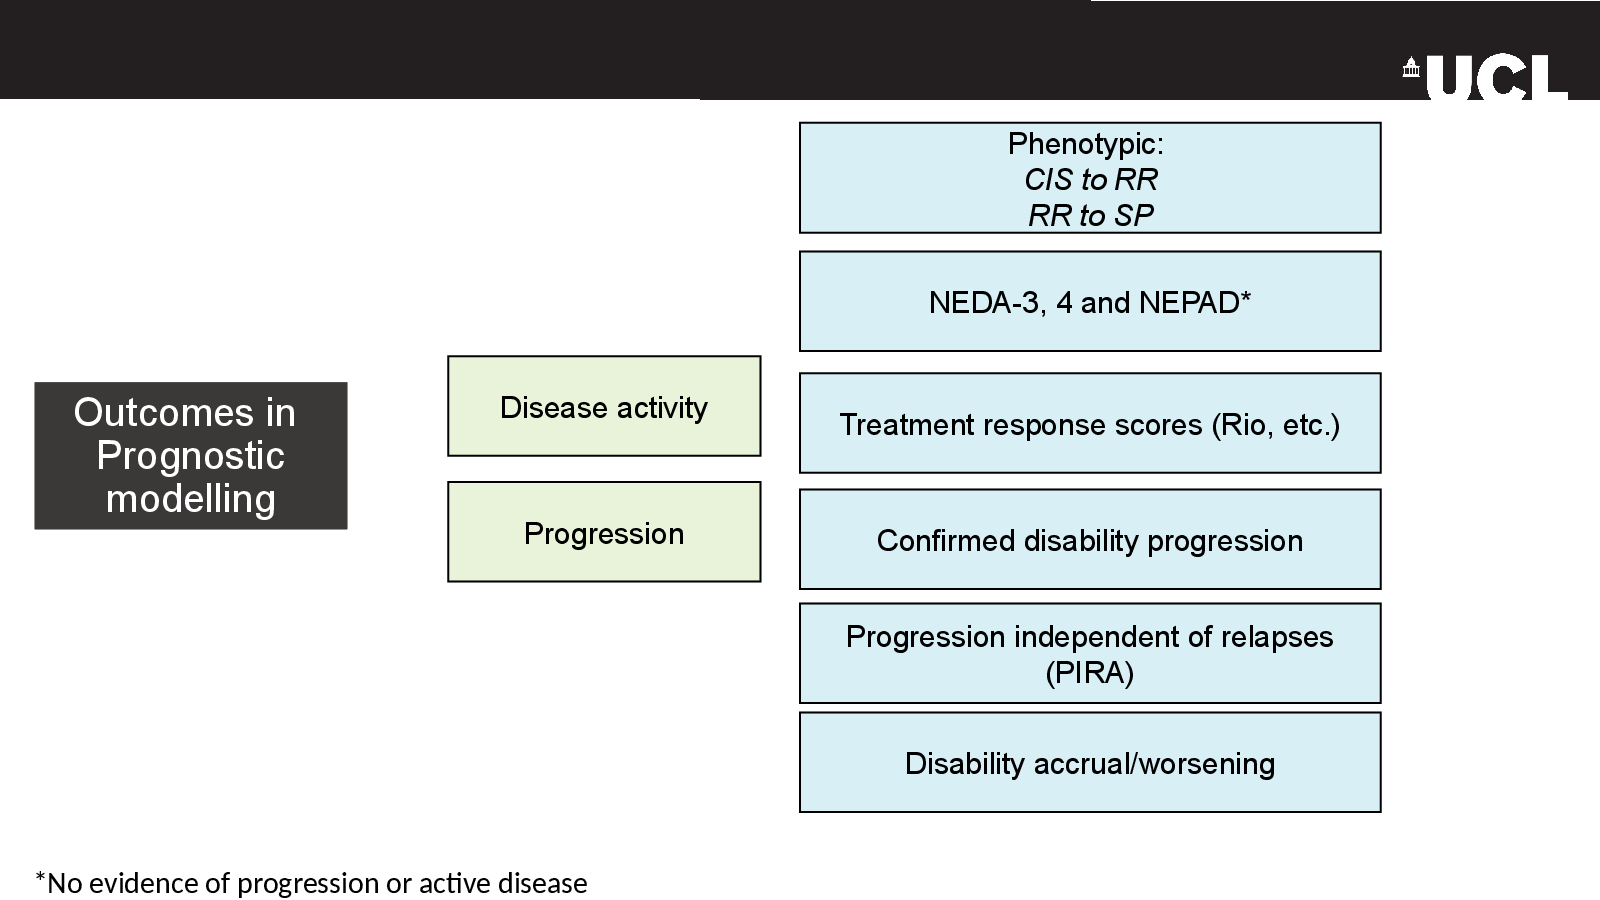
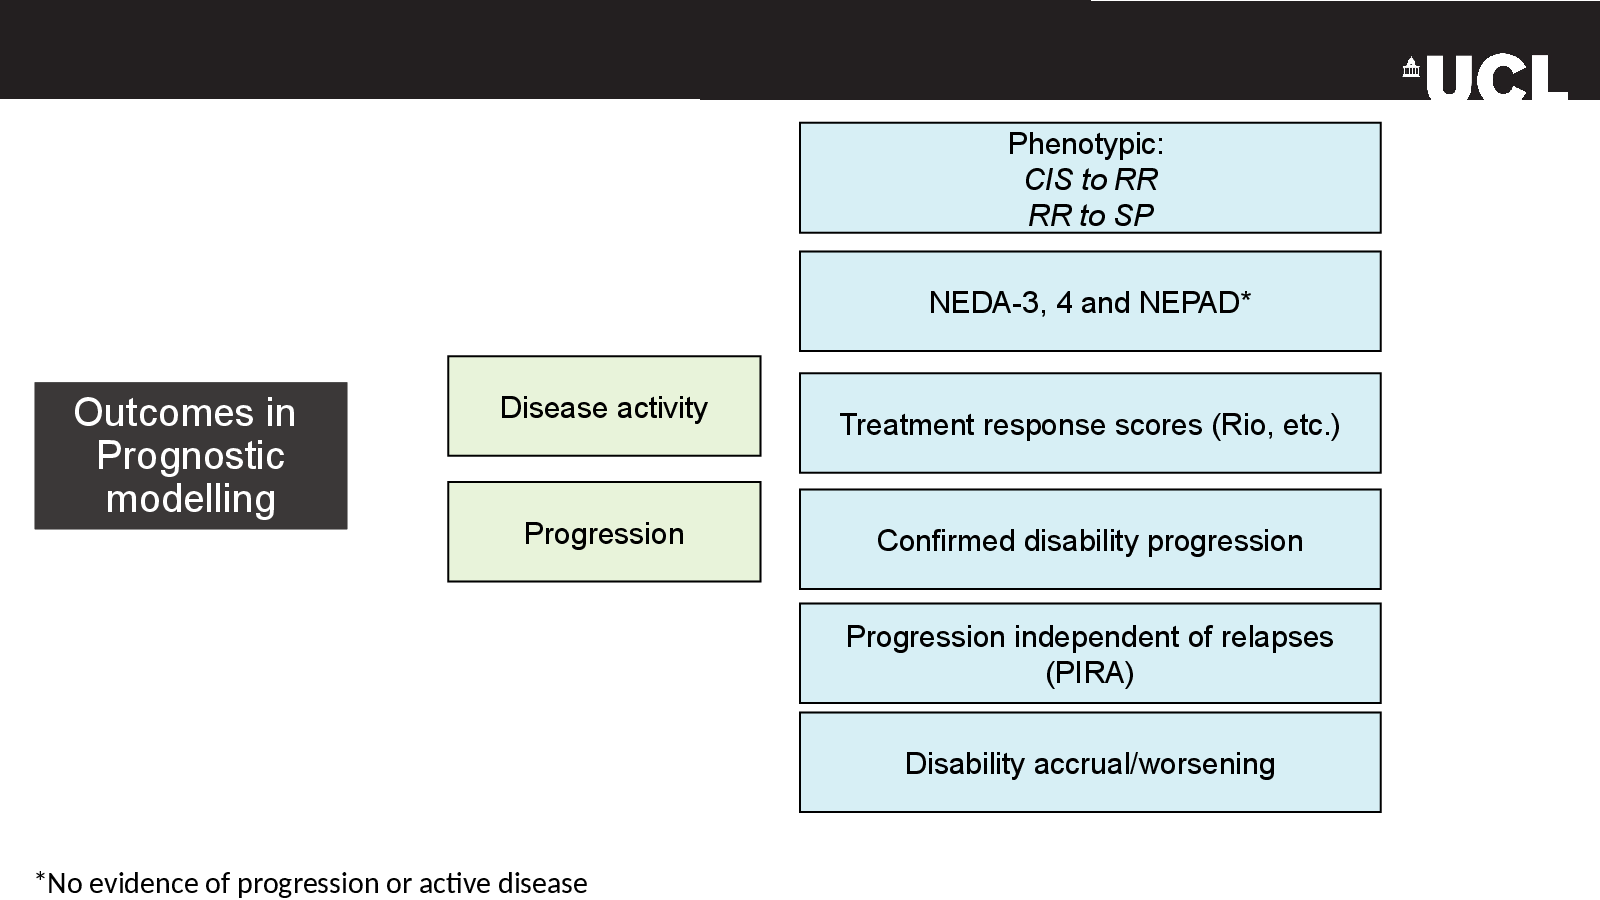
Outcomes in
Slide 06
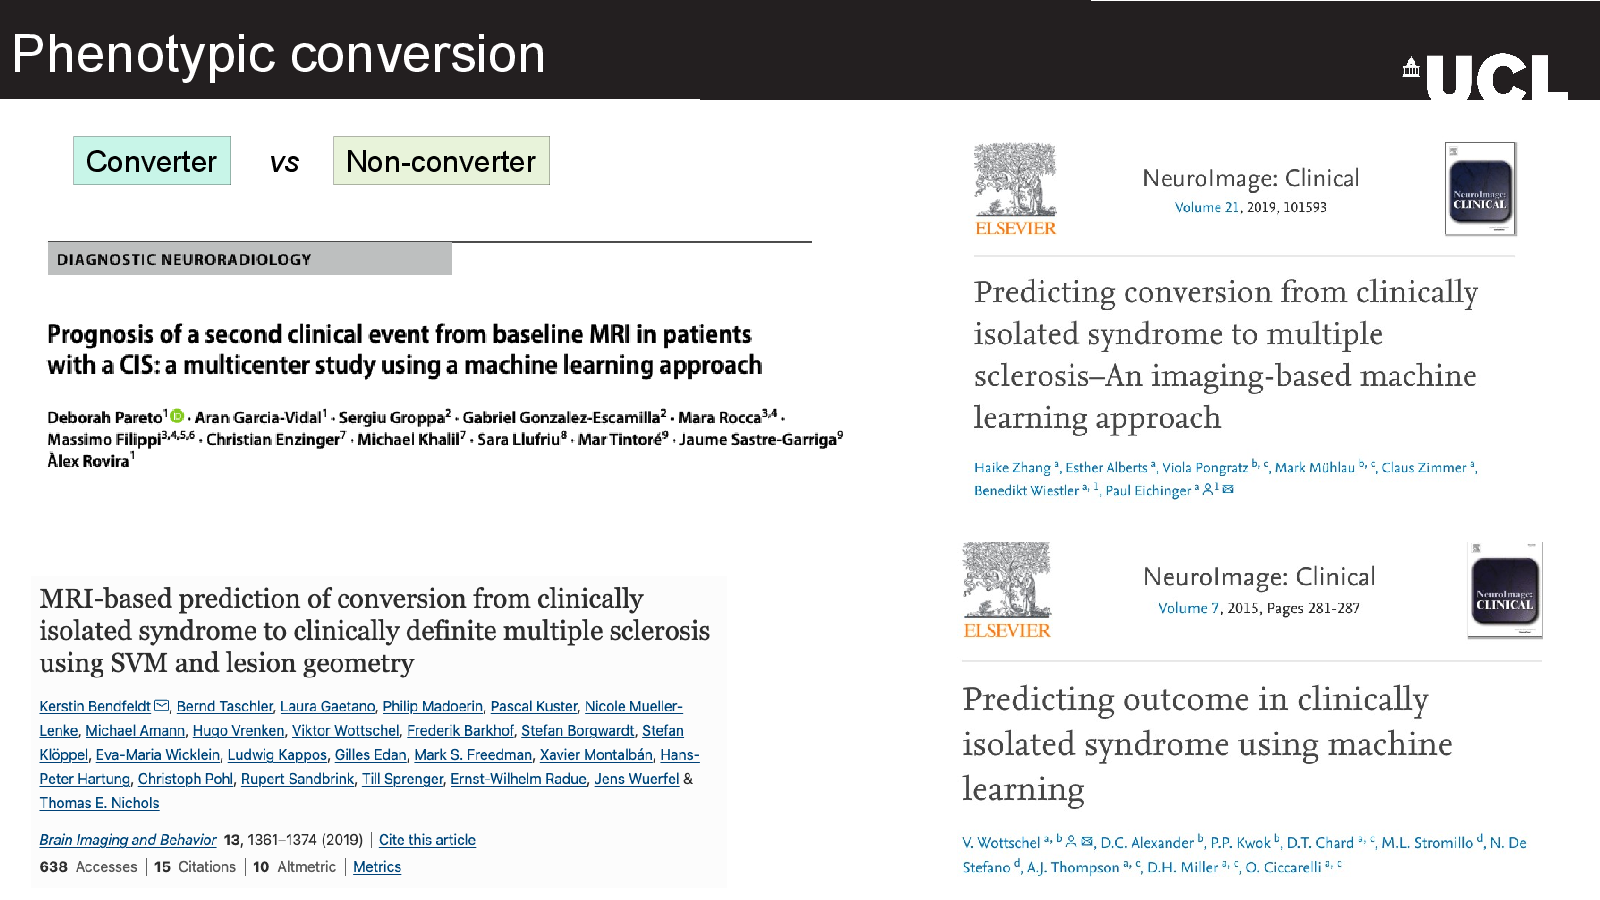
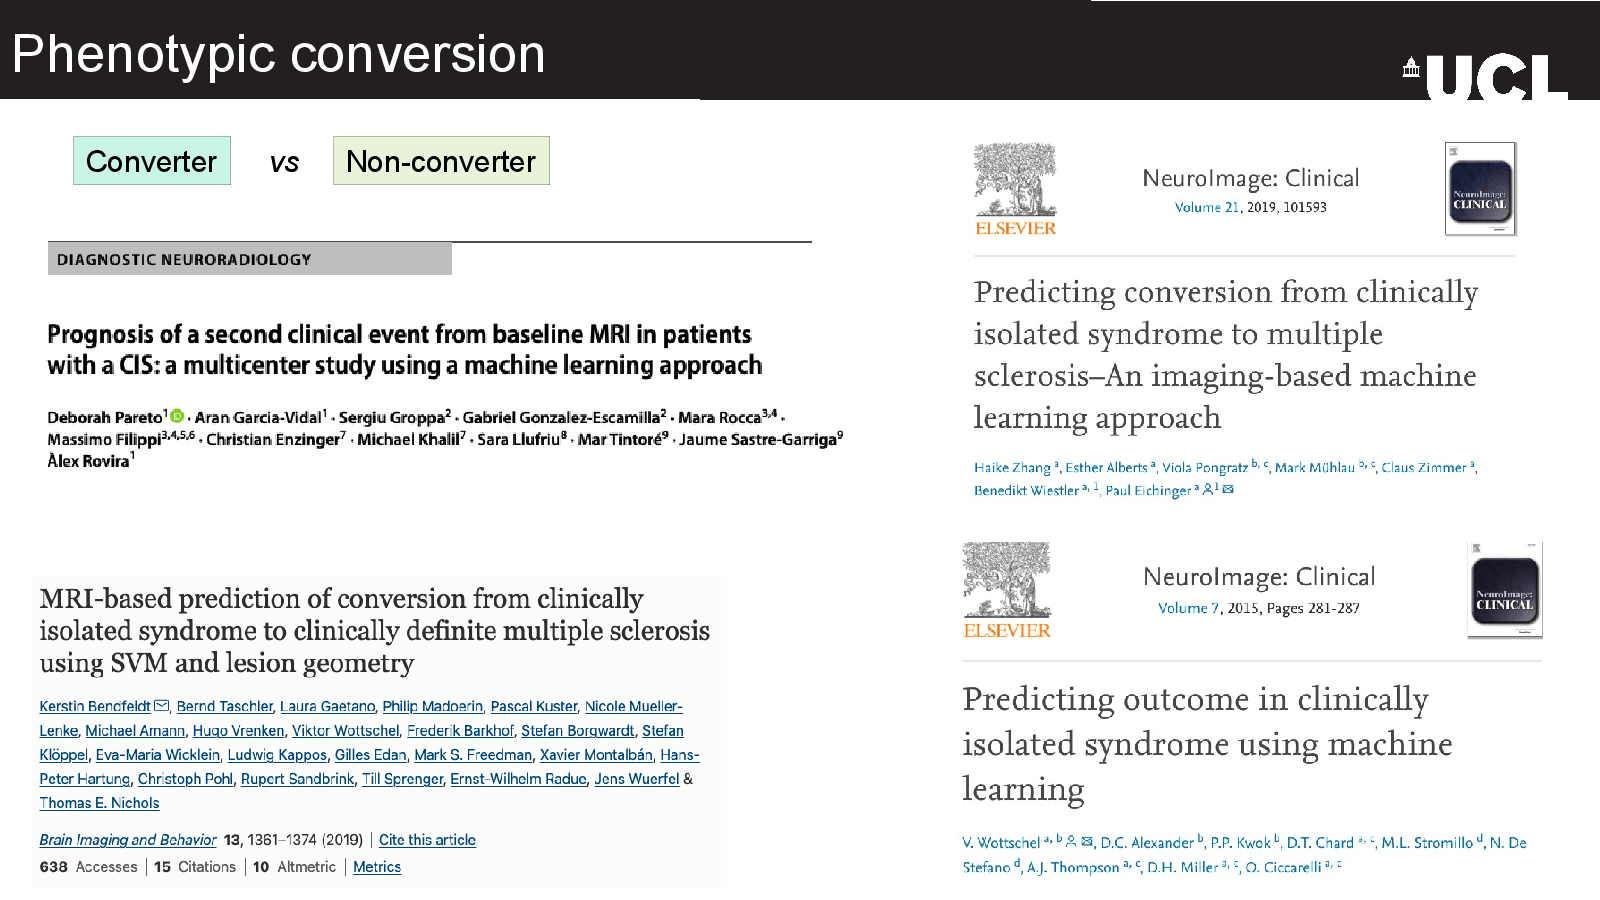
Phenotypic conversion
Slide 07
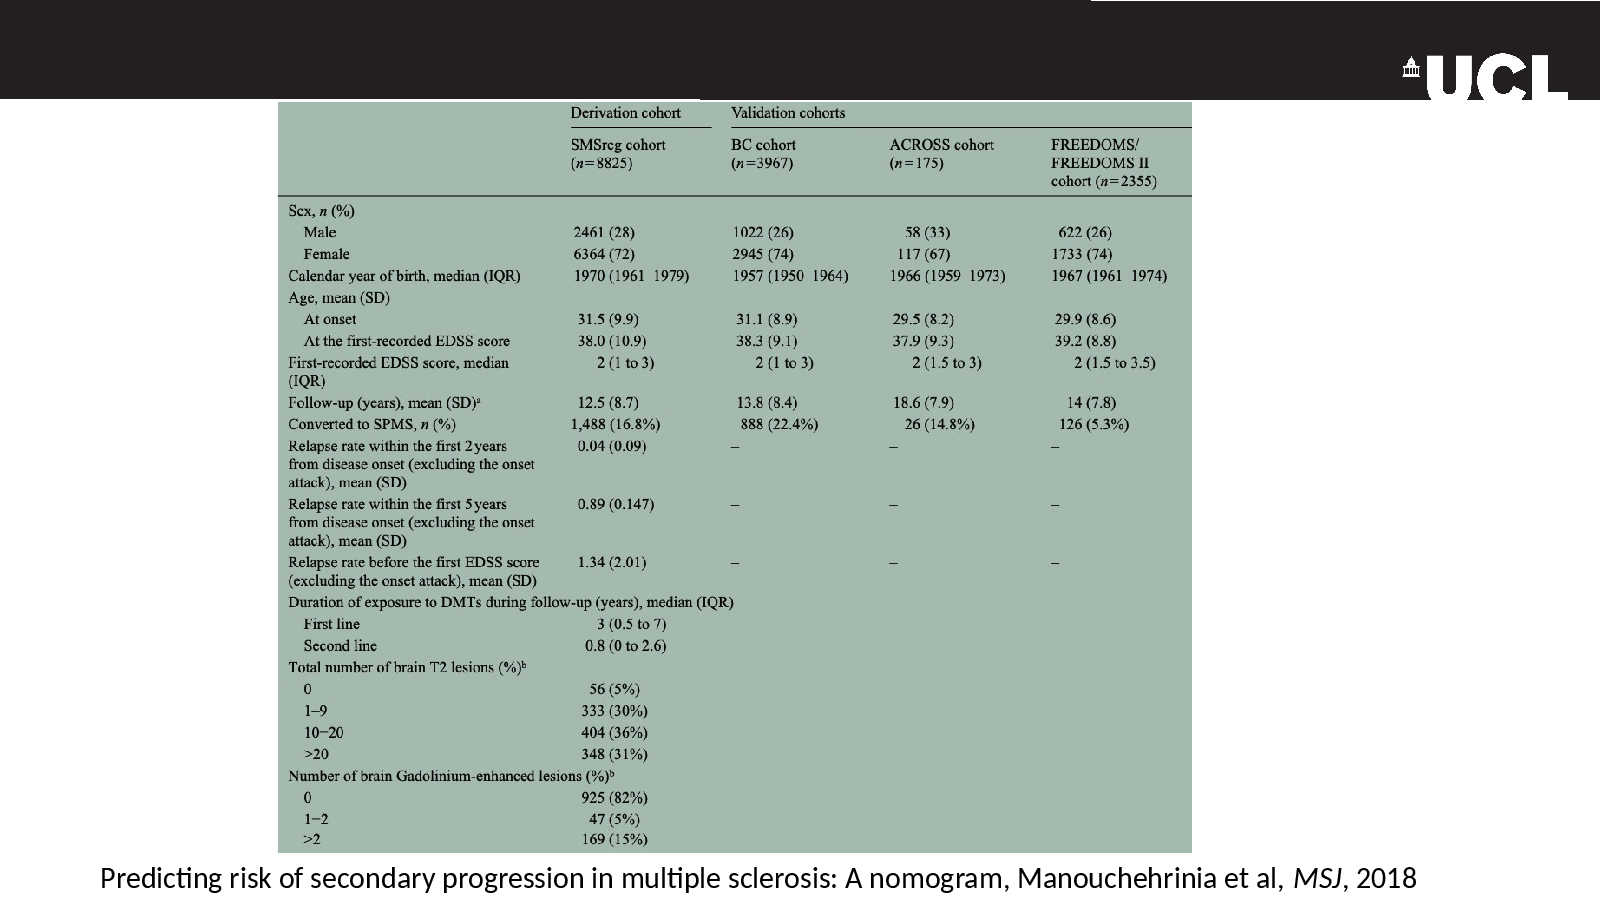
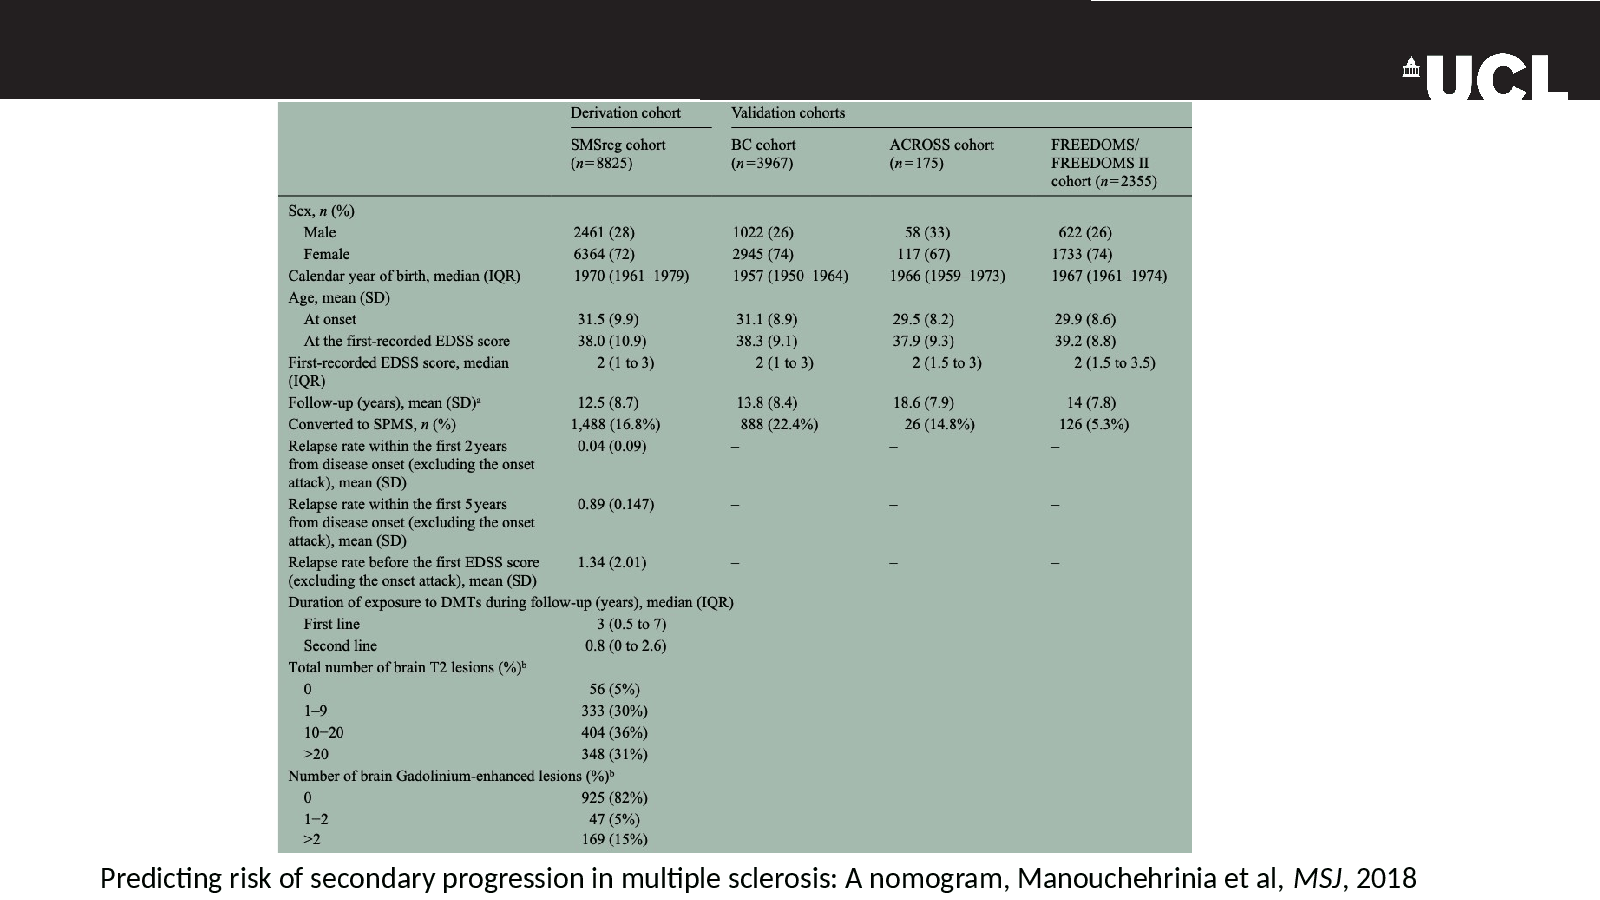
Predicting risk of secondary progression in multiple sclerosis: A nomogram, Manouchehrinia et al, MSJ, 2018
Slide 08
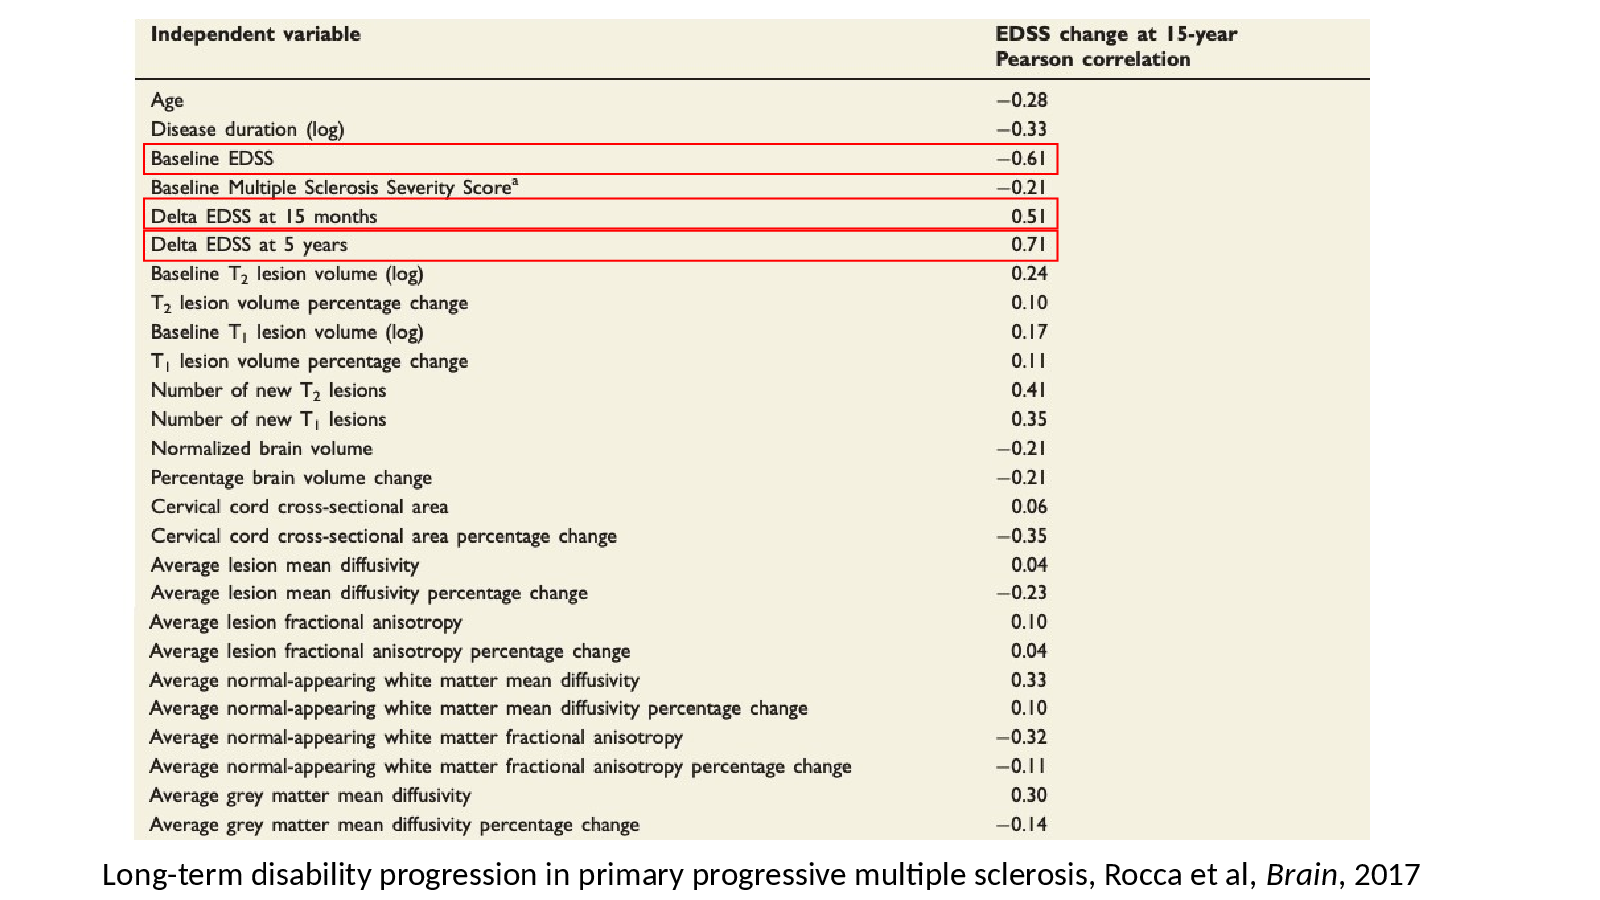
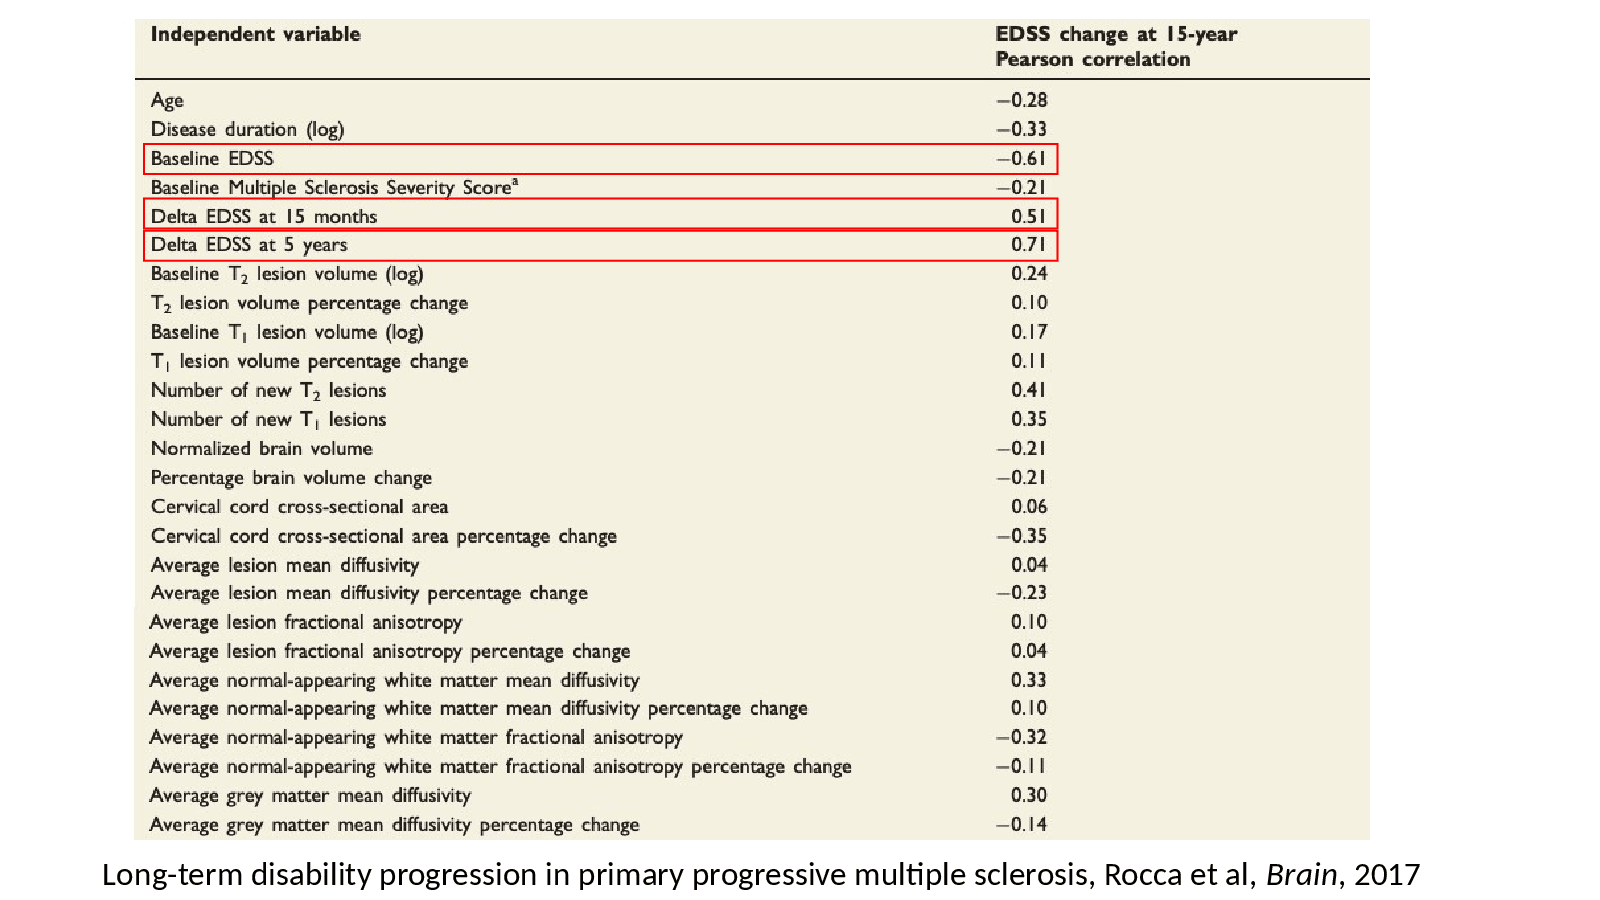
Long-term disability progression in primary progressive multiple sclerosis, Rocca et al, Brain, 2017
Slide 09
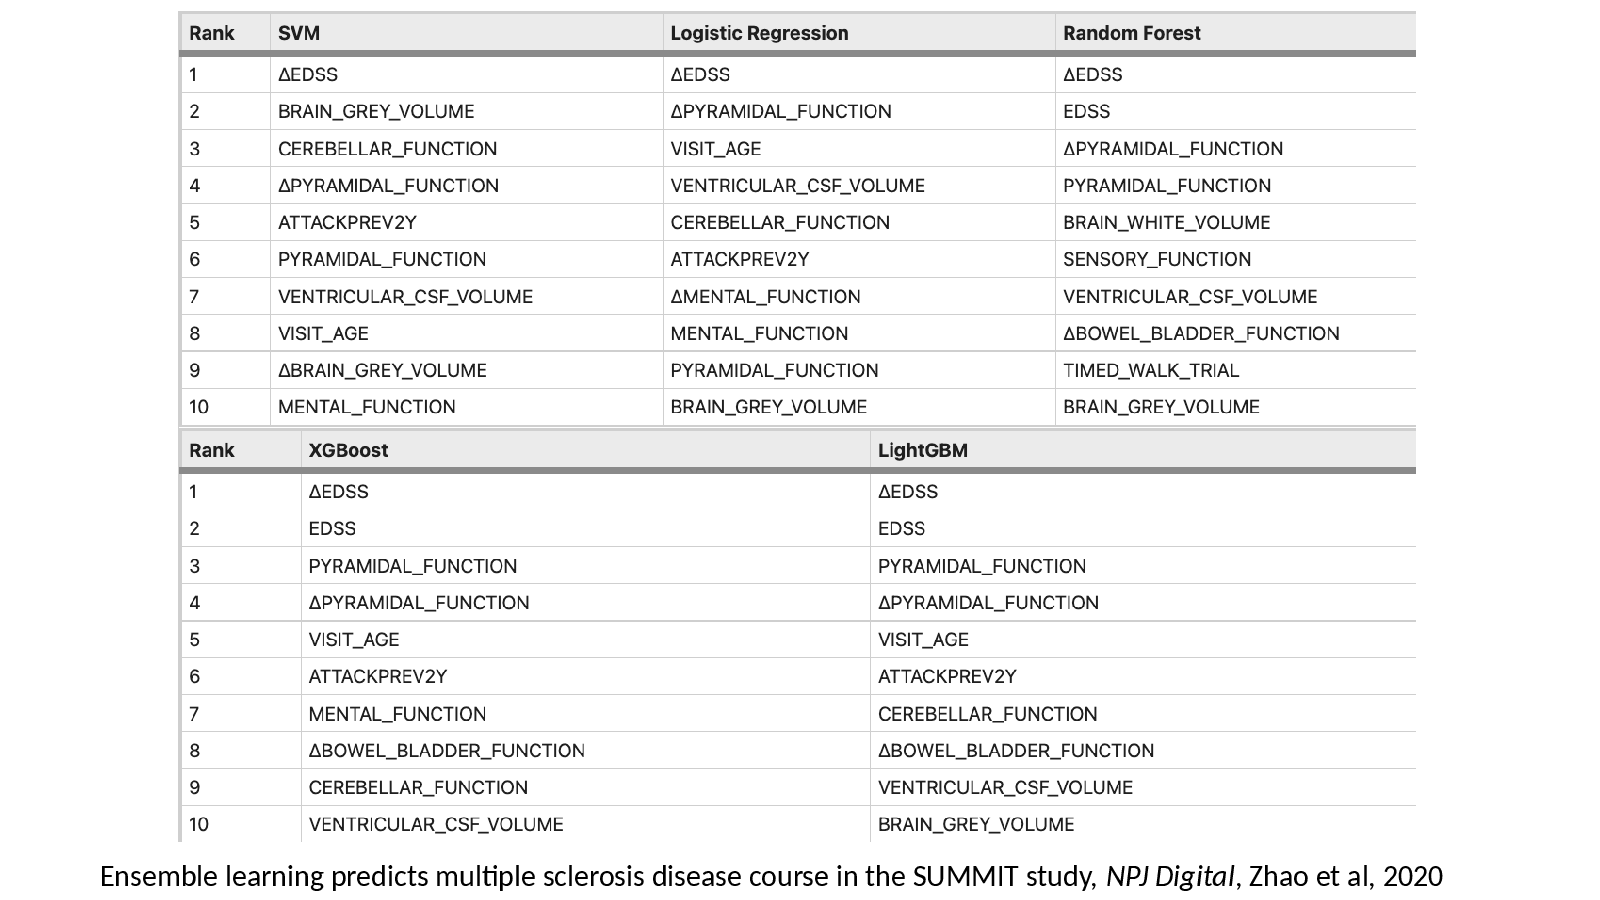
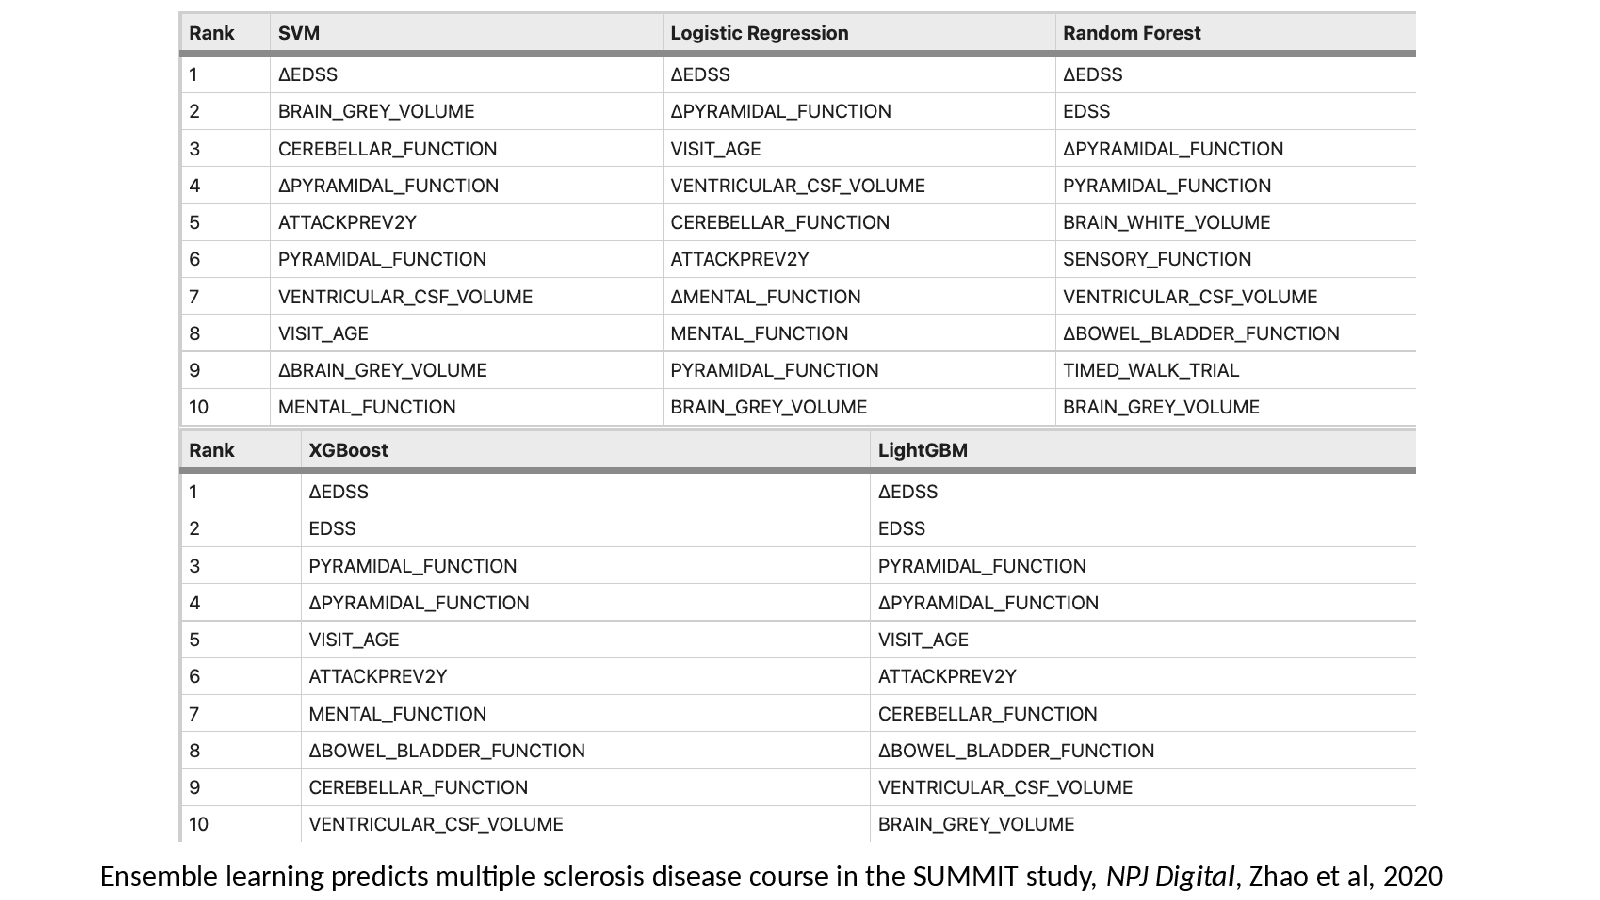
Ensemble learning predicts multiple sclerosis disease course in the SUMMIT study, NPJ Digital, Zhao et al, 2020
Slide 10
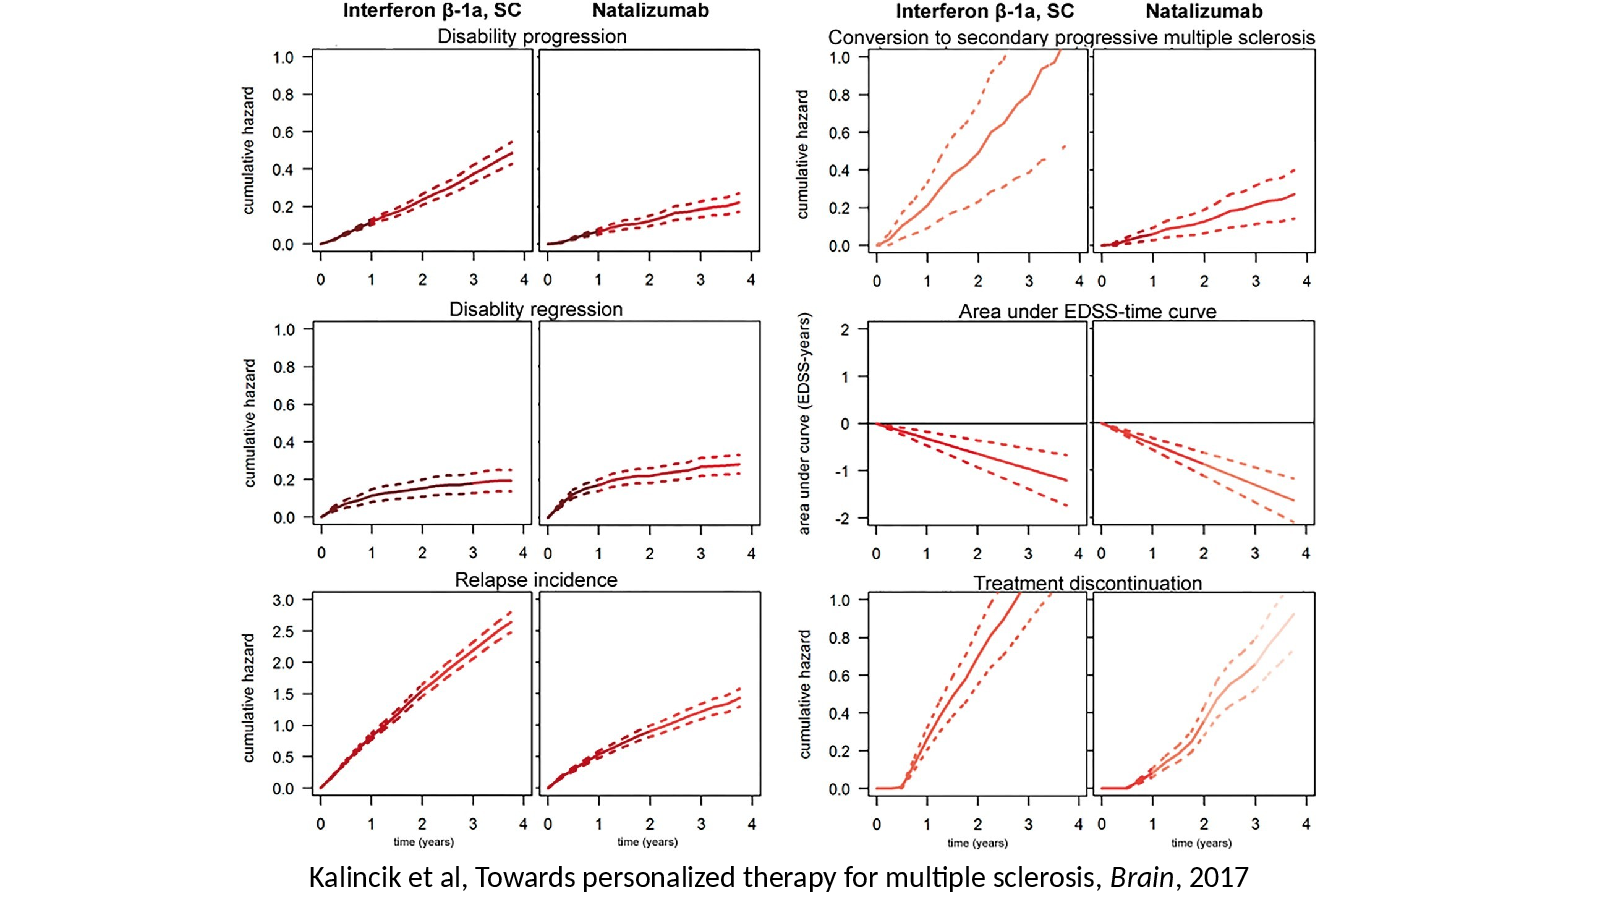
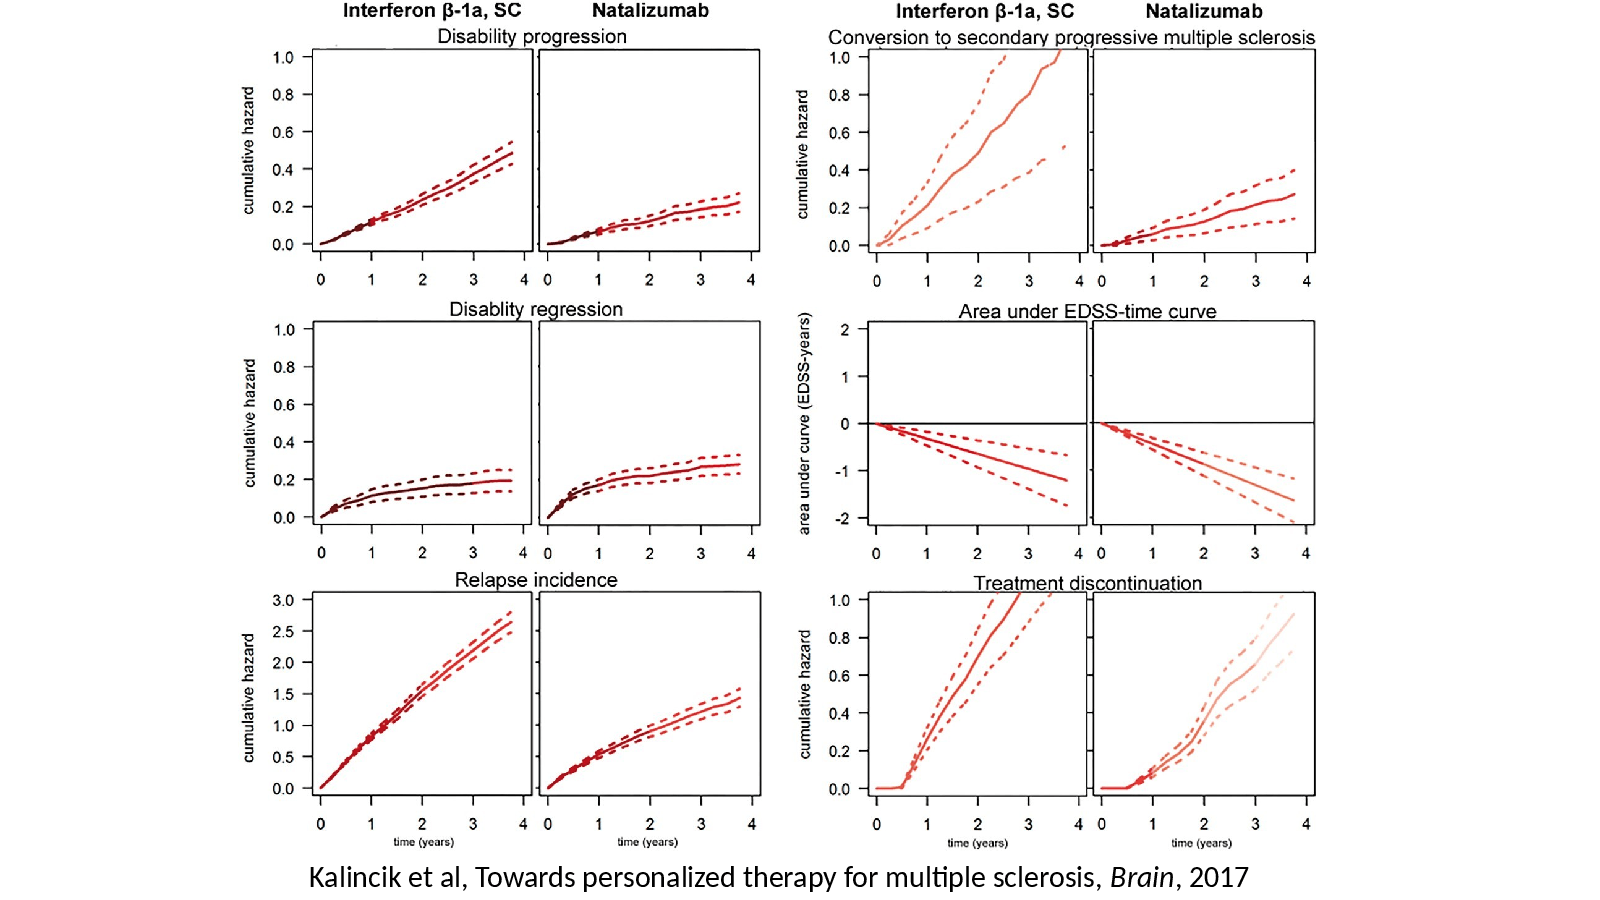
Kalincik et al, Towards personalized therapy for multiple sclerosis, Brain, 2017
Slide 11
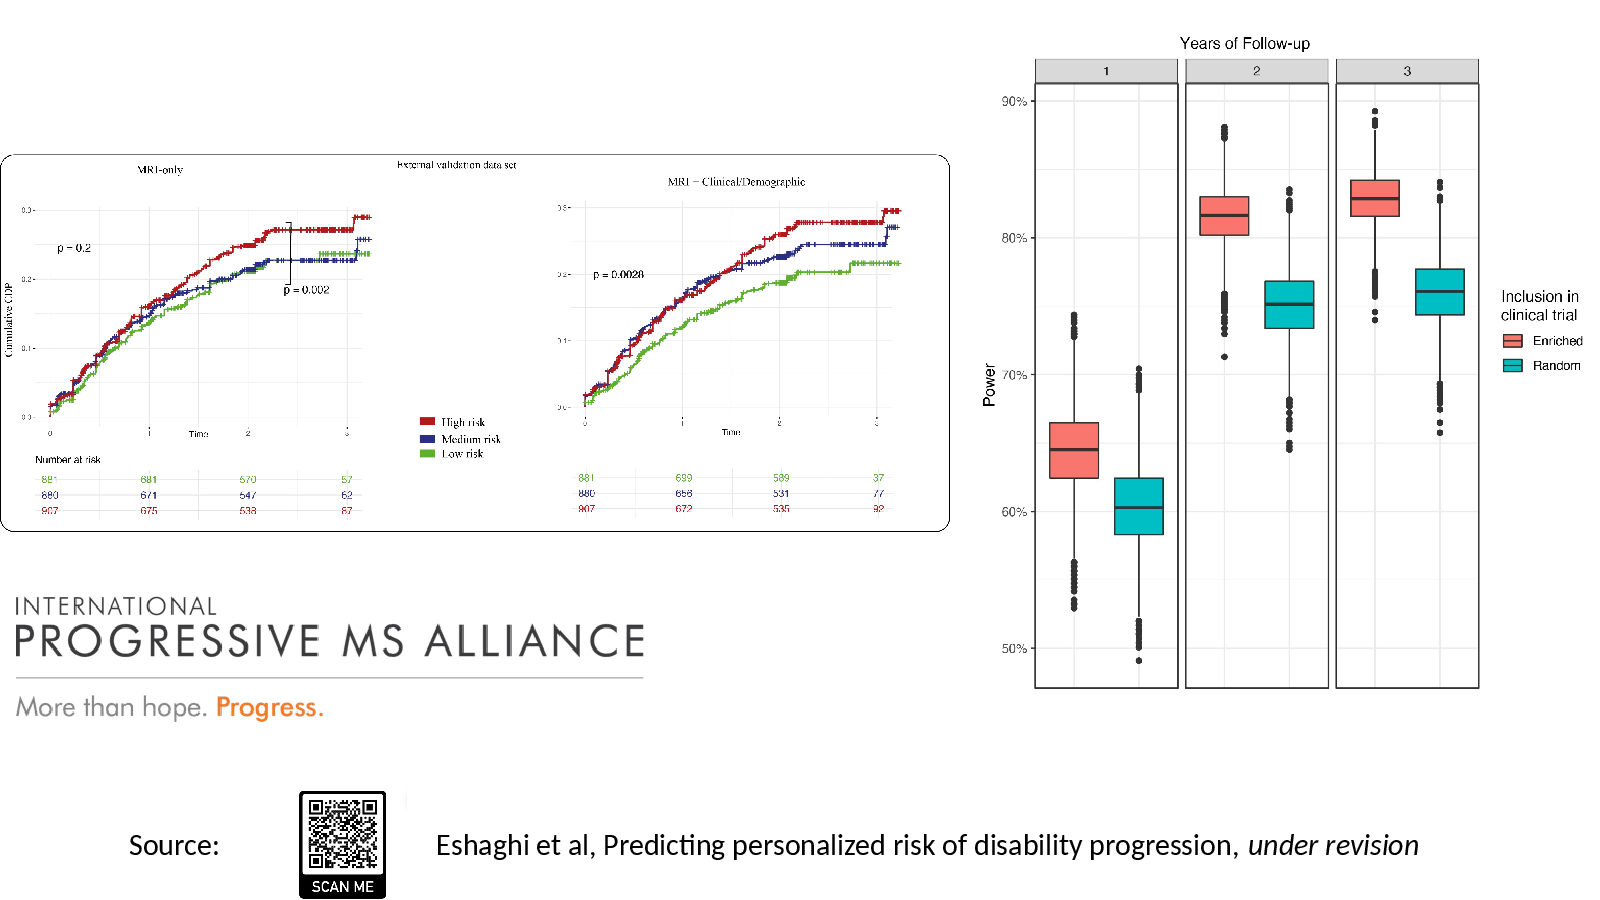
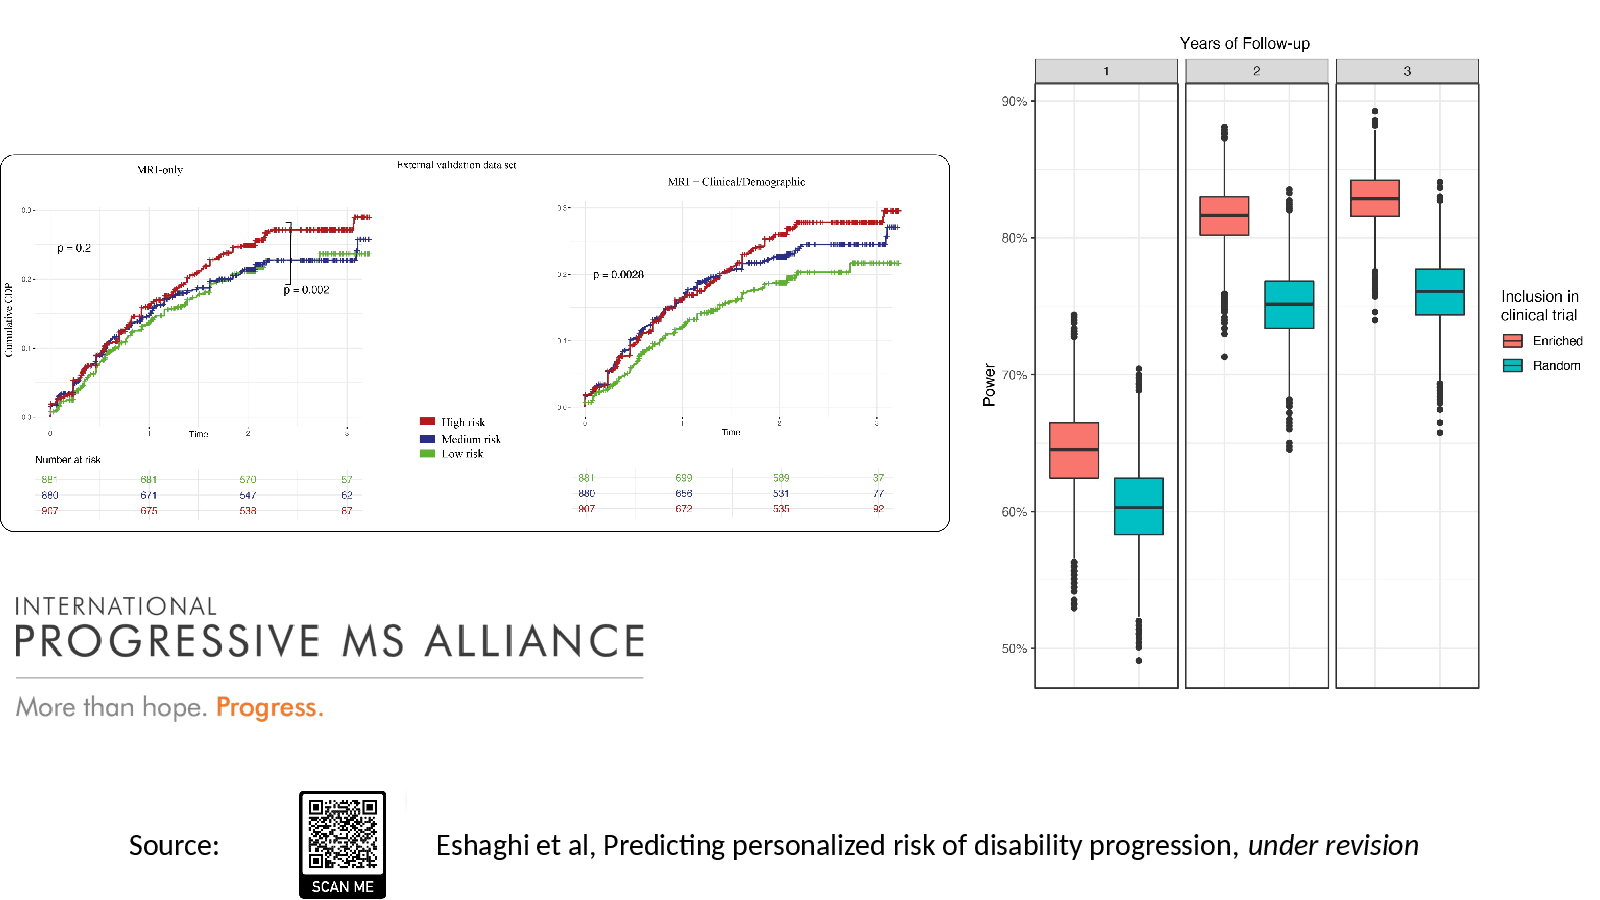
Source: Eshaghi et al, Predicting personalized risk of disability progression, under revision
Slide 12
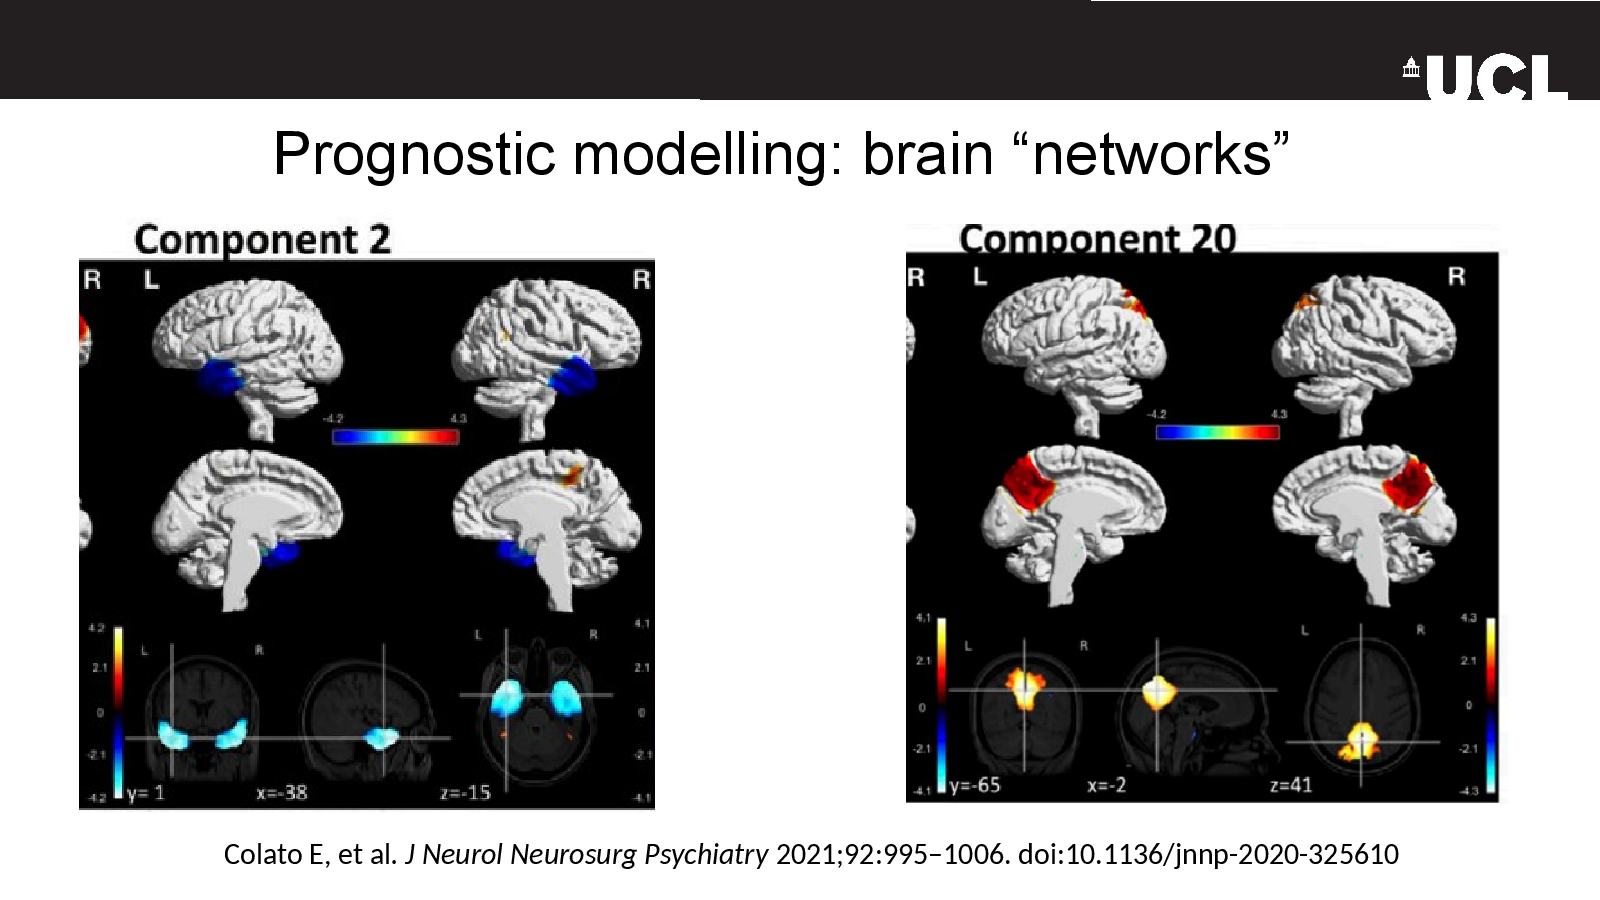
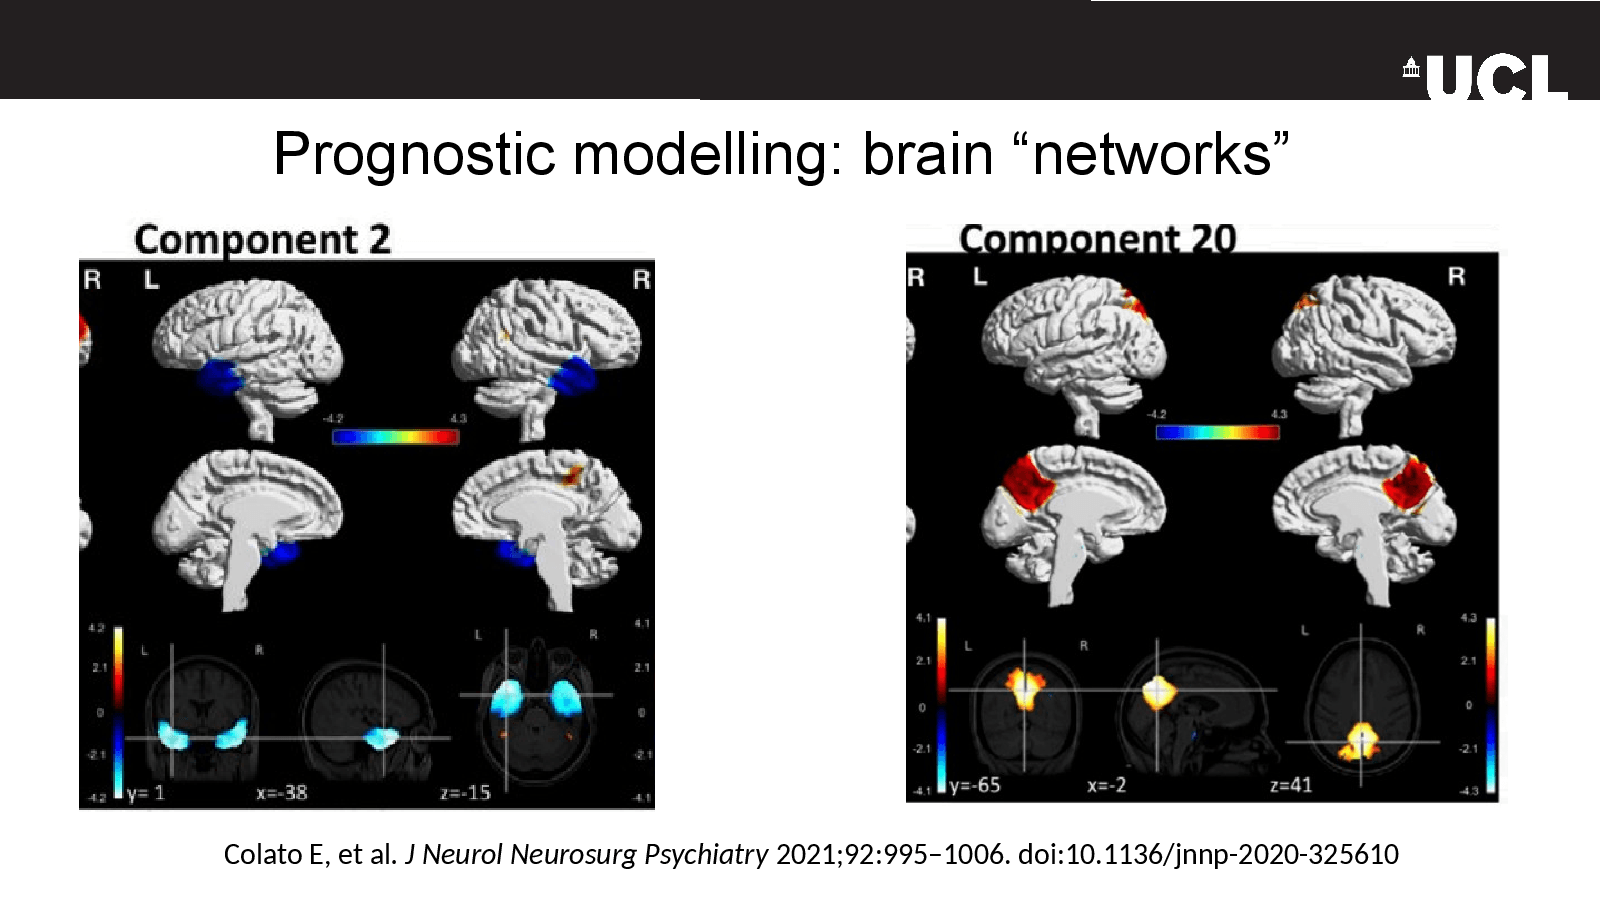
Prognostic modelling: brain “networks”
Slide 13
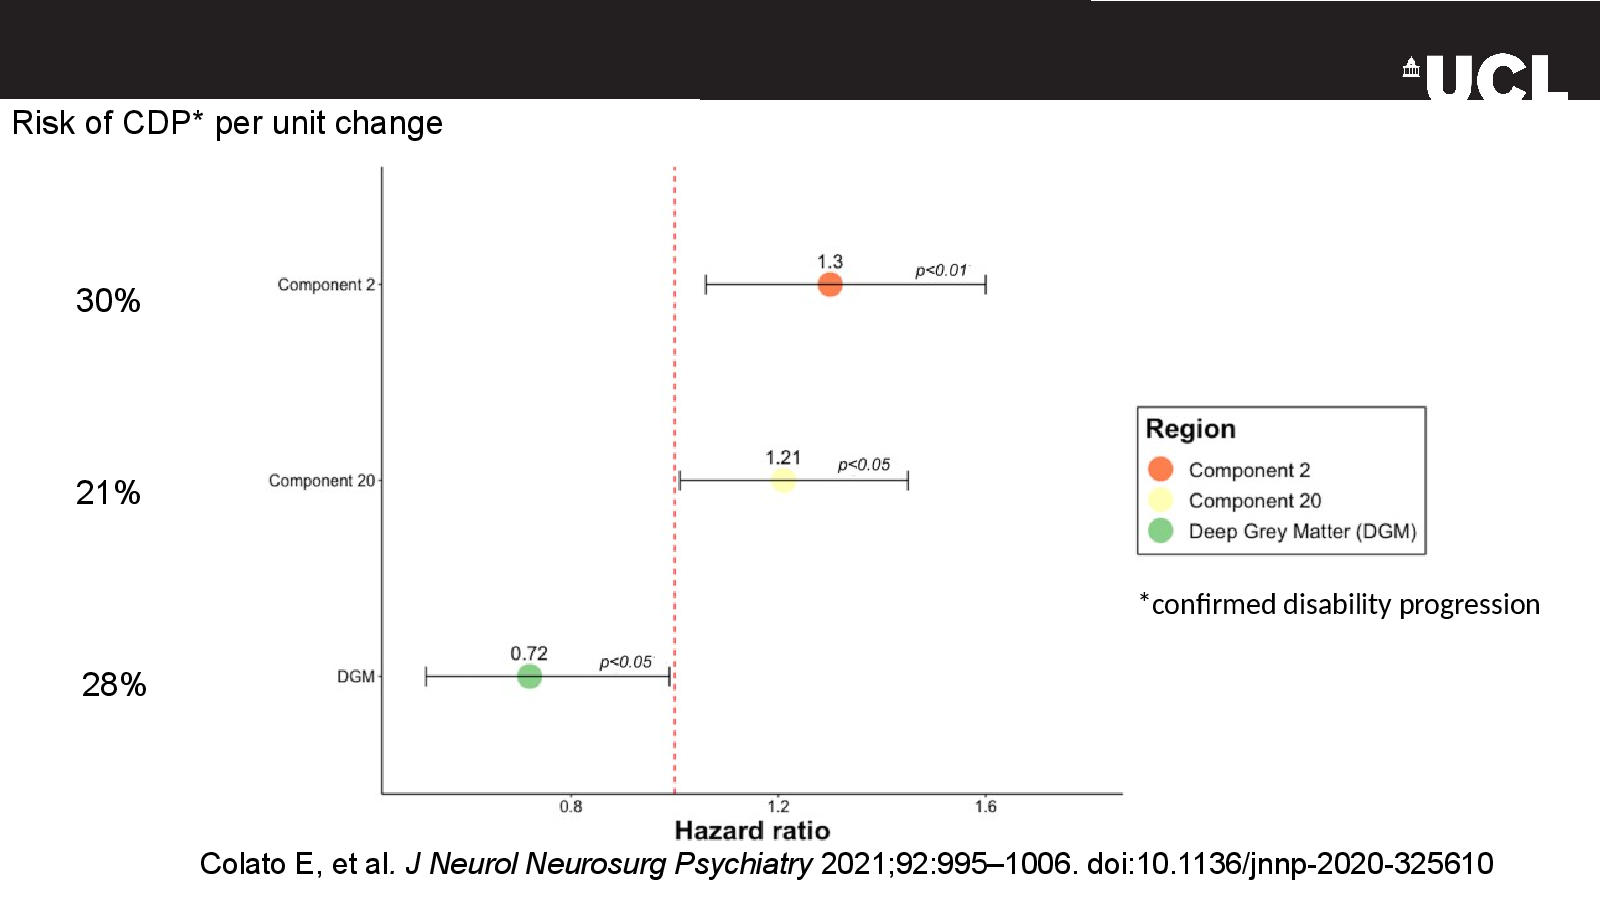
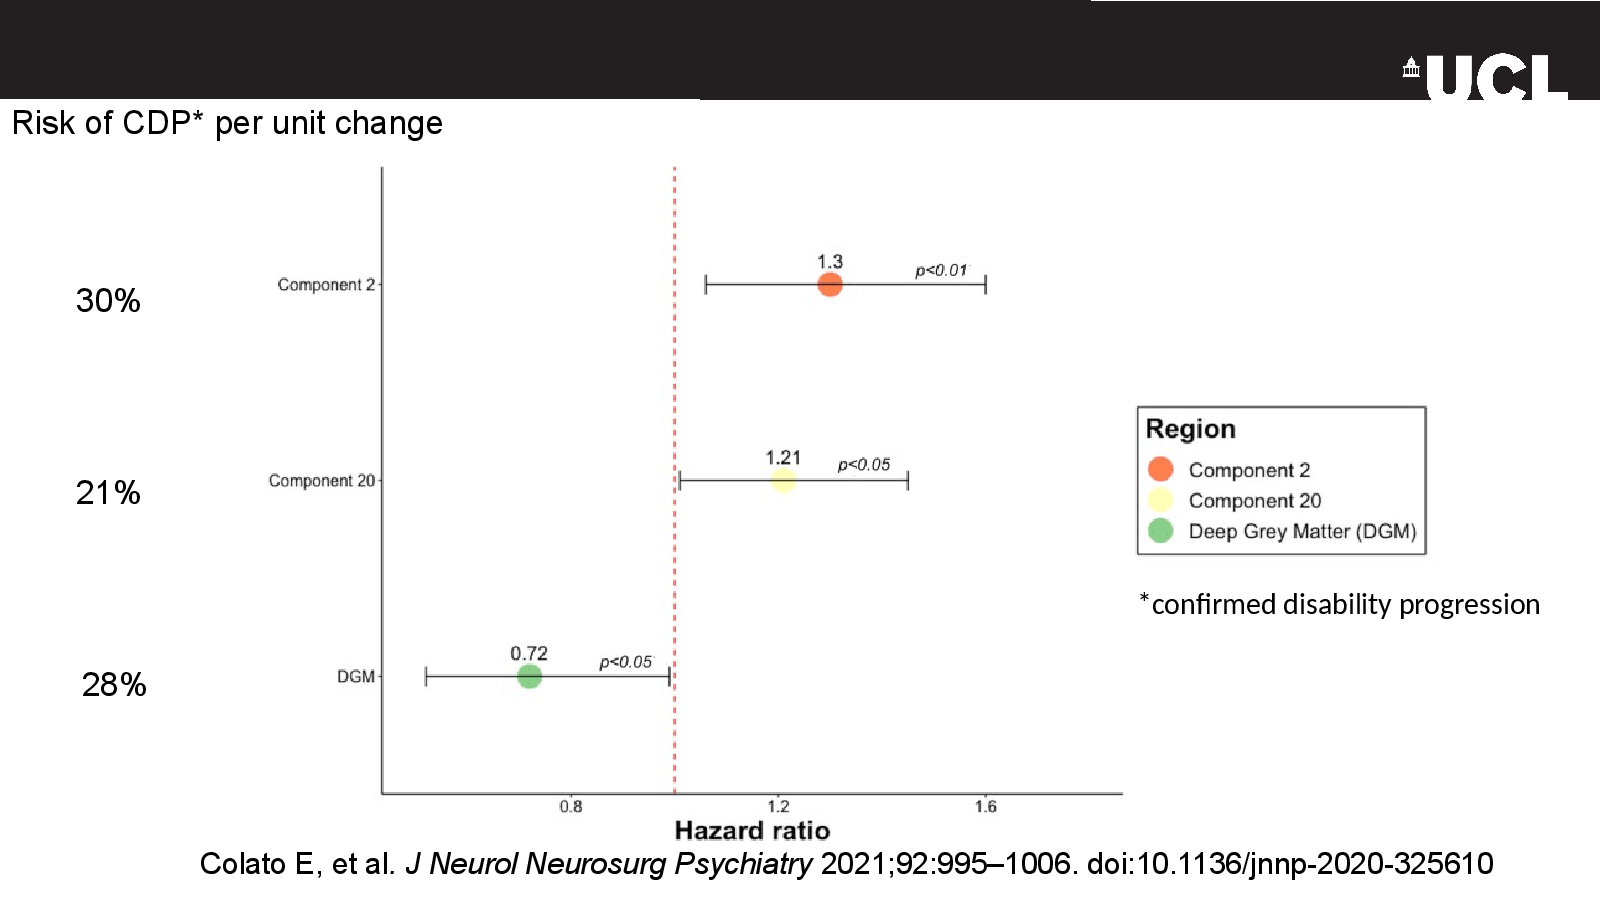
Colato E, et al. J Neurol Neurosurg Psychiatry 2021;92:995–1006. doi:10.1136/jnnp-2020-325610
Slide 14
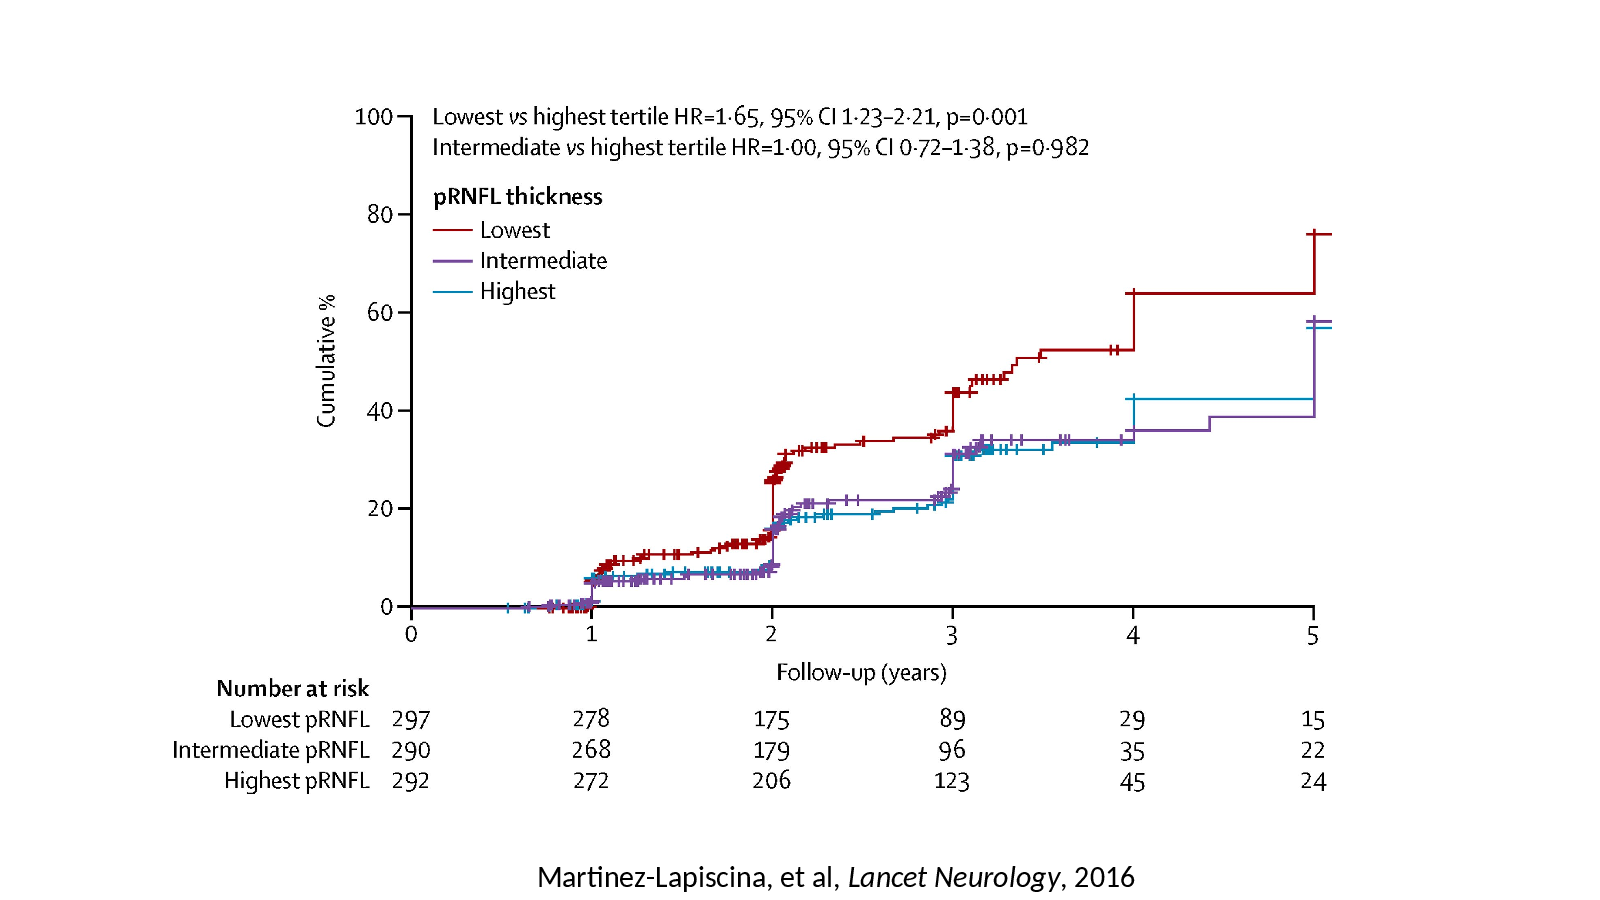
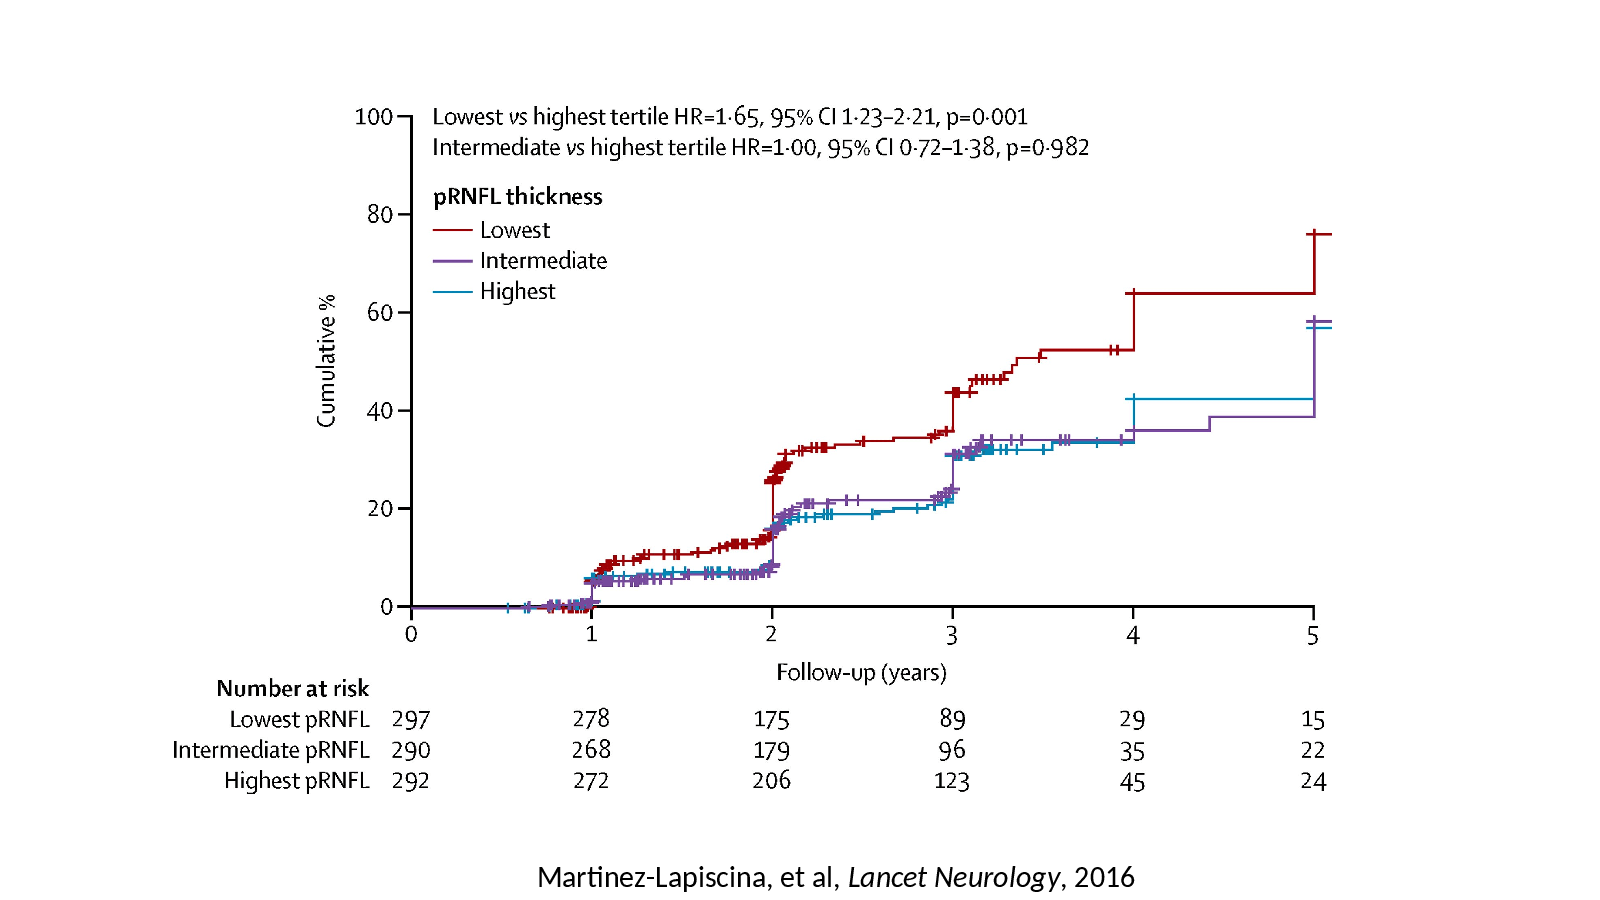
Martinez-Lapiscina, et al, Lancet Neurology, 2016
Slide 15
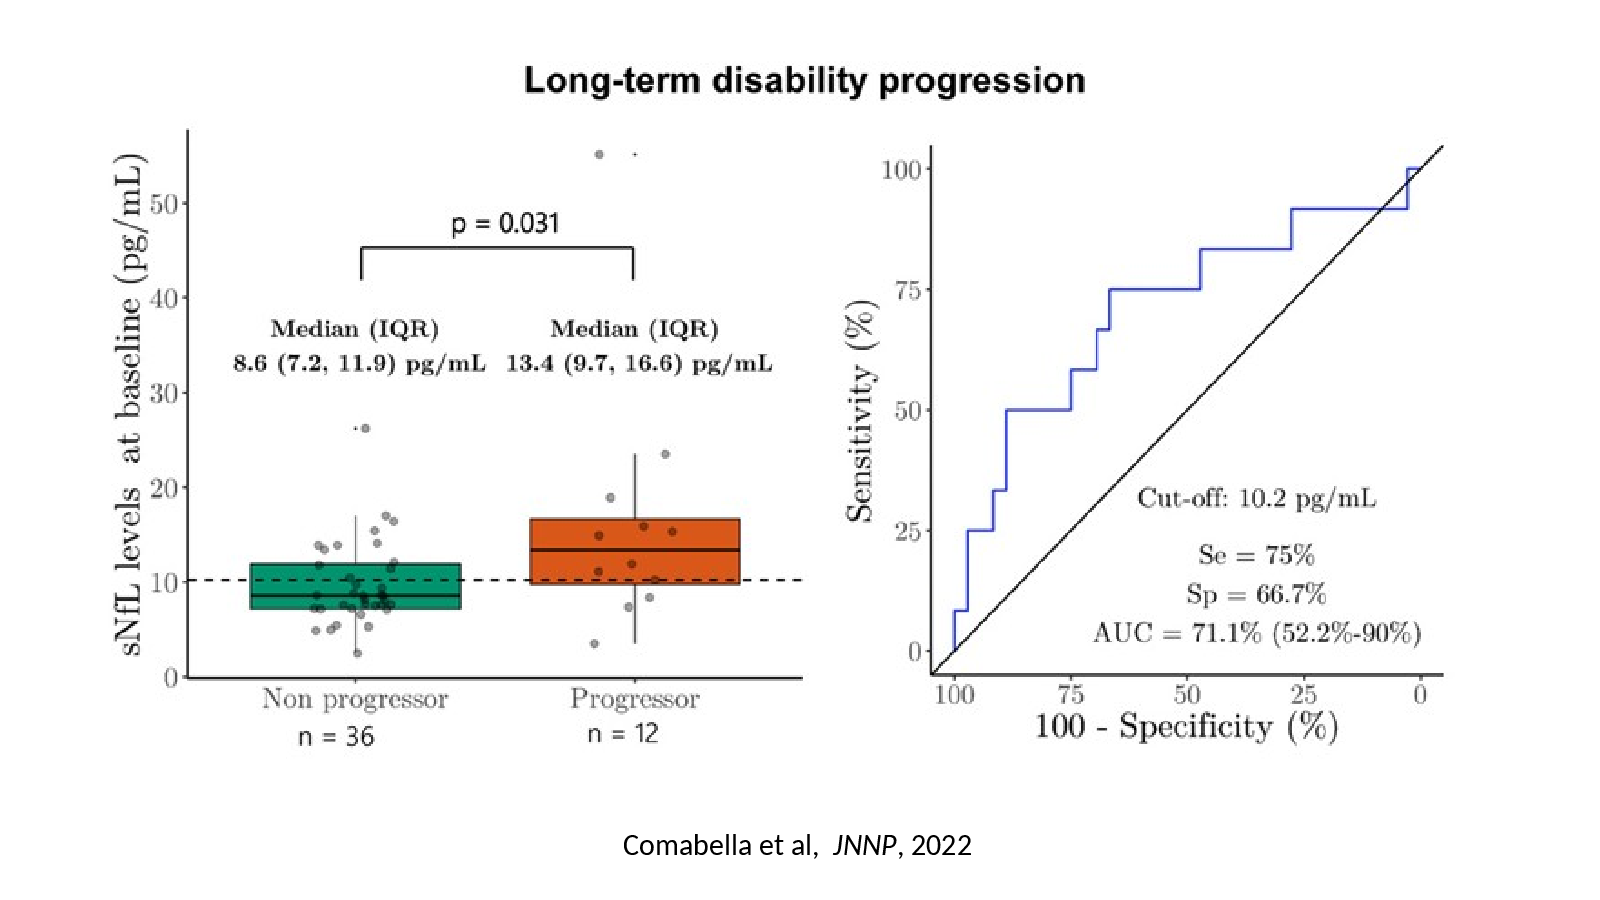
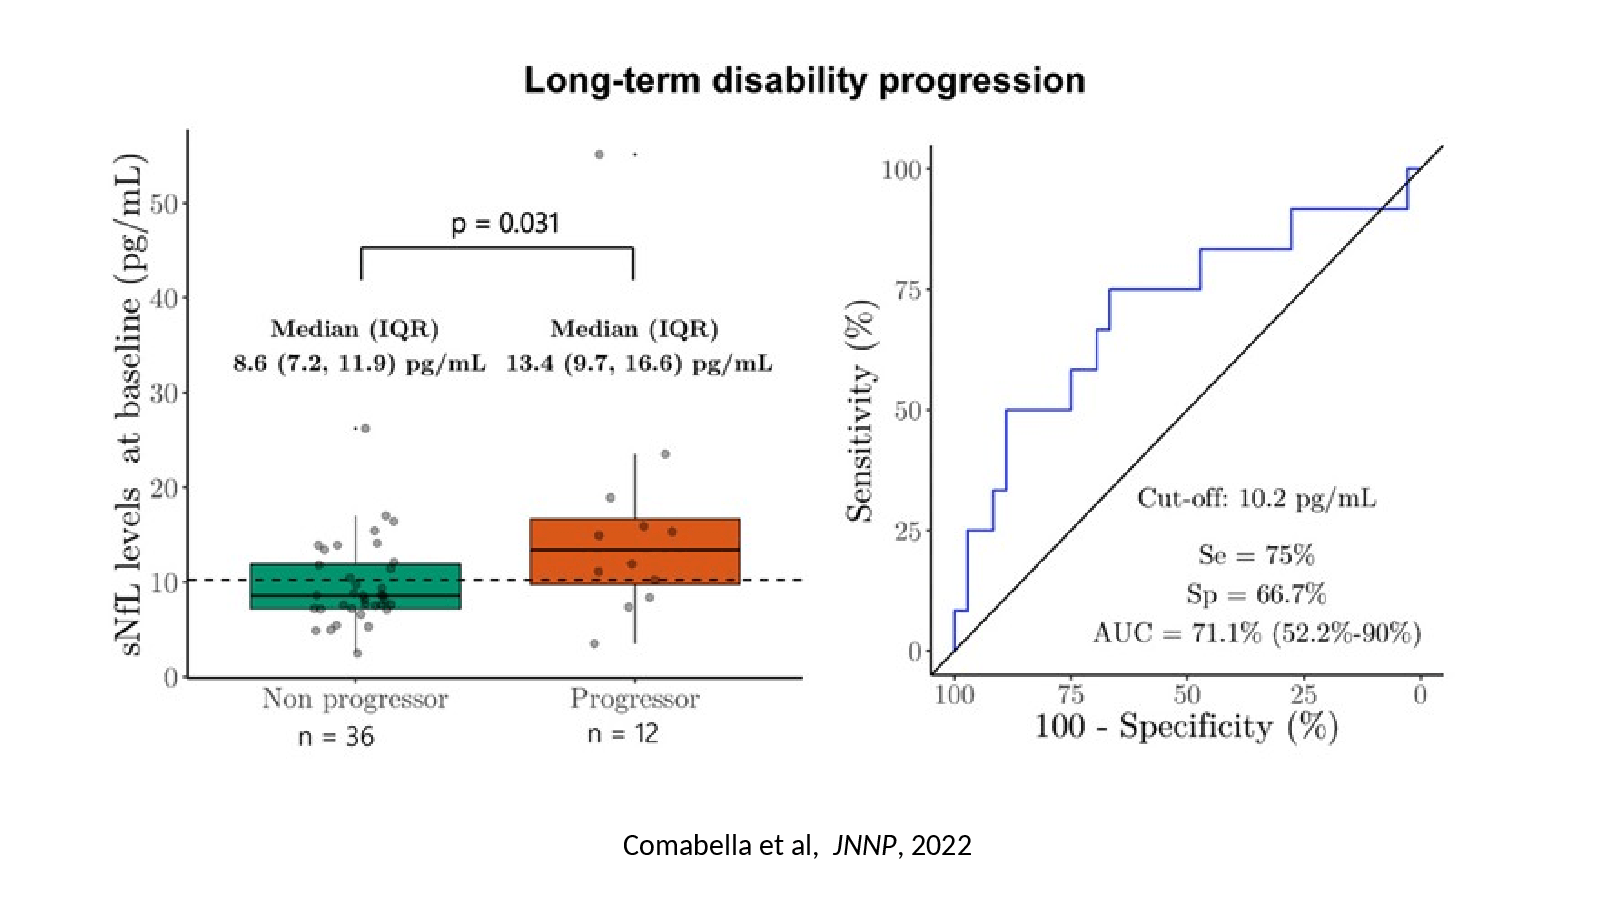
Comabella et al, JNNP, 2022
Slide 16
Slide 16

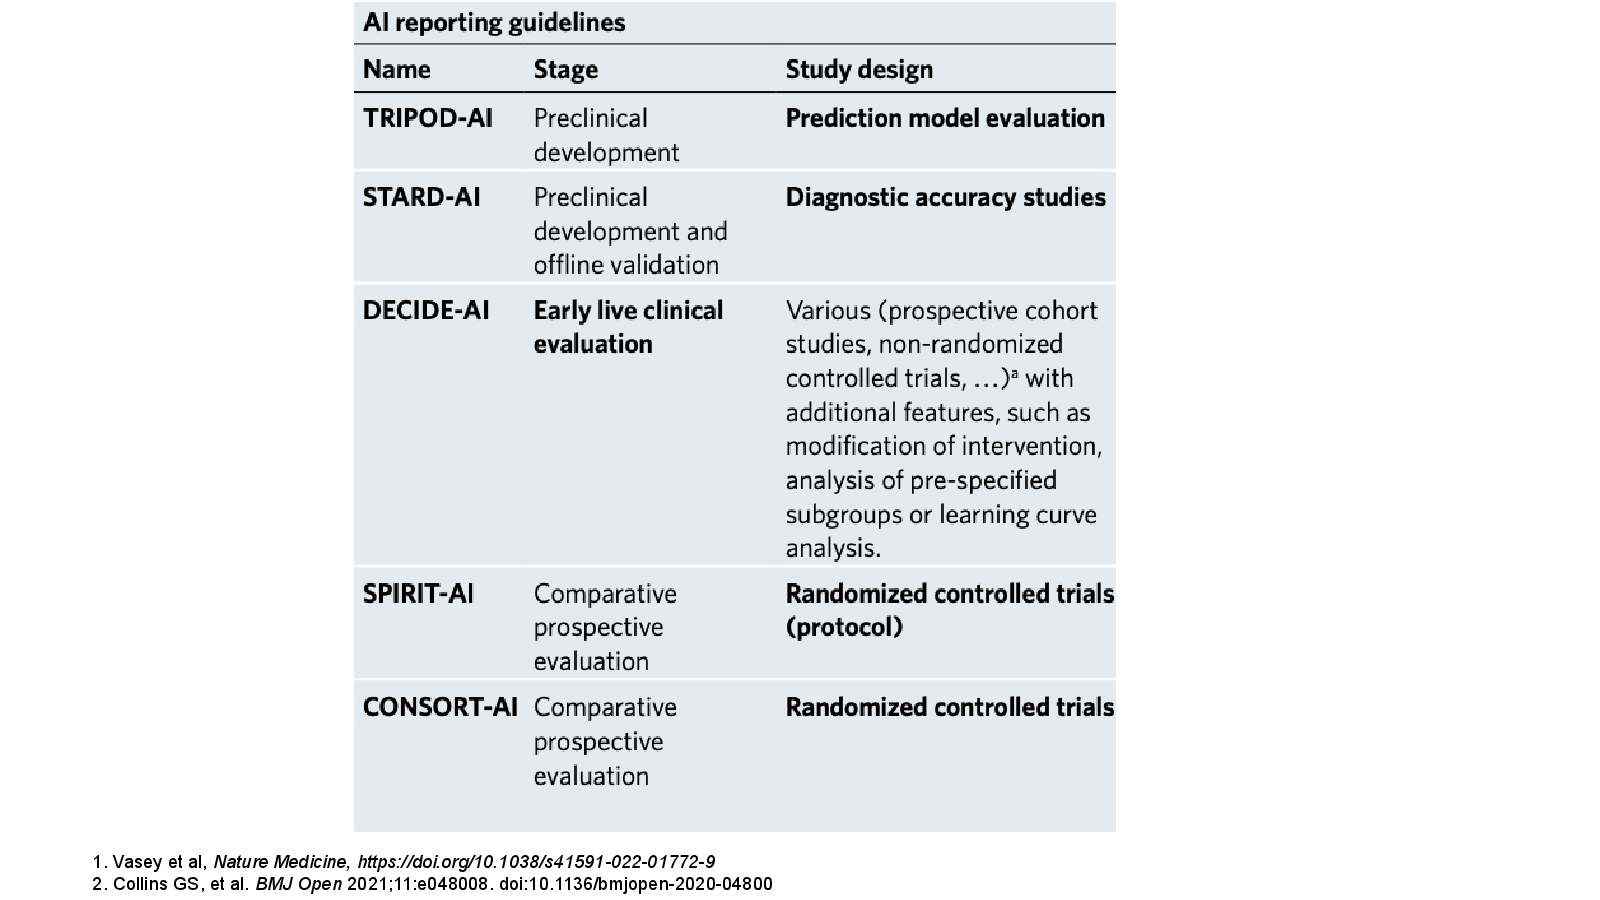
Slide 17
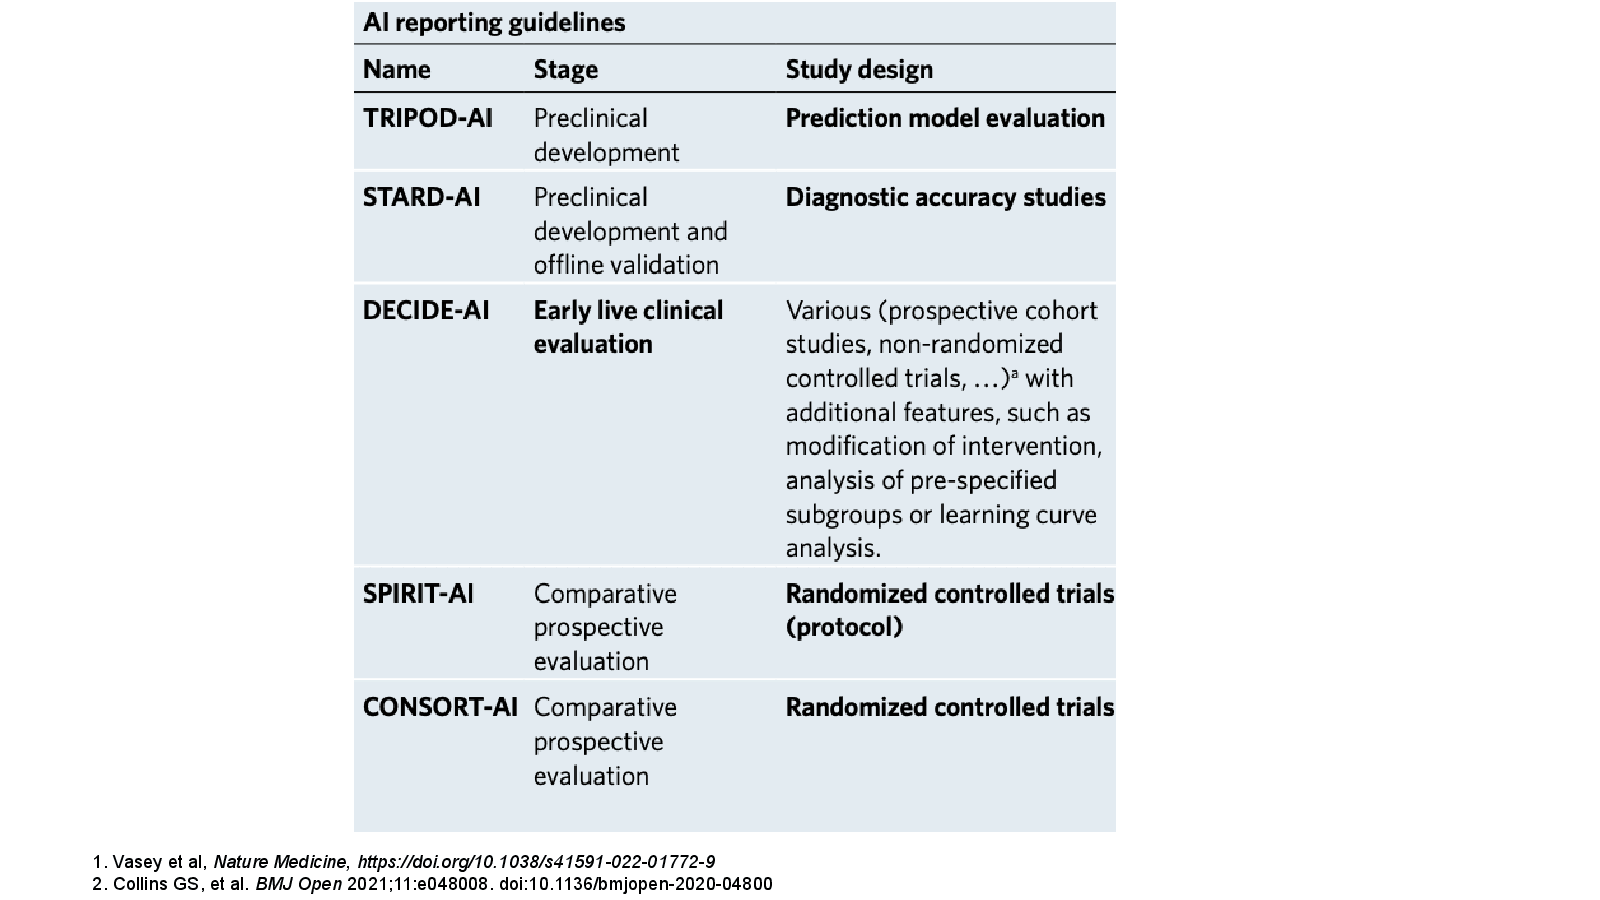
2. Collins GS, et al. BMJ Open 2021;11:e048008. doi:10.1136/bmjopen-2020-04800
Slide 18
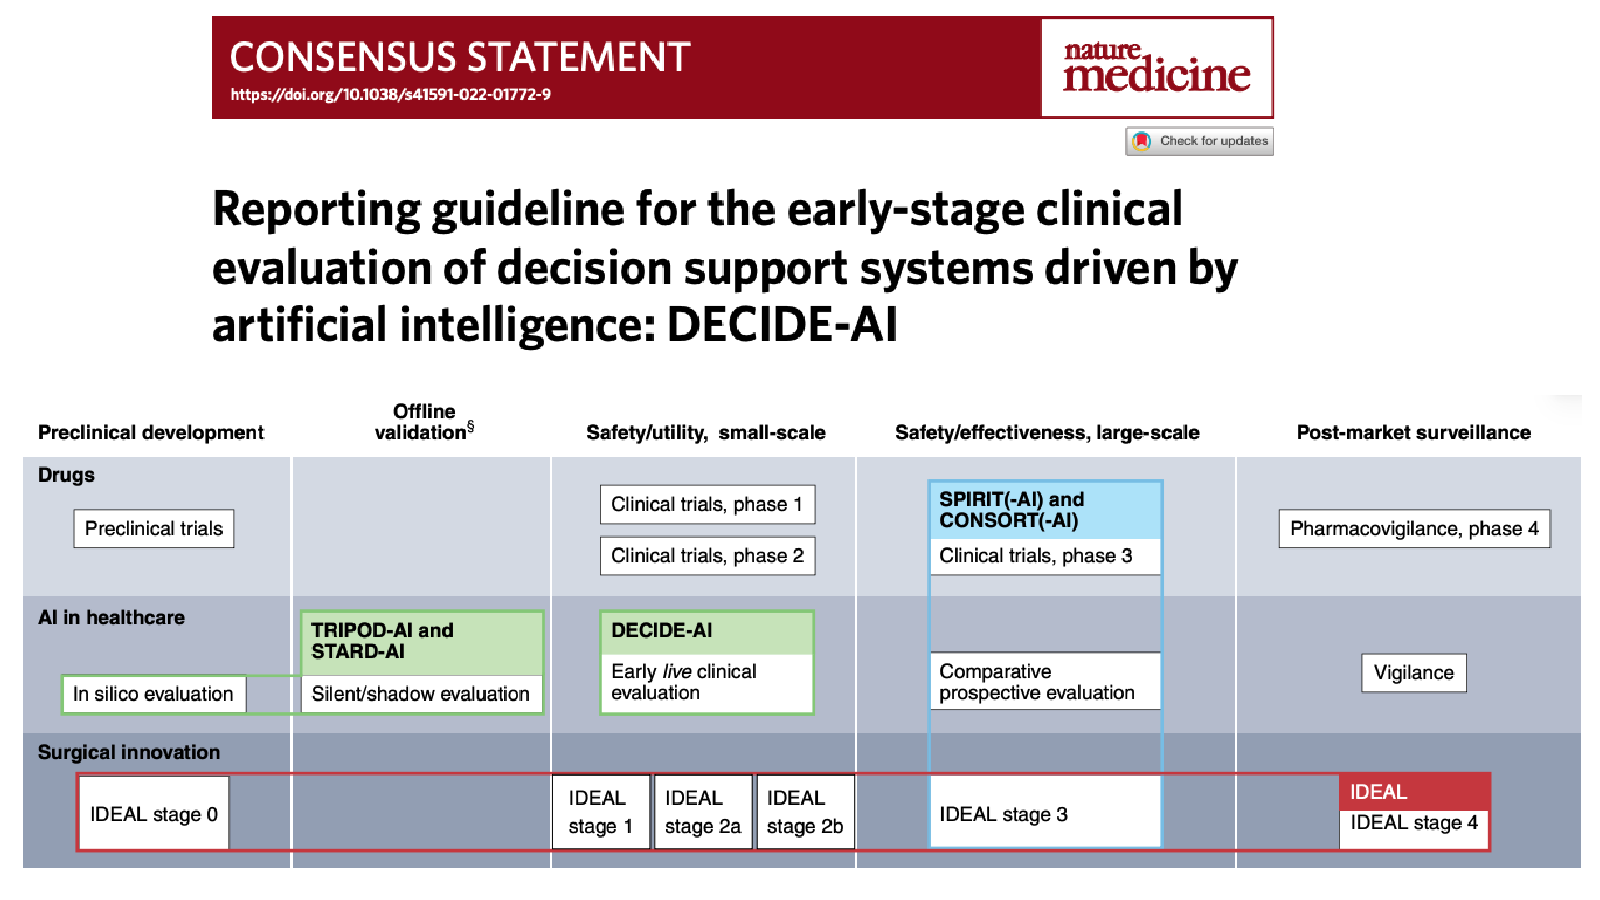
Slide 18
Slide 19
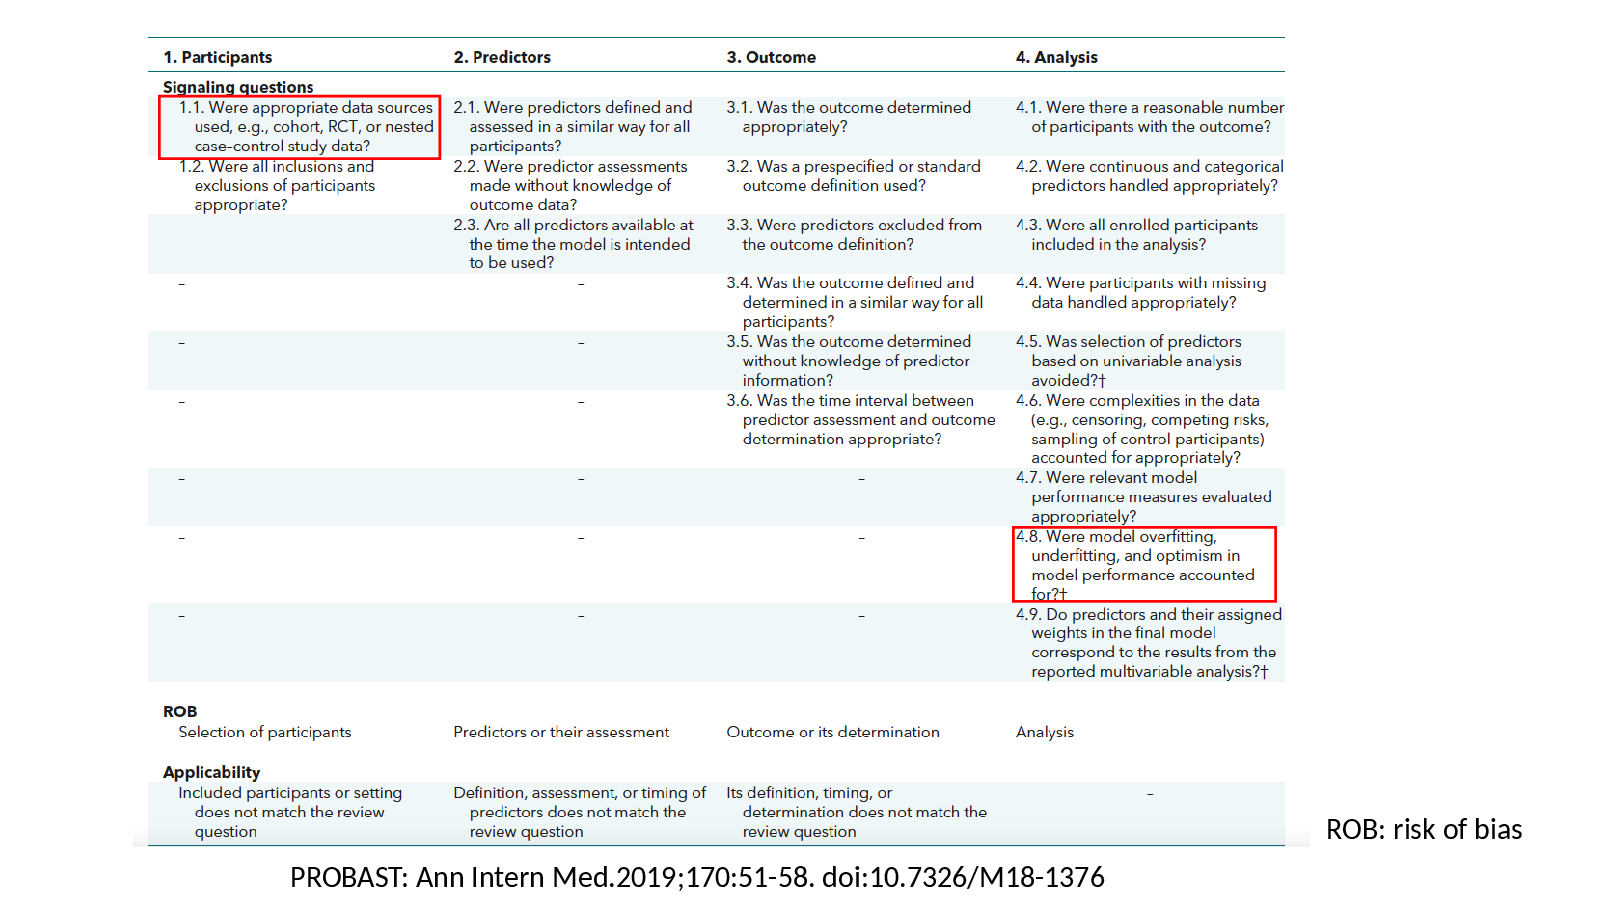
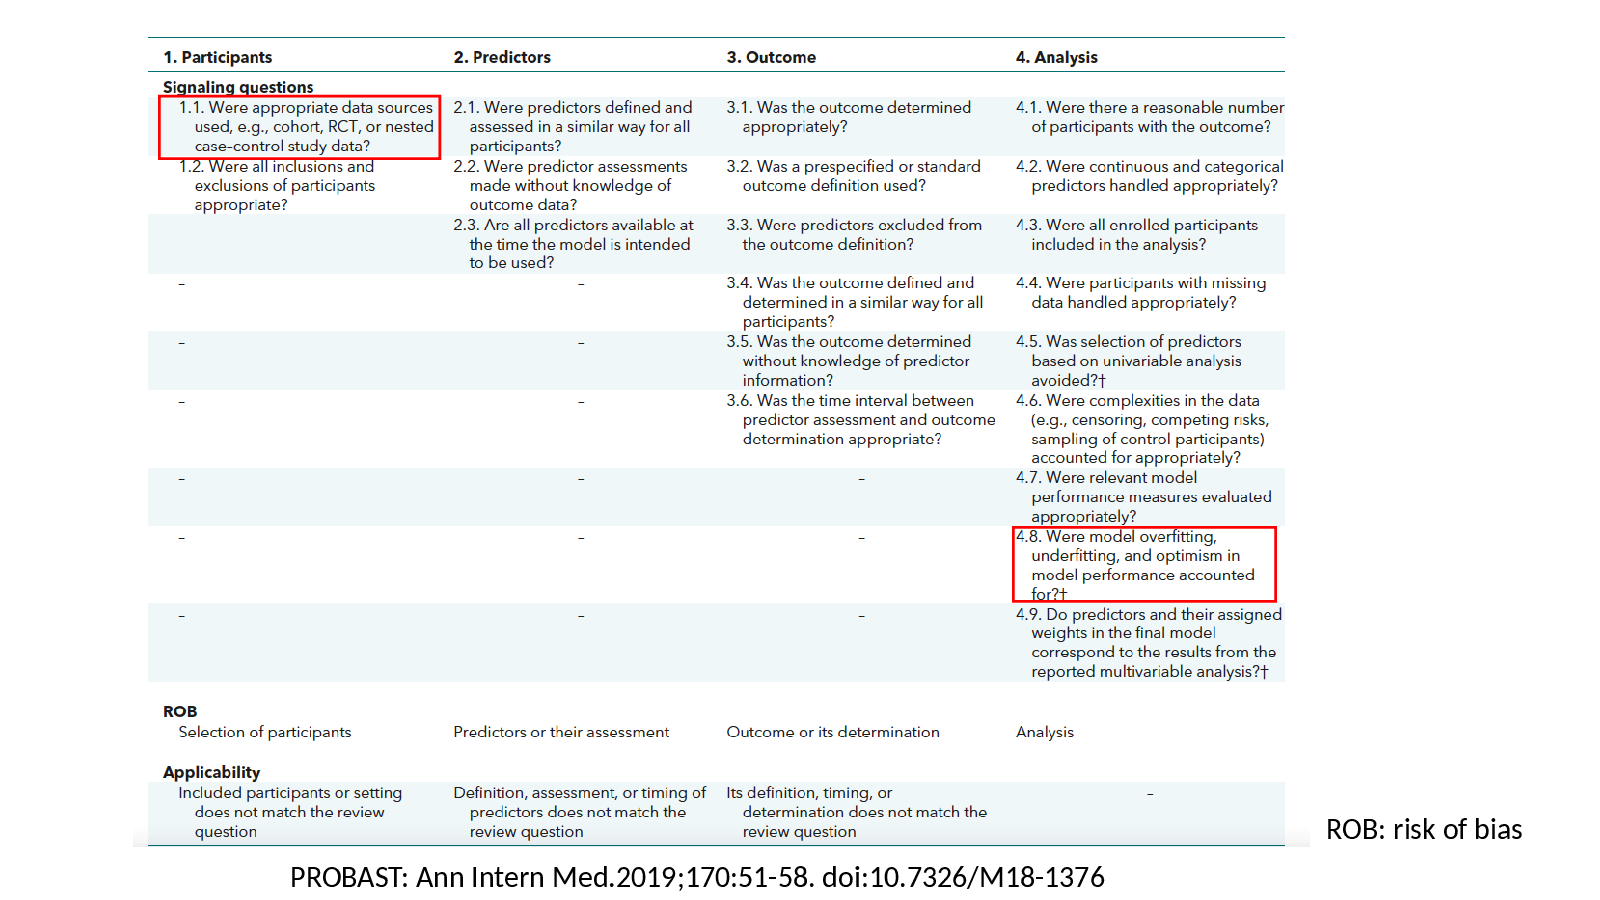
PROBAST: Ann Intern Med.2019;170:51-58. doi:10.7326/M18-1376
Slide 20
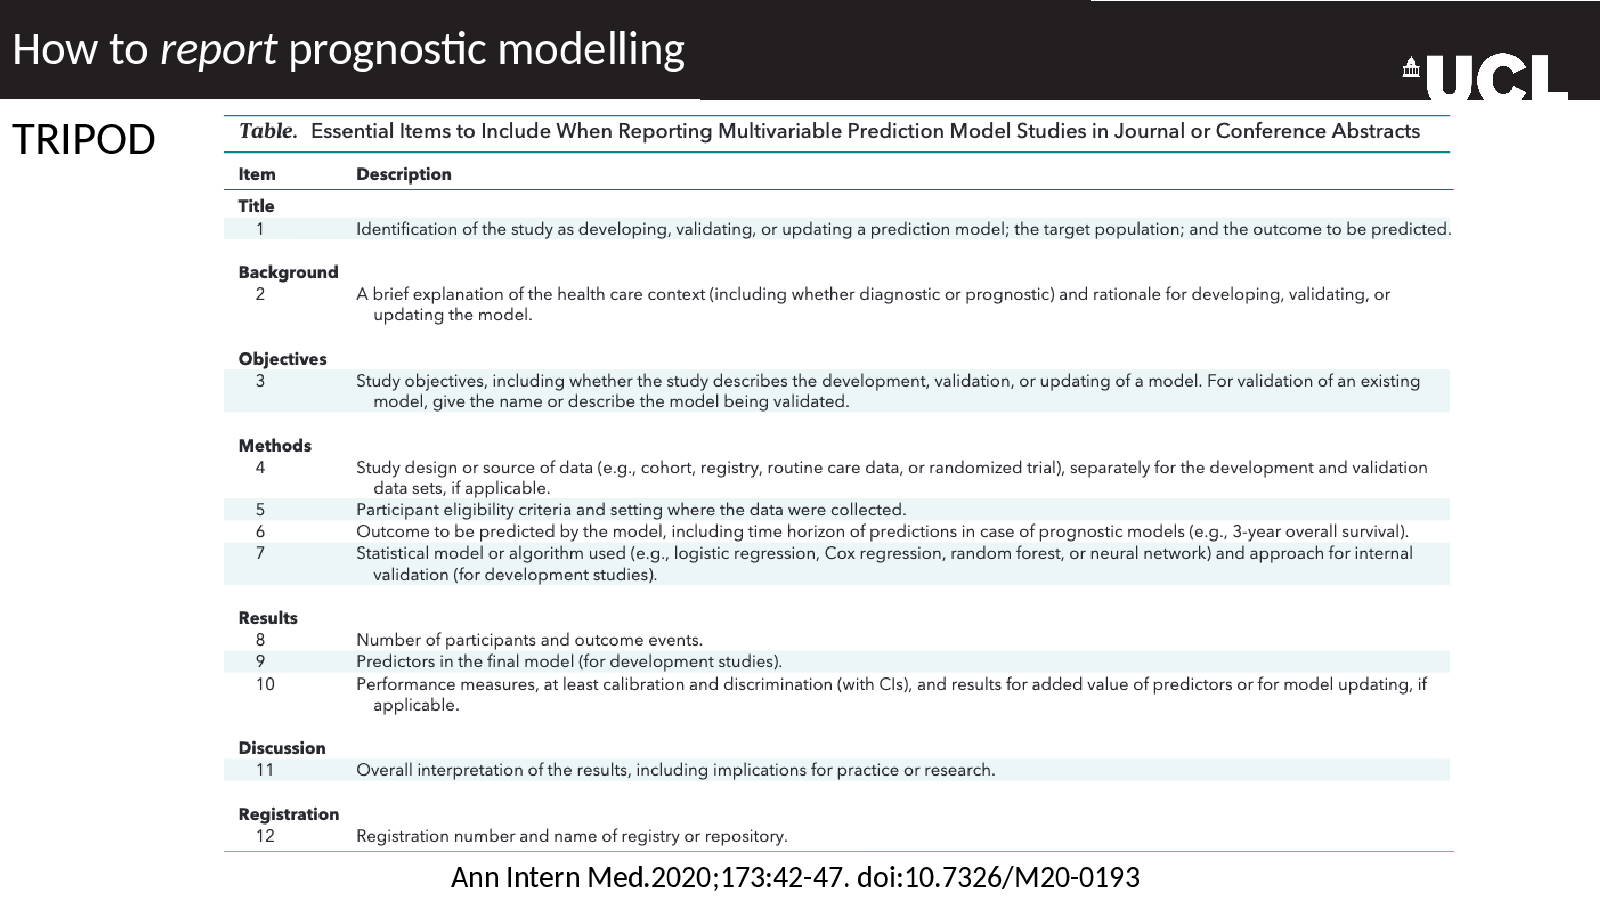
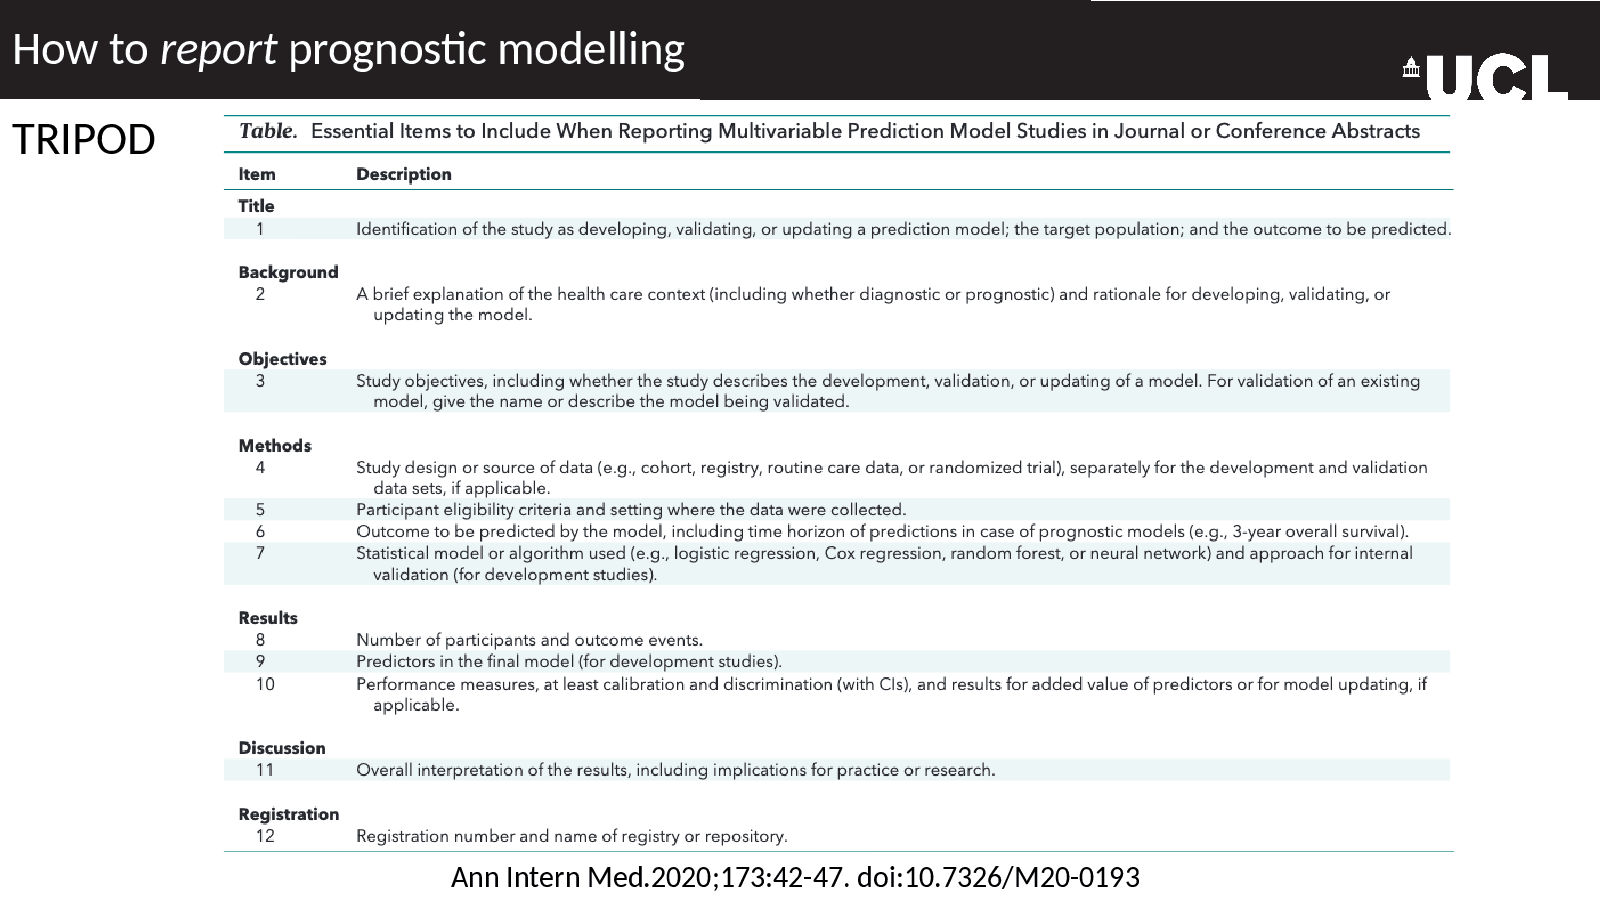
How to report prognostic modelling
Slide 21
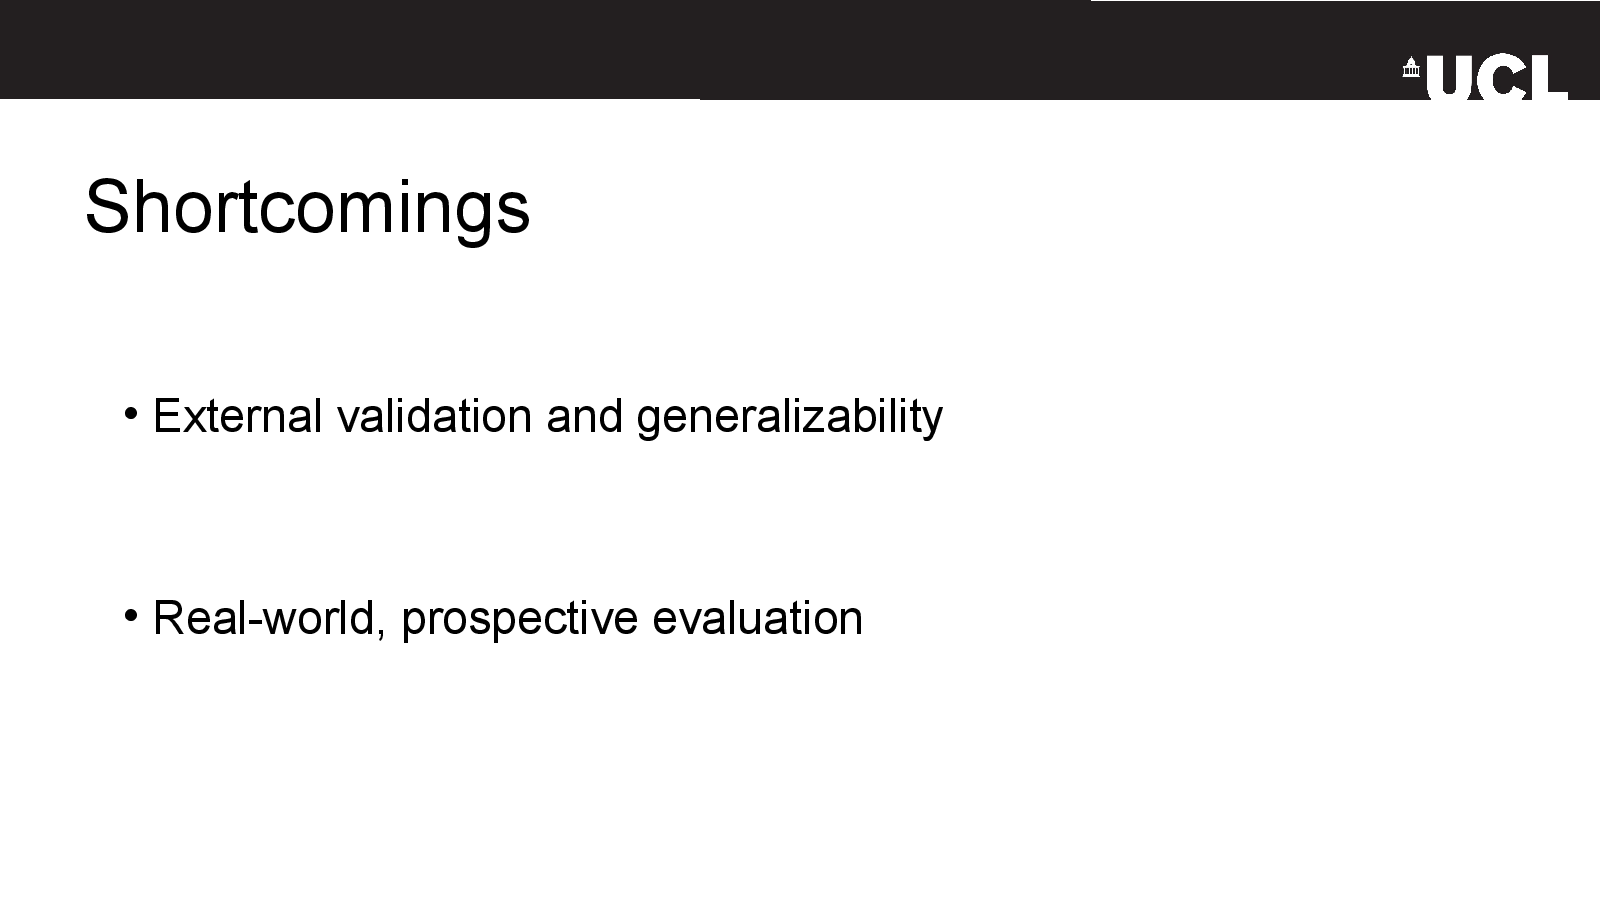
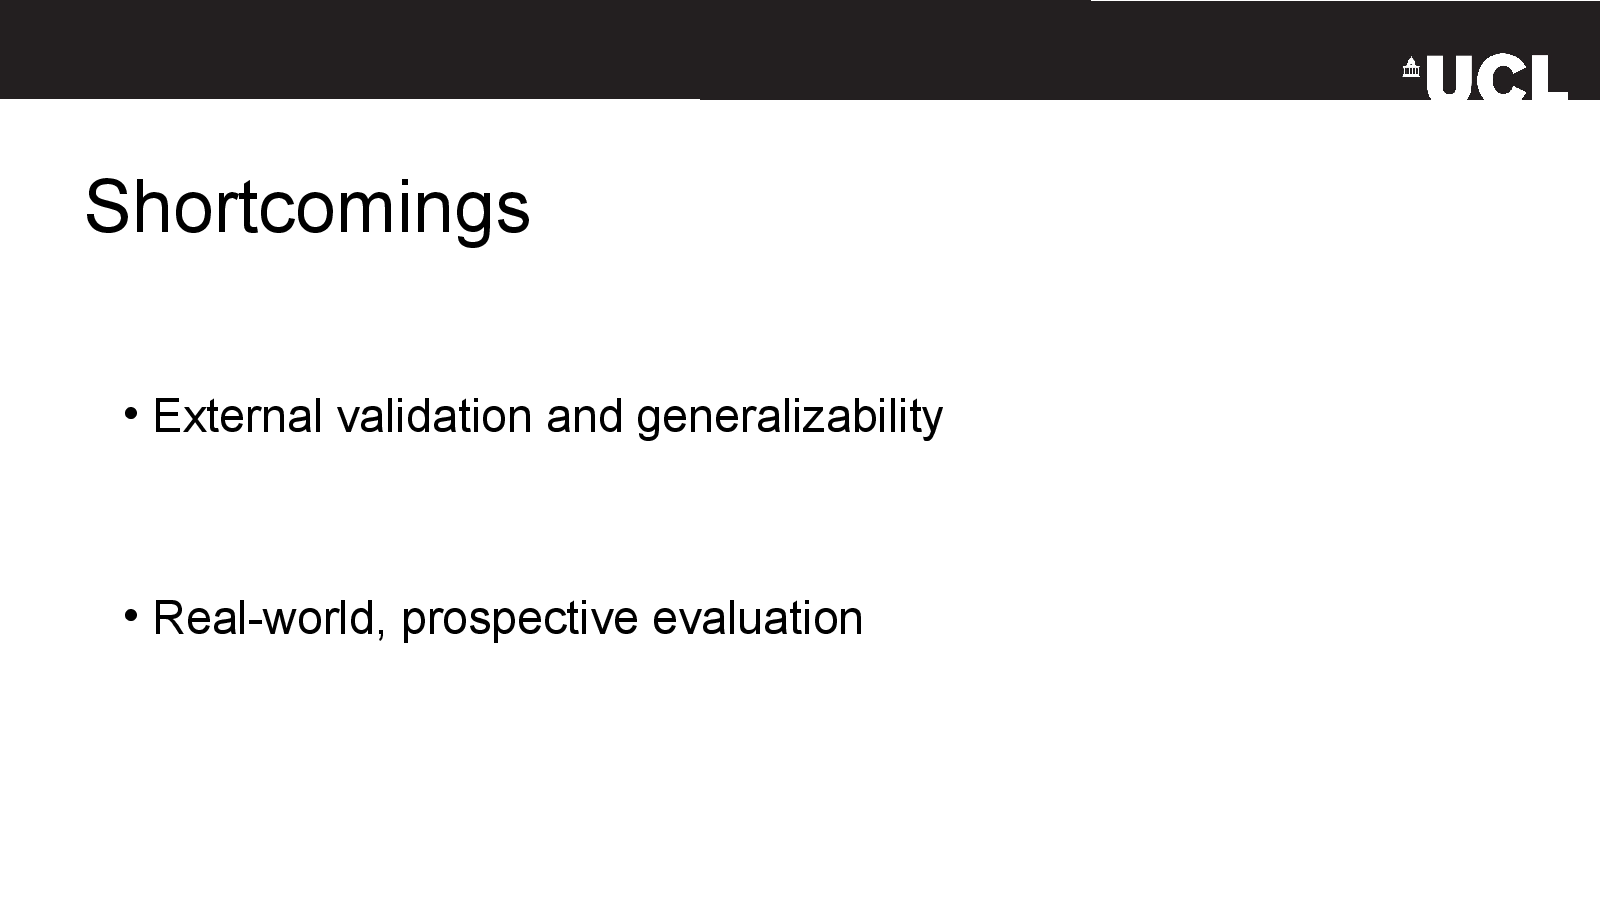
Shortcomings
Slide 22
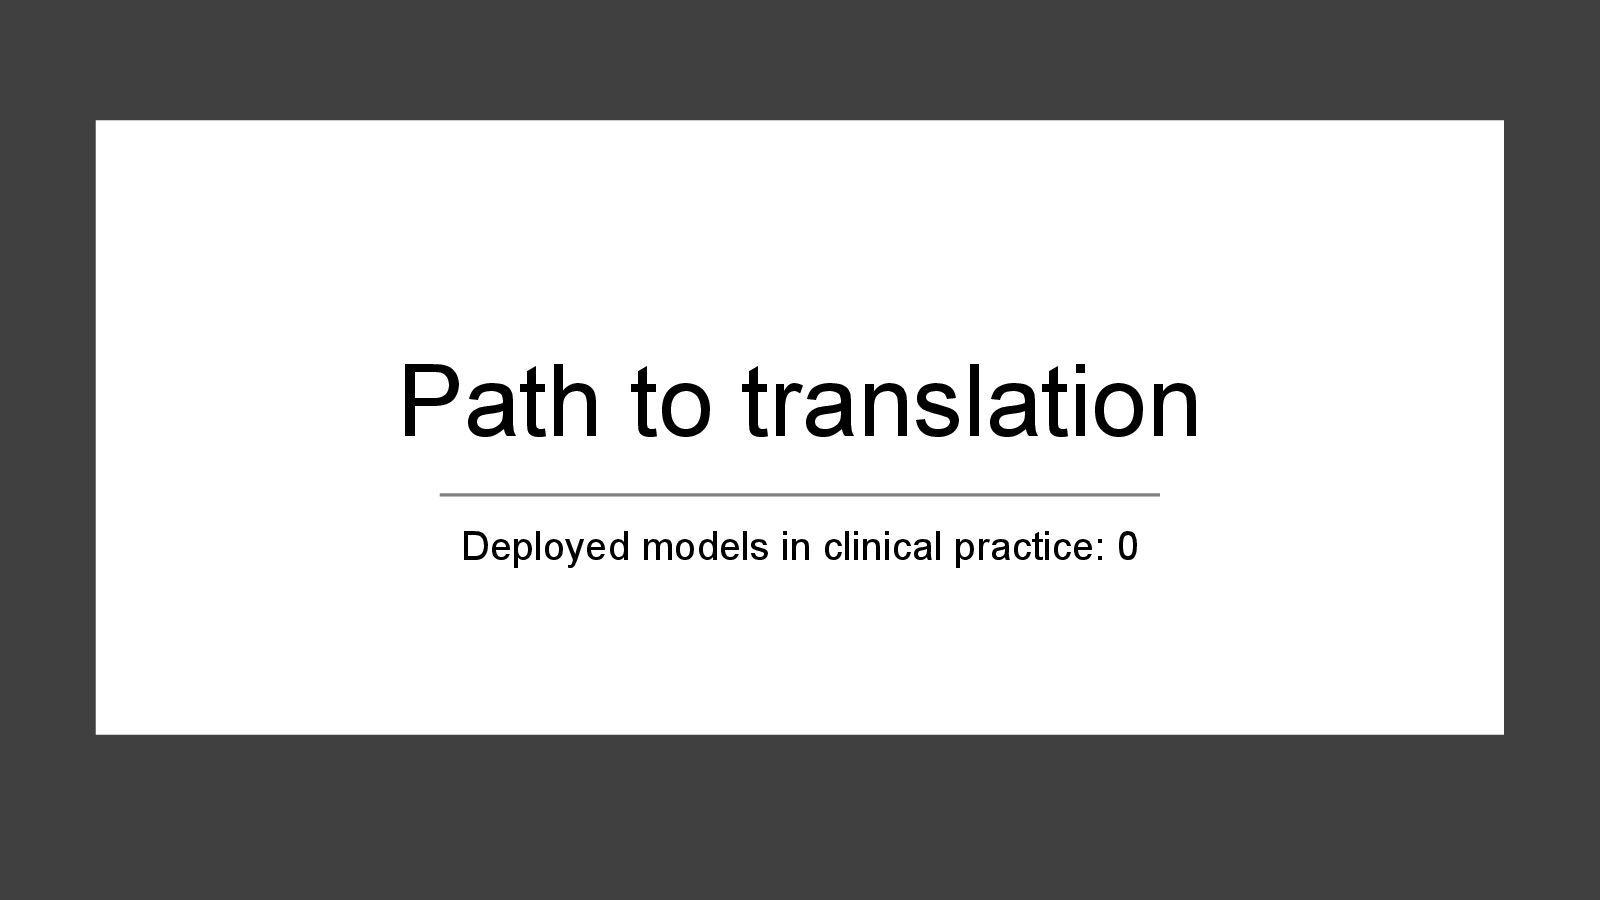
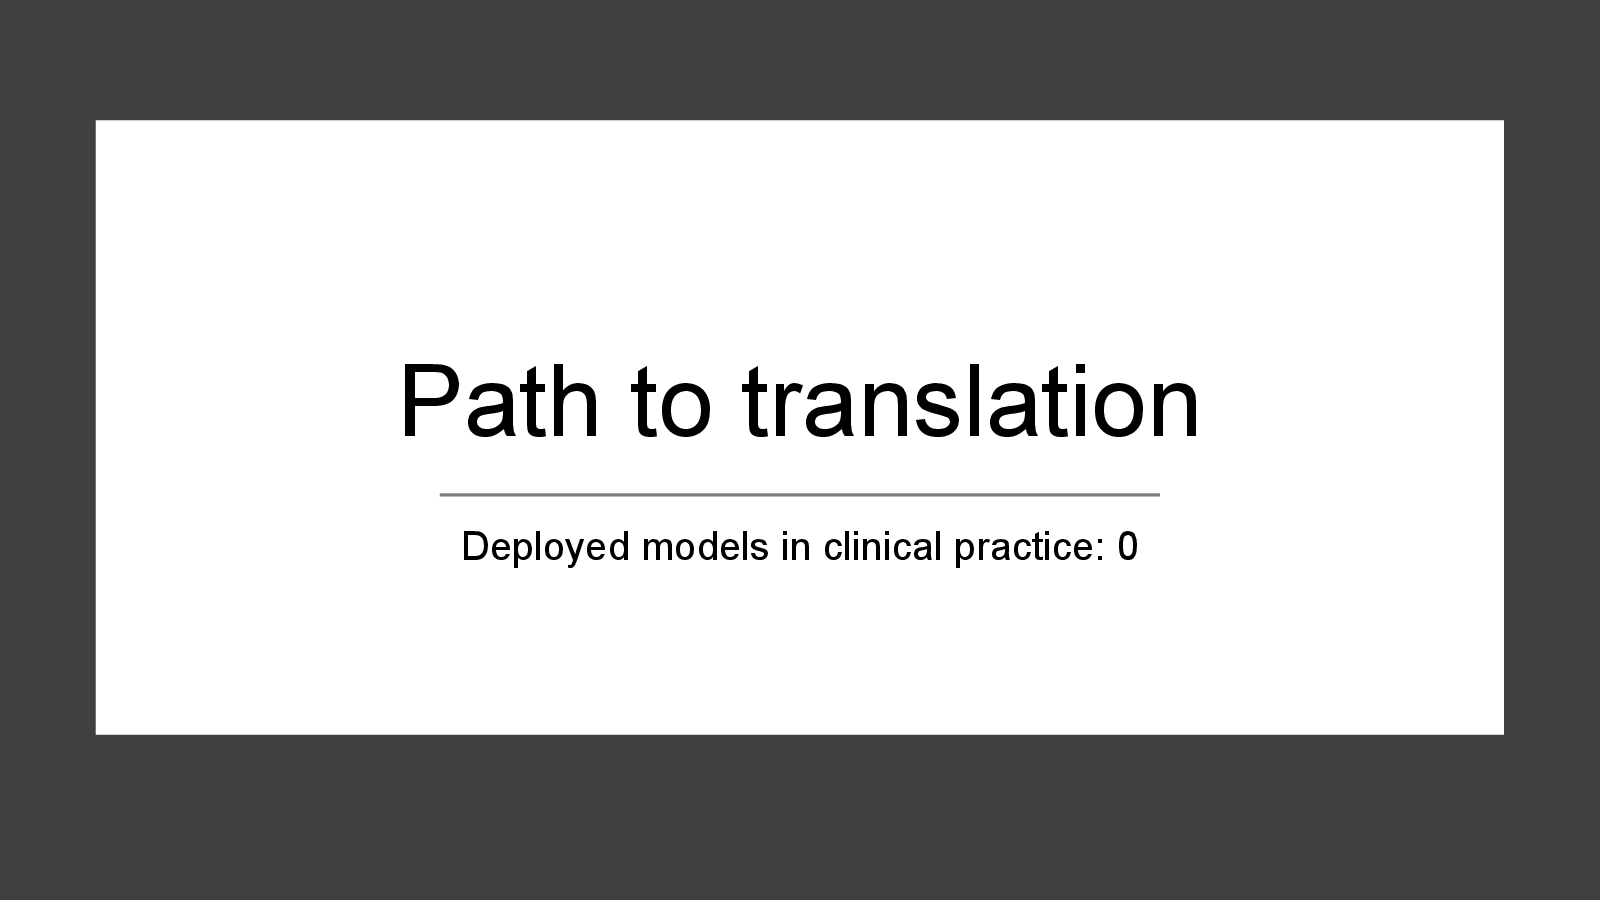
Path to translation
Slide 23
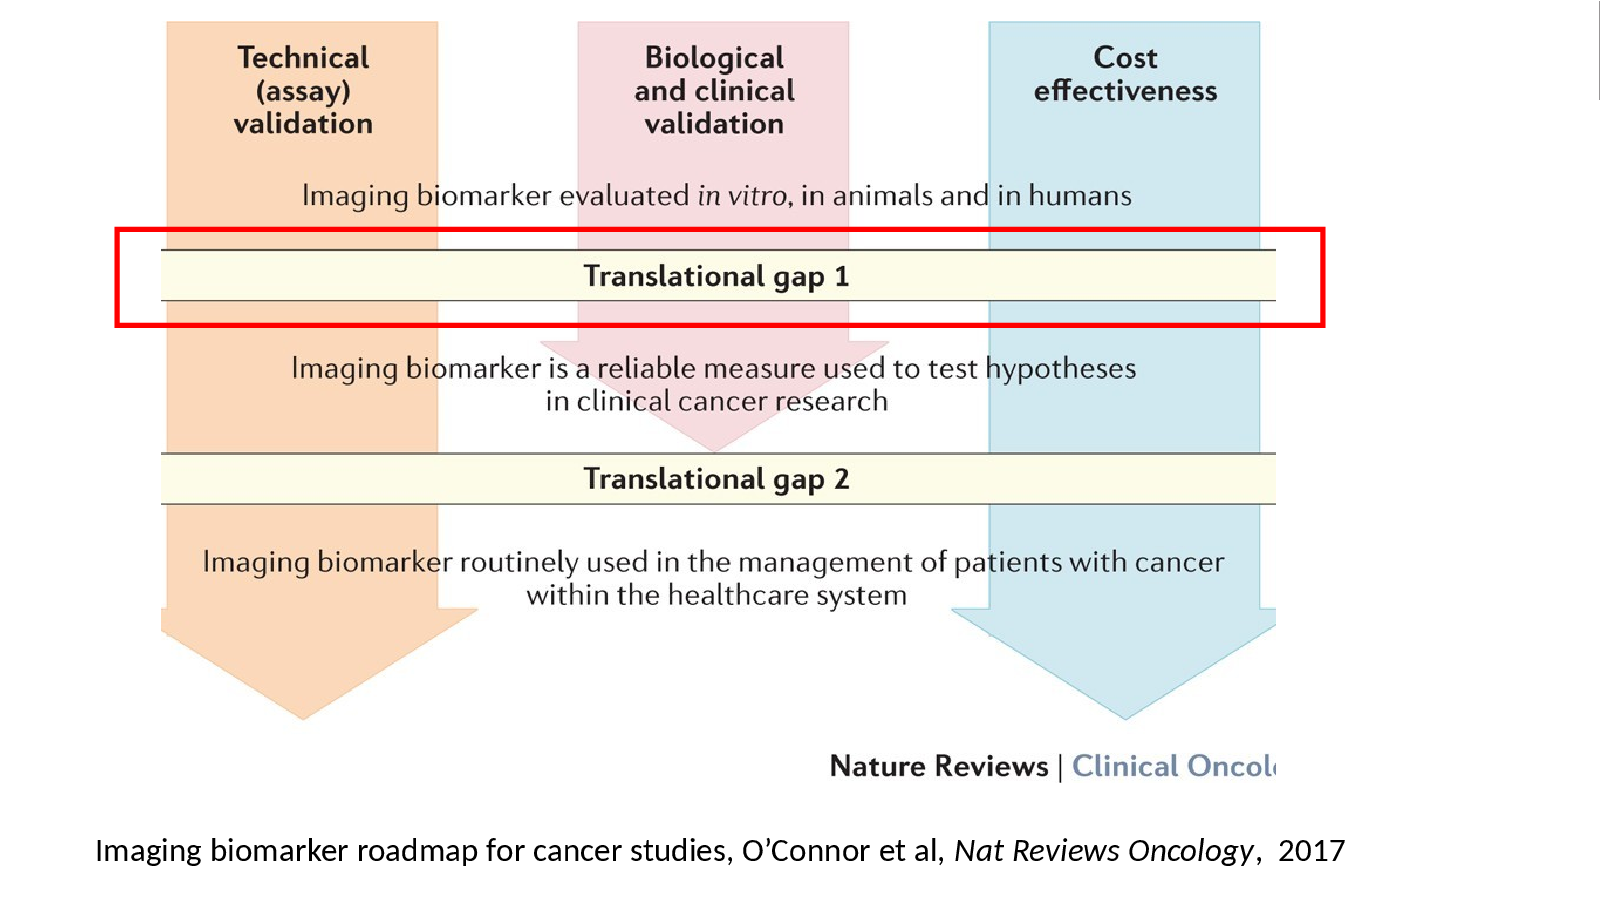
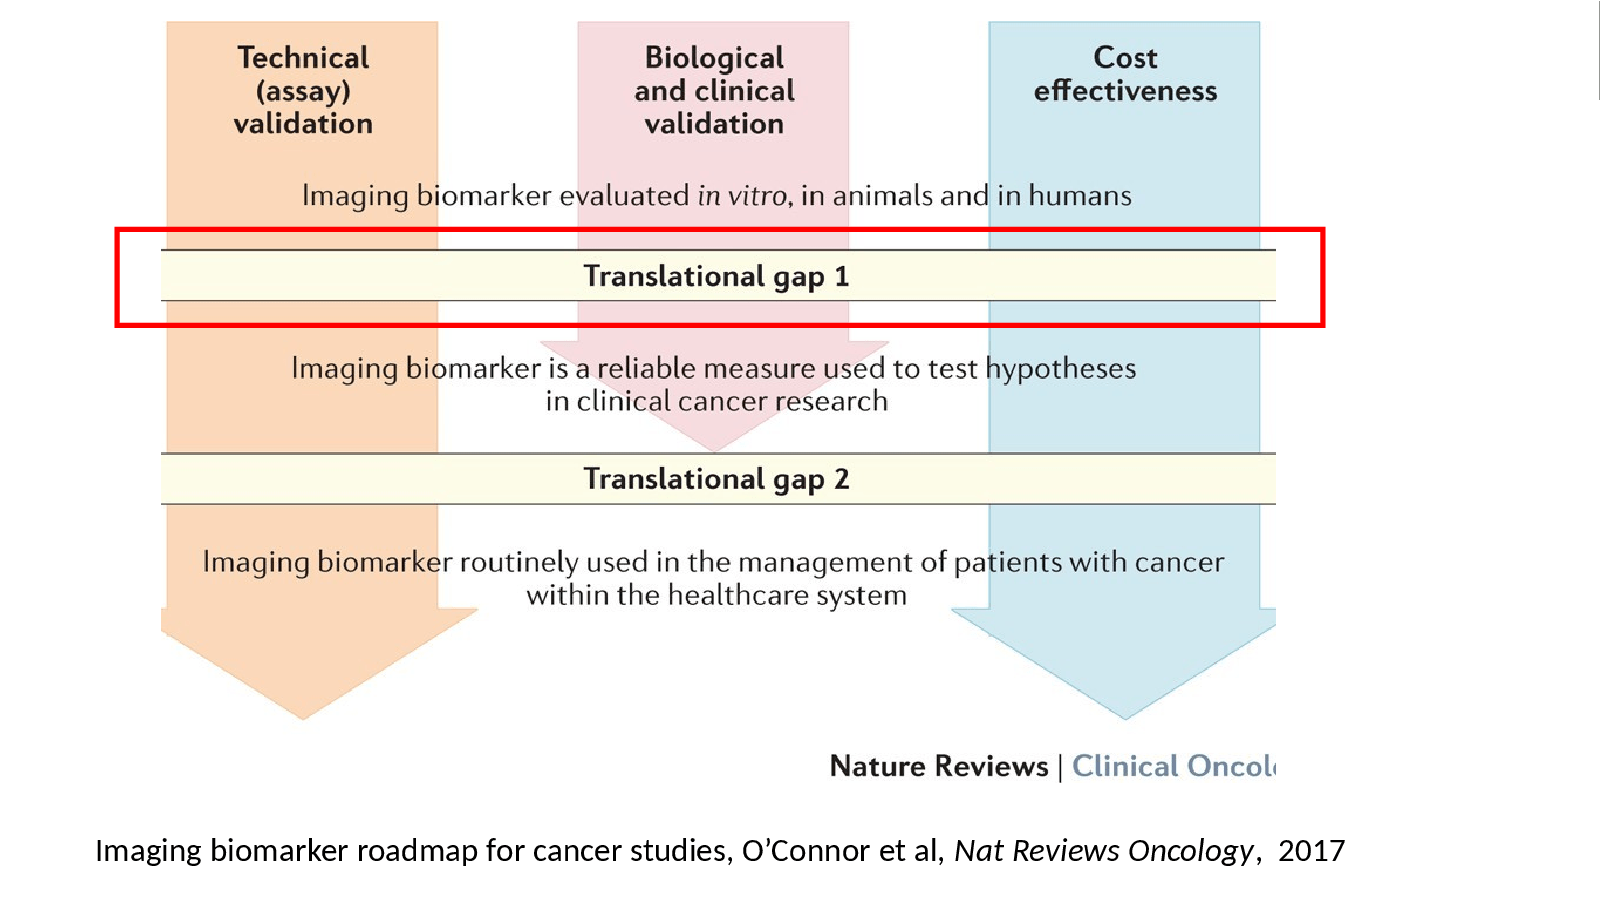
Imaging biomarker roadmap for cancer studies, O’Connor et al, Nat Reviews Oncology, 2017
Slide 24
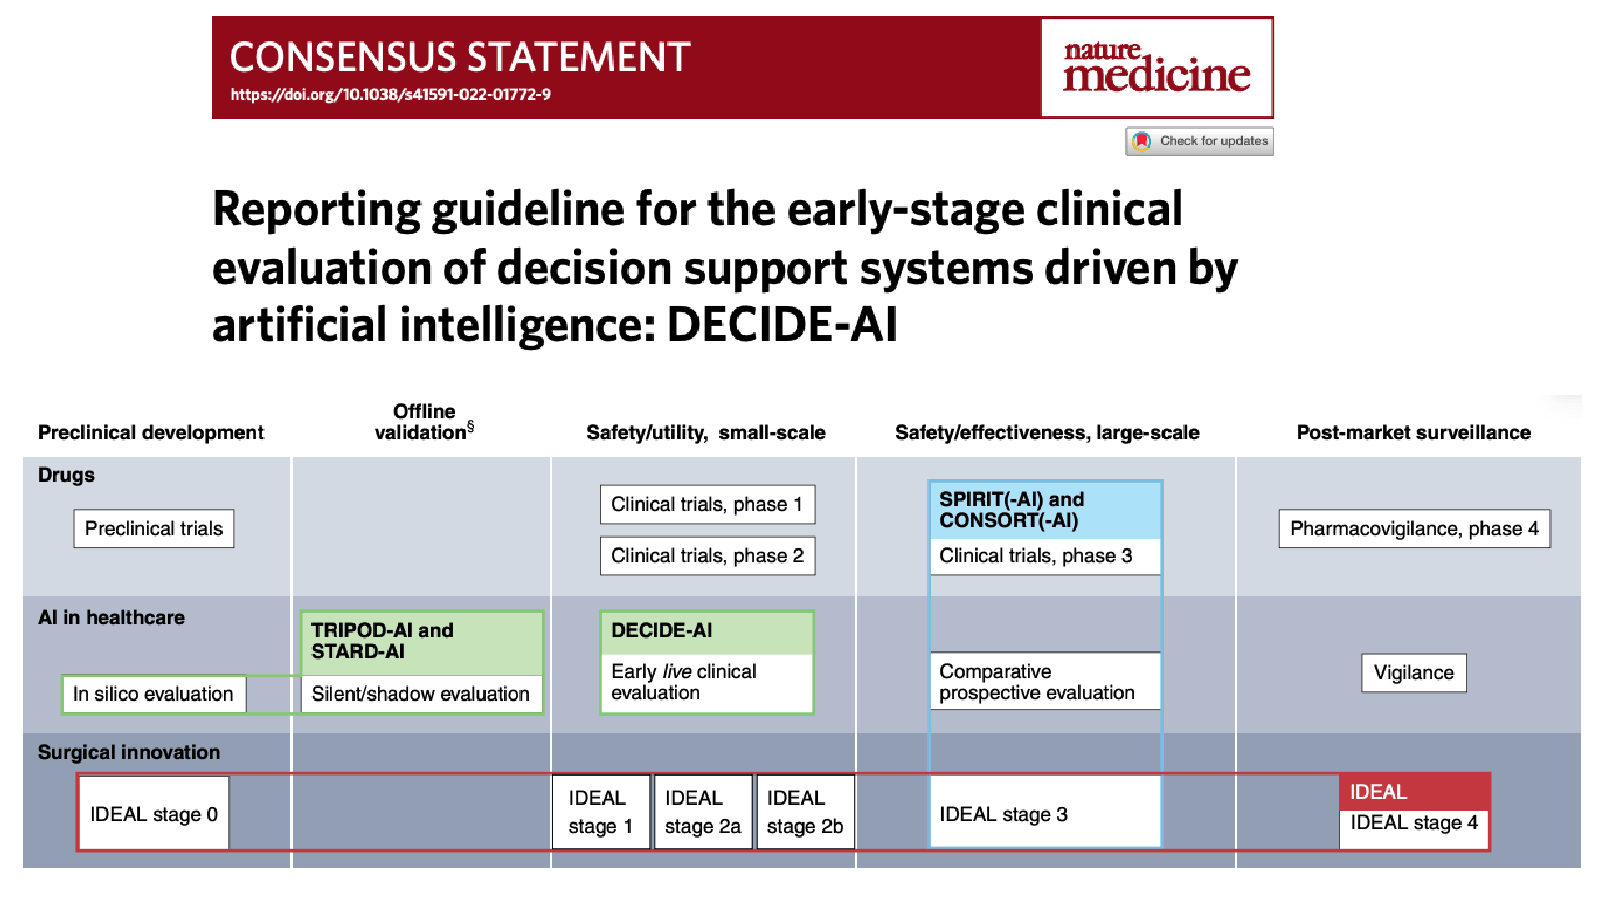
Vasey et al, Nature Medicine, 2022

Slide 25
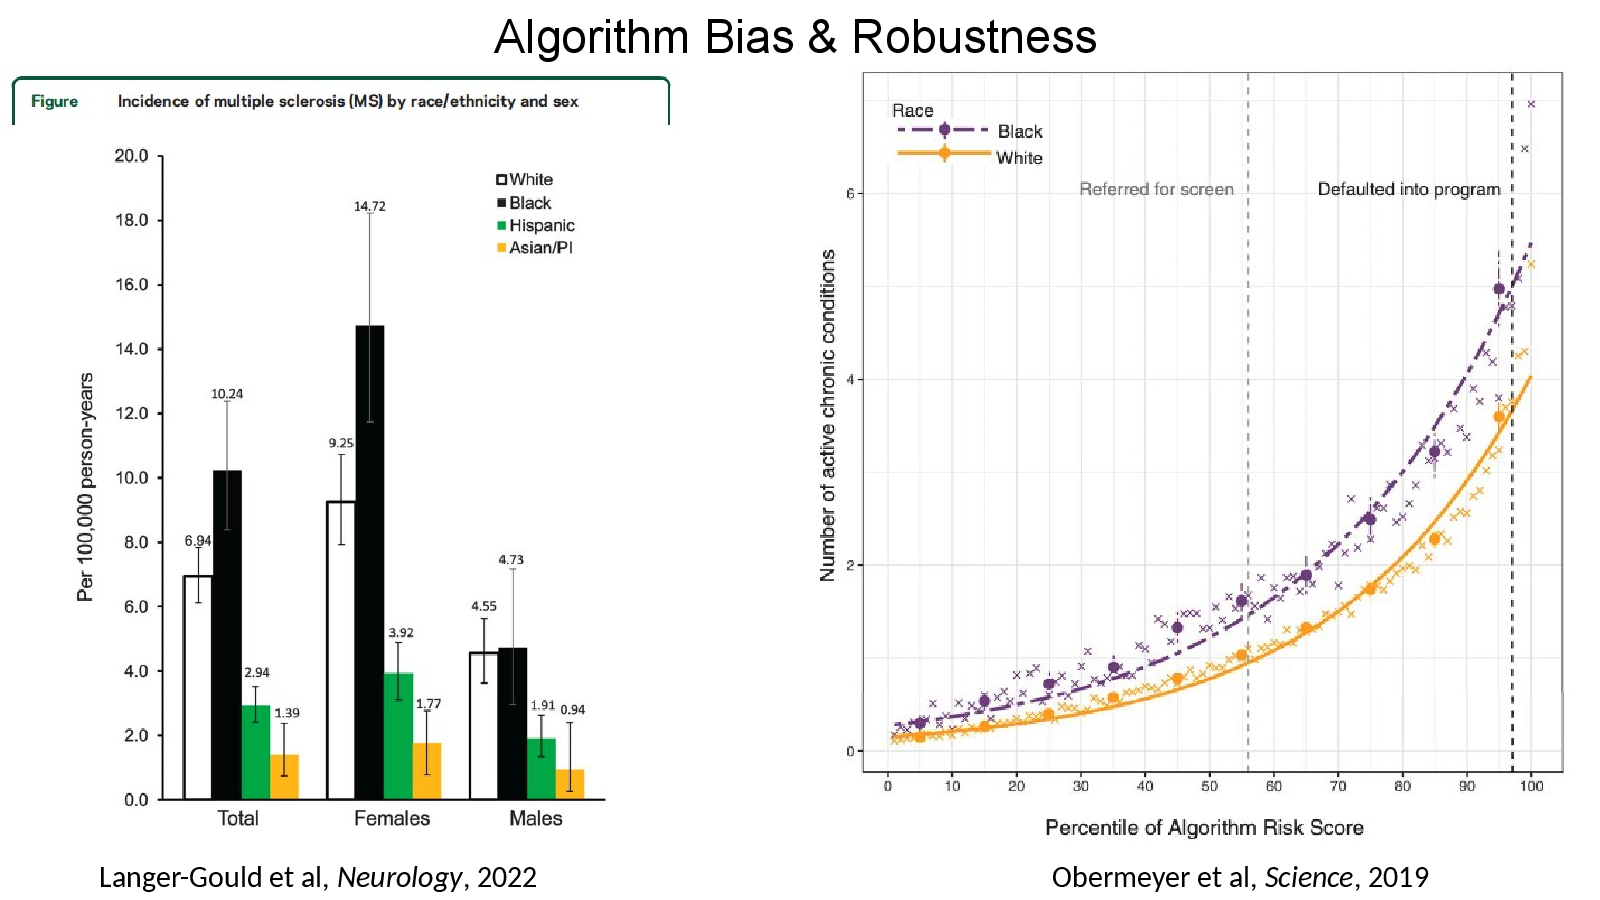
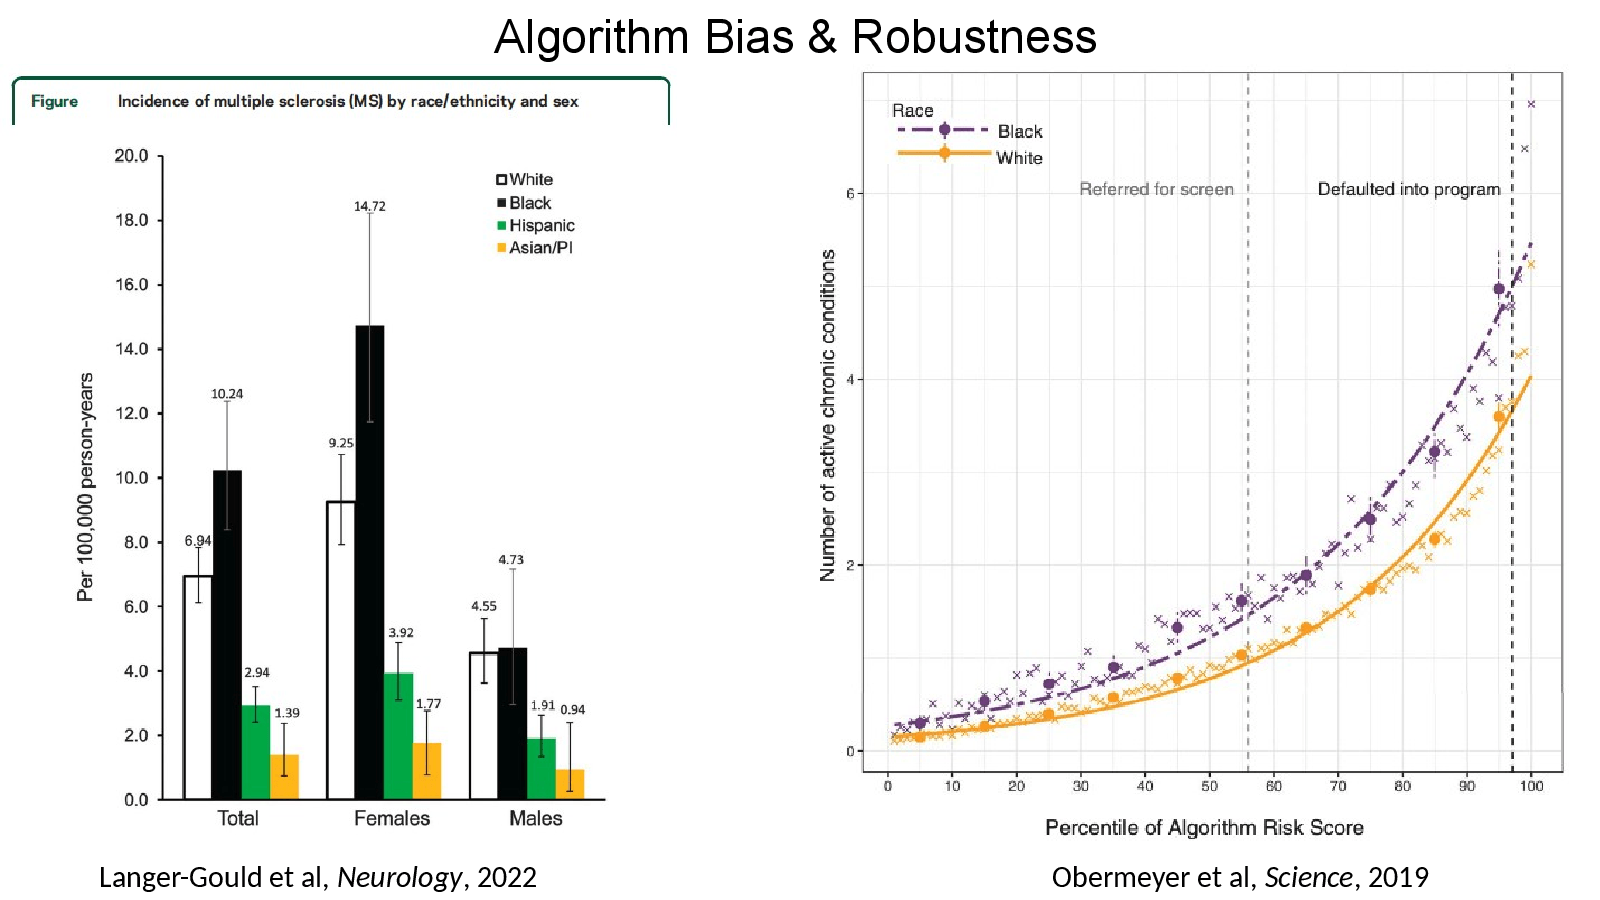
Langer-Gould et al, Neurology, 2022
Slide 26
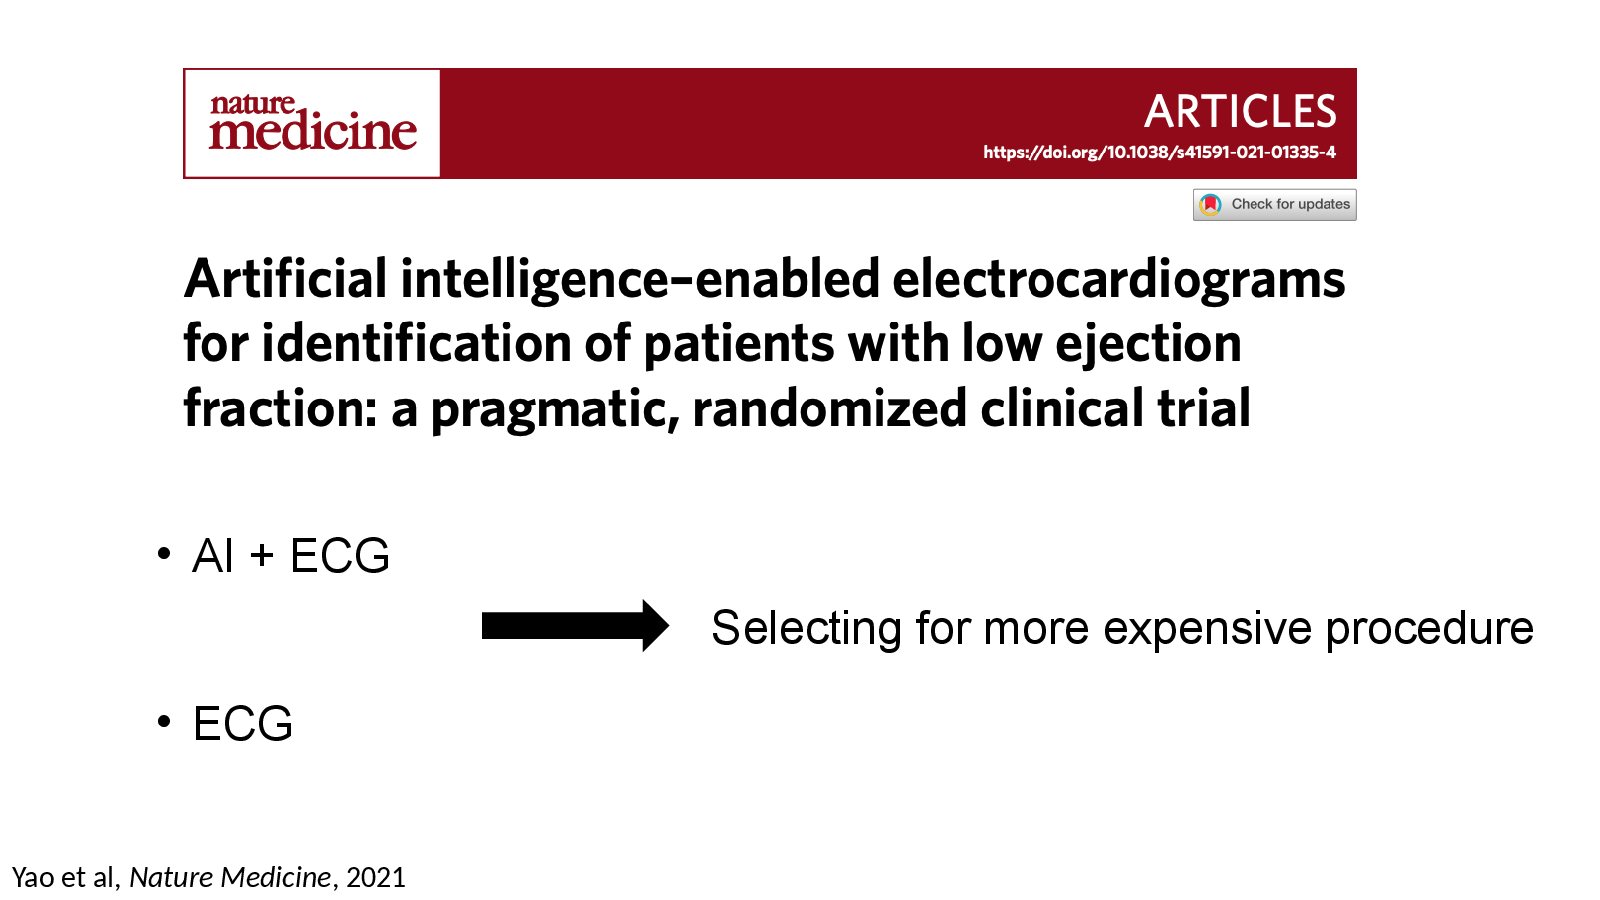
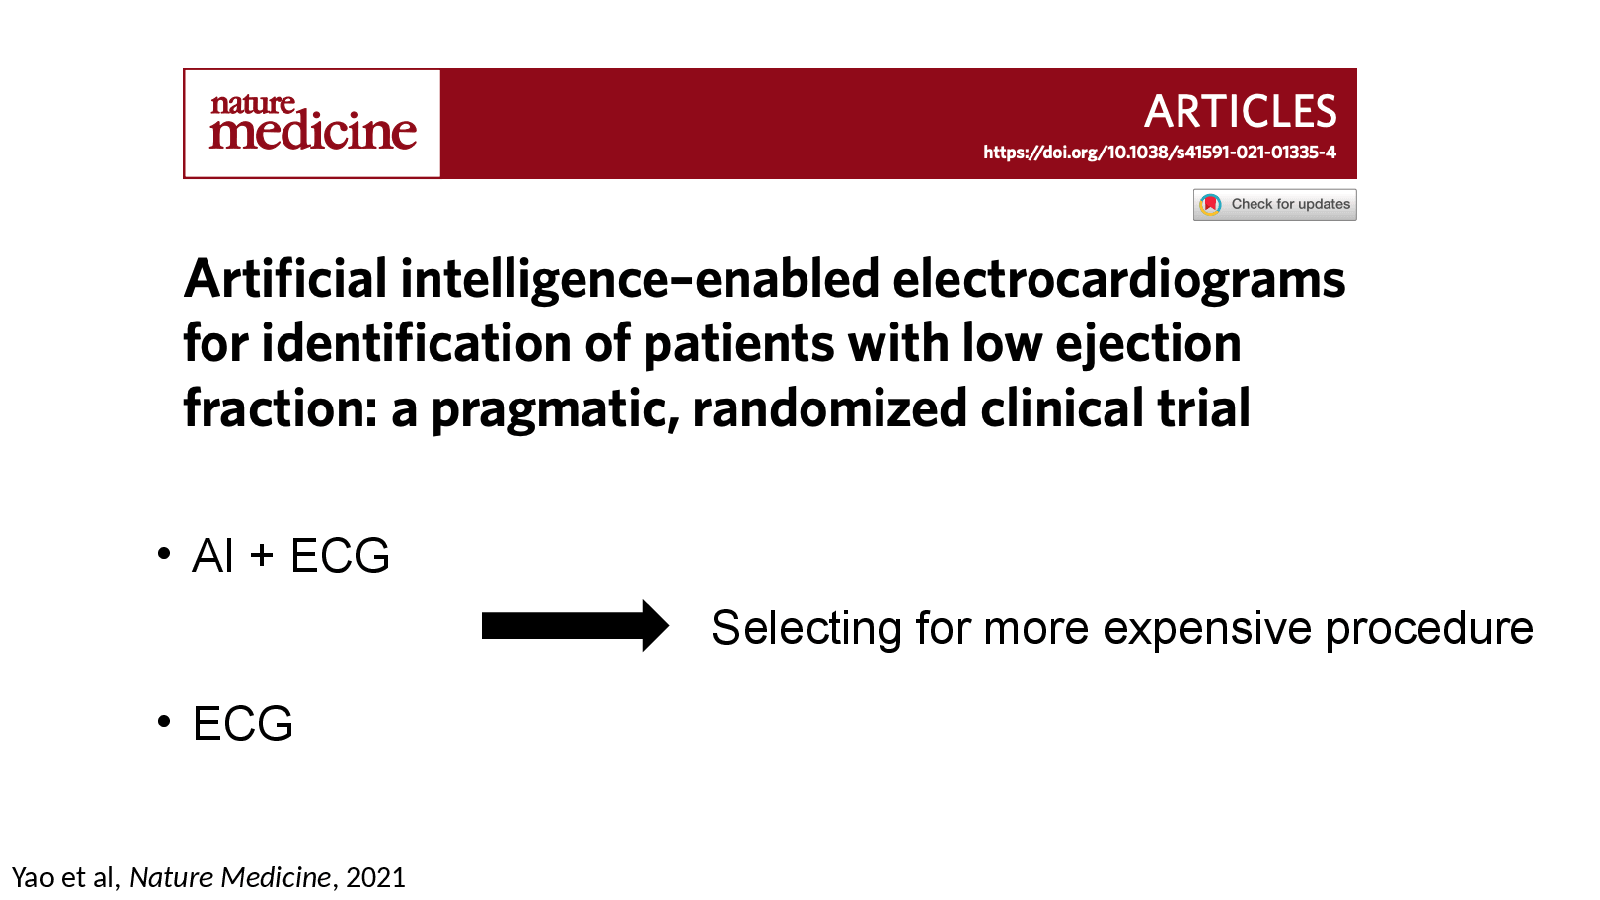
Yao et al, Nature Medicine, 2021
Slide 27
Future perspectives

Slide 28
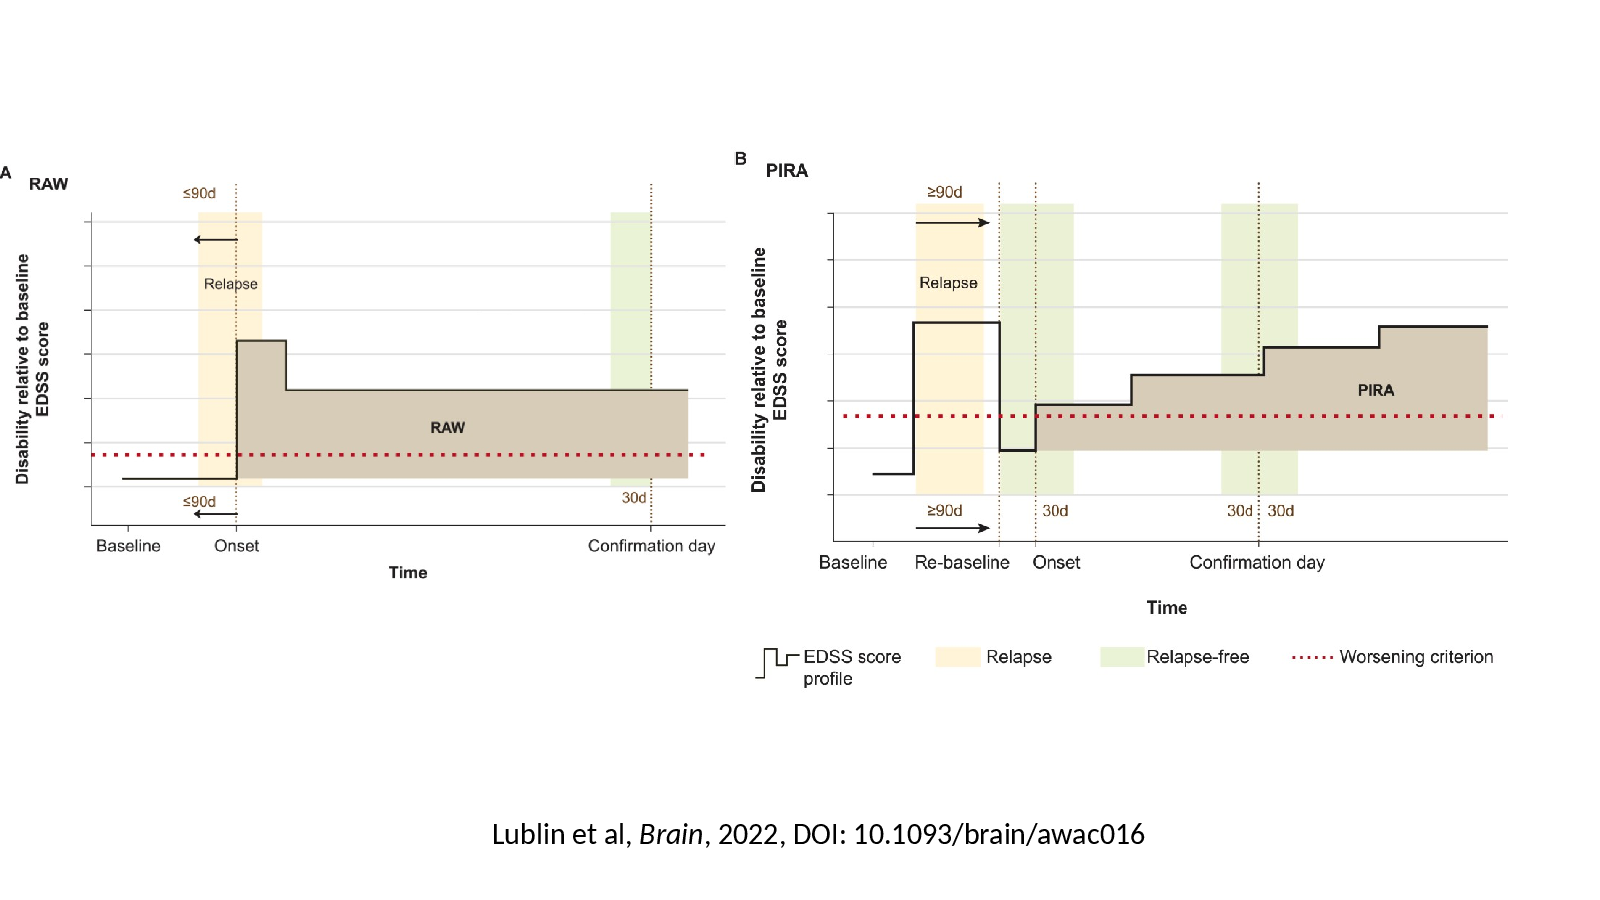
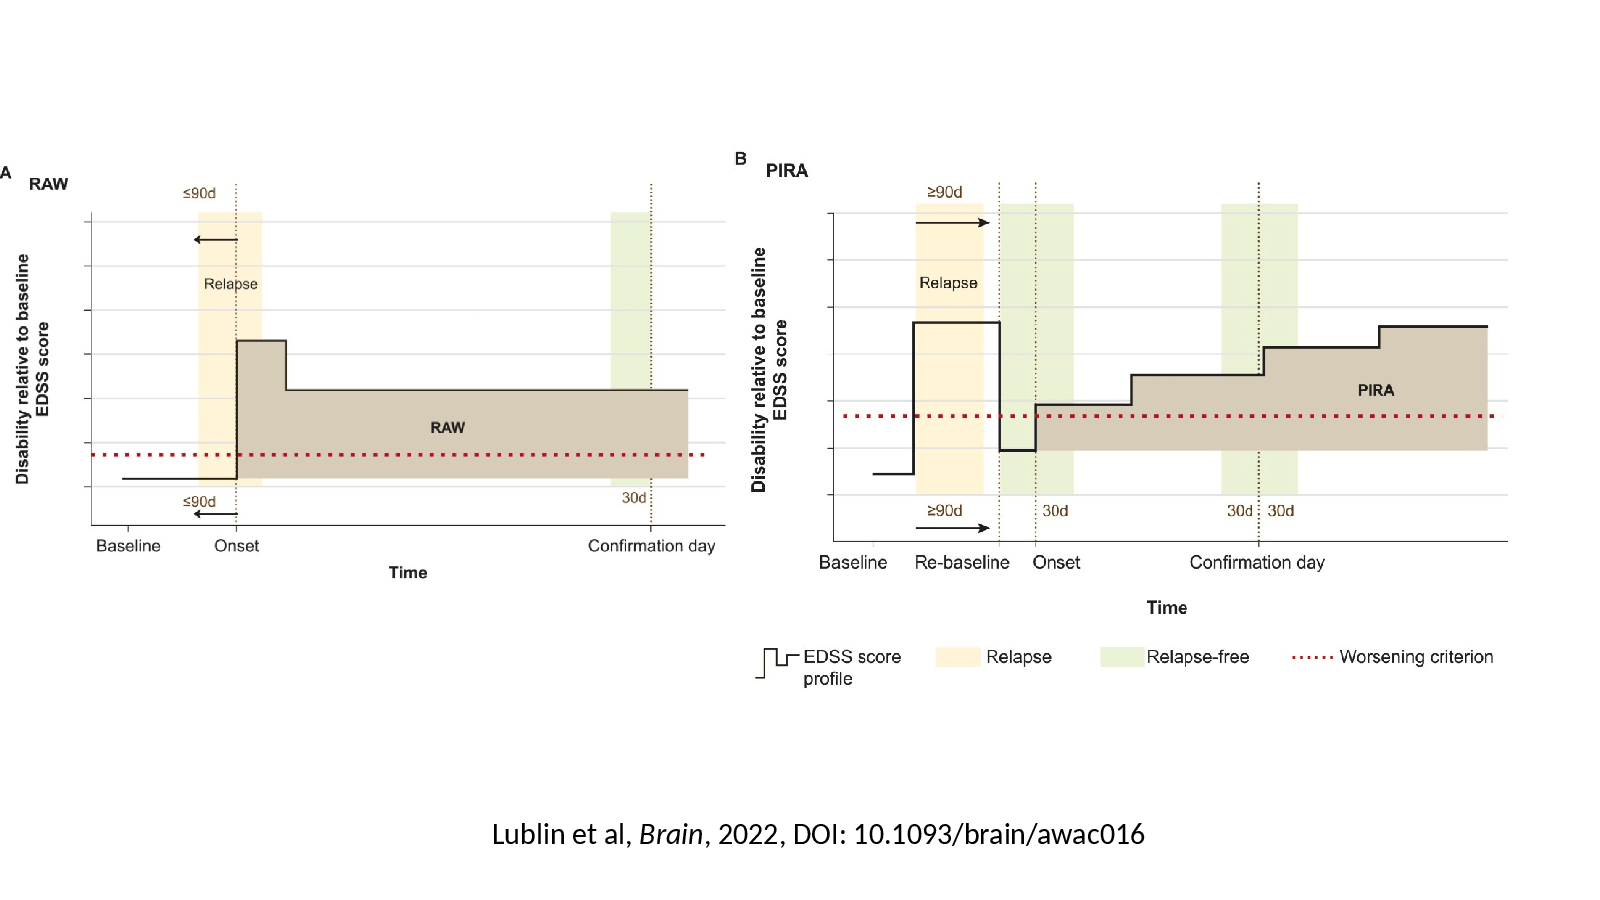
Lublin et al, Brain, 2022, DOI: 10.1093/brain/awac016
Slide 29
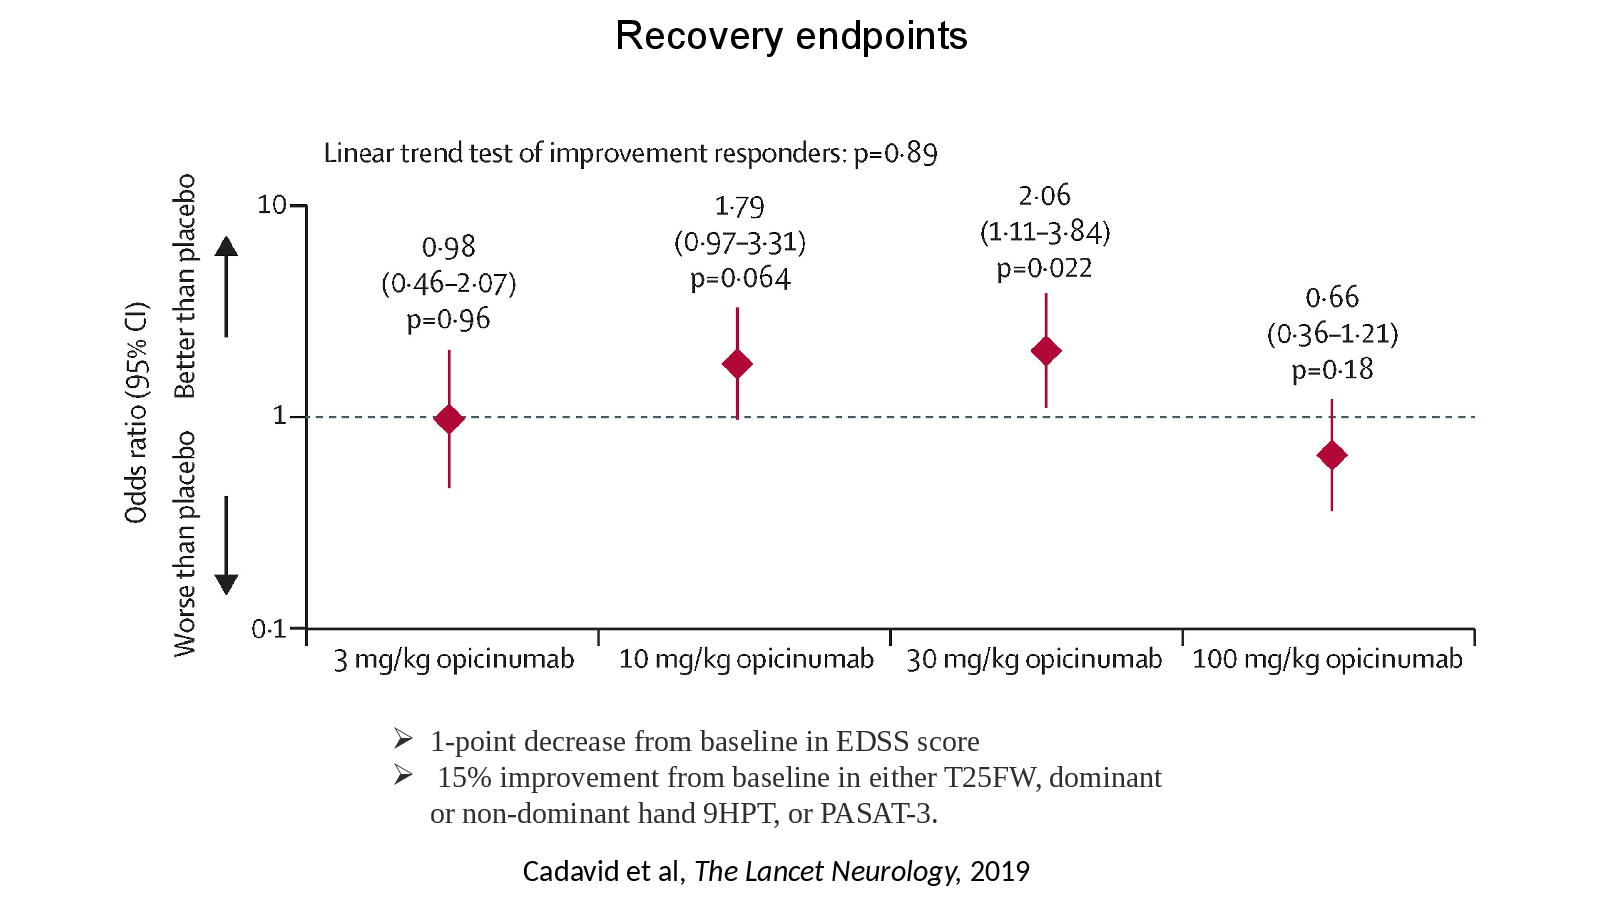
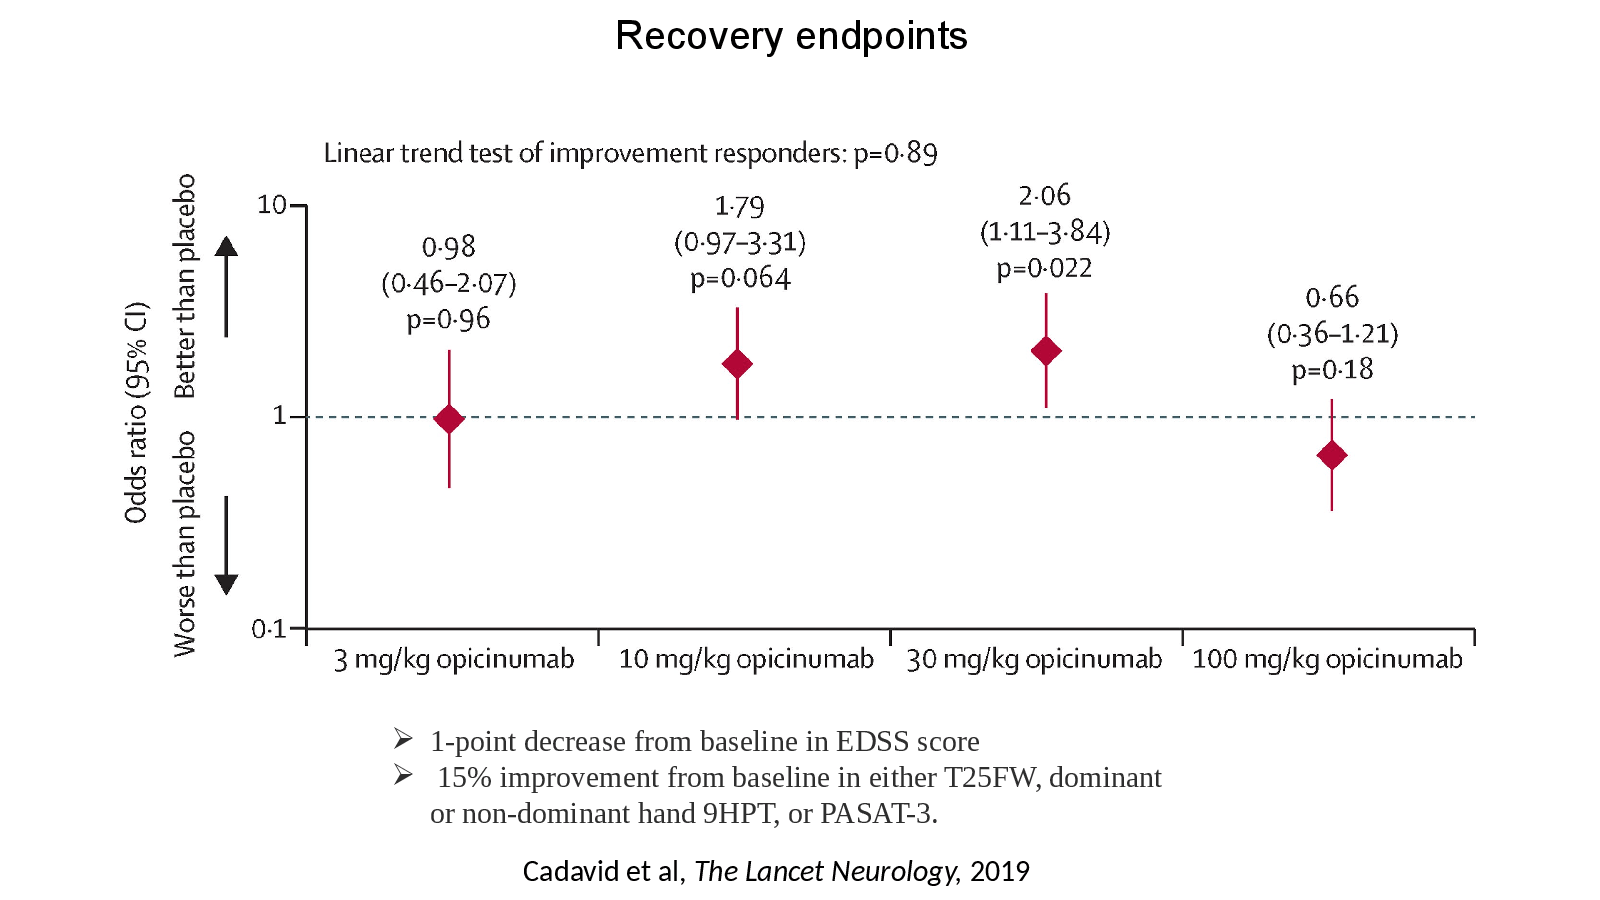
Cadavid et al, The Lancet Neurology, 2019
Slide 30
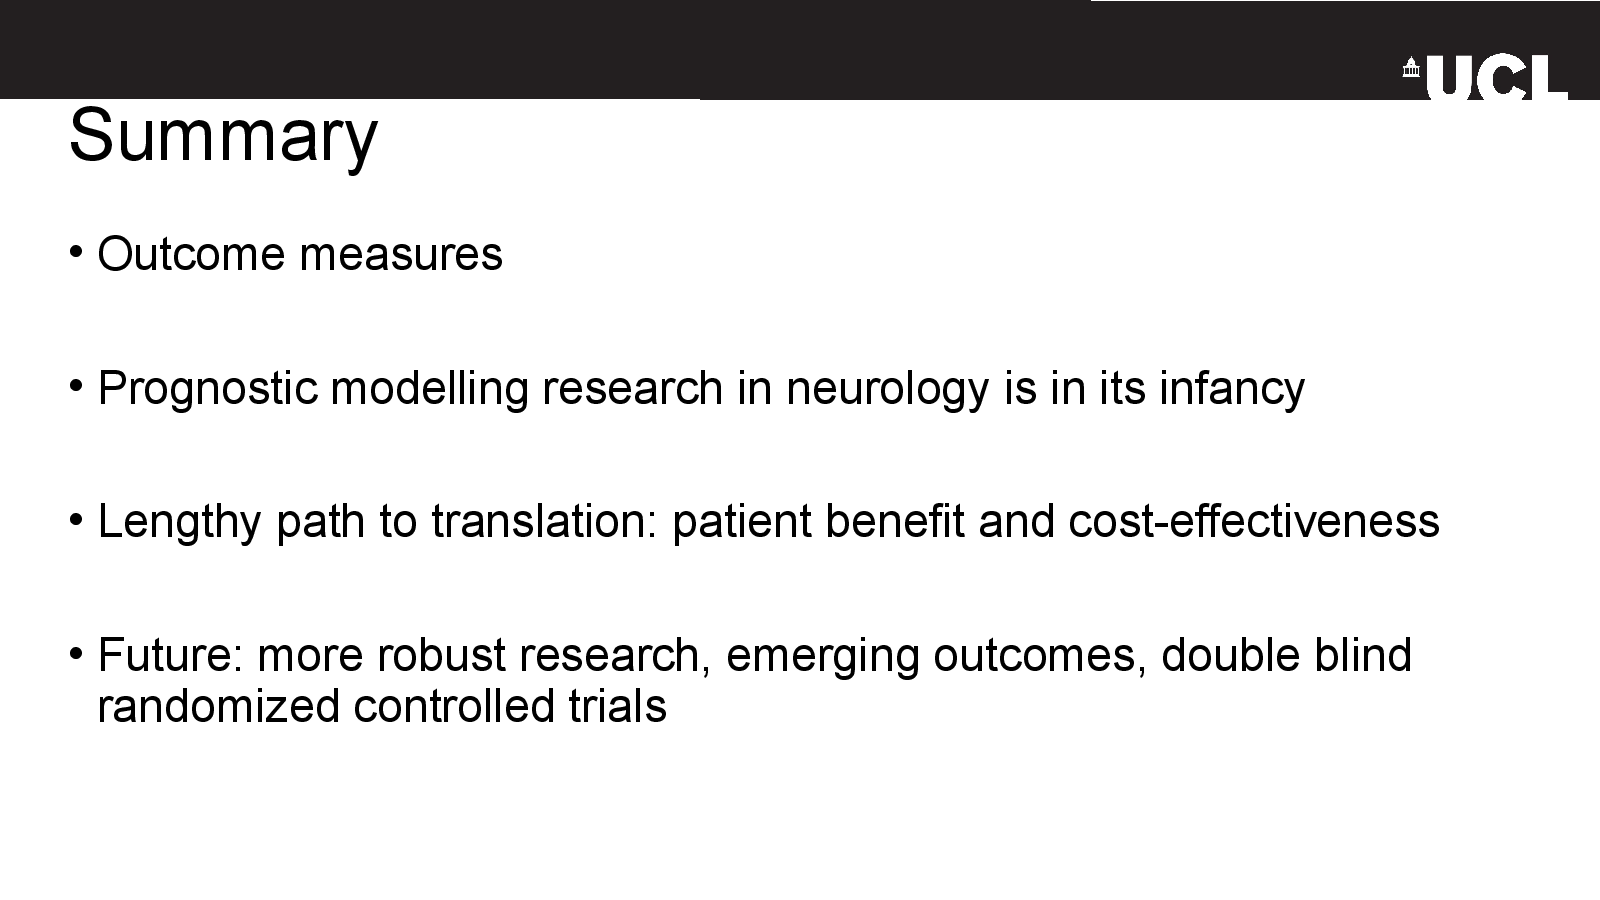
Summary
Slide 31
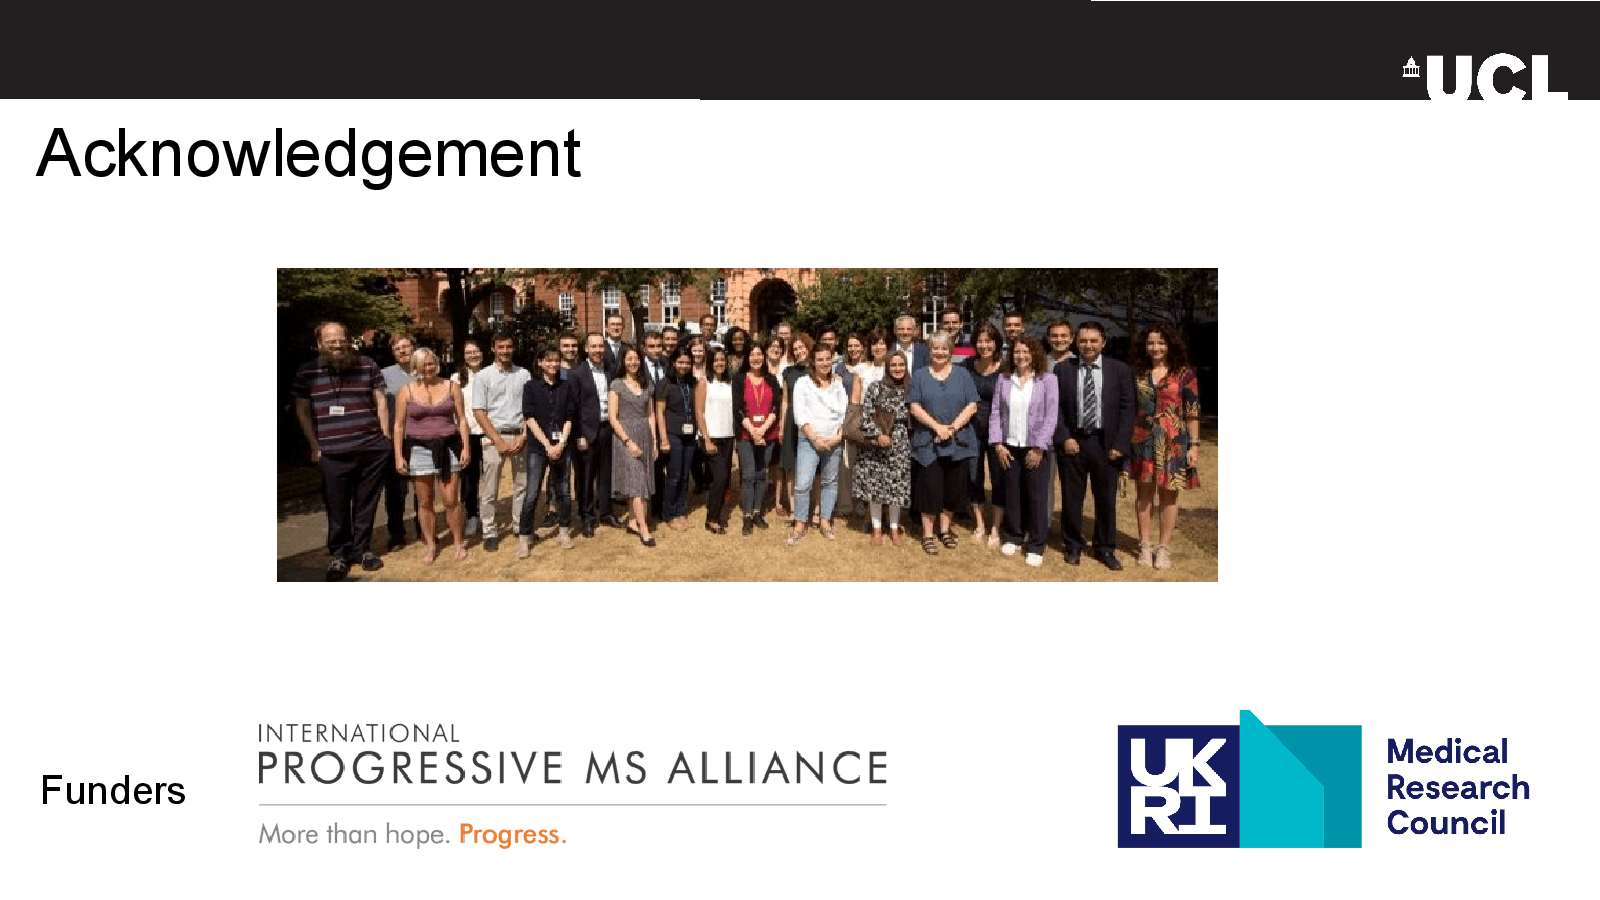
Acknowledgement