All talks & lectures

Conference ·

Clinical prediction using complex models
A measured look at where complex models can improve multiple sclerosis prediction and where complexity can obscure understanding.

ECTRIMS 2022

A web sketch of the deck’s central idea
Delivered
Event
ECTRIMS 2022
Format
Conference
Source deck
23 slides

From the slides

Deck notes

This ECTRIMS talk considered the role of complex models in clinical prediction. It moved from simple relationships to personalised risk, MRI-derived subtypes and emerging outcomes.

The question

Where does model complexity add clinical value, and when does it make a prediction harder to understand or use?

Deck outline

  • Relationships, models and clinical questions
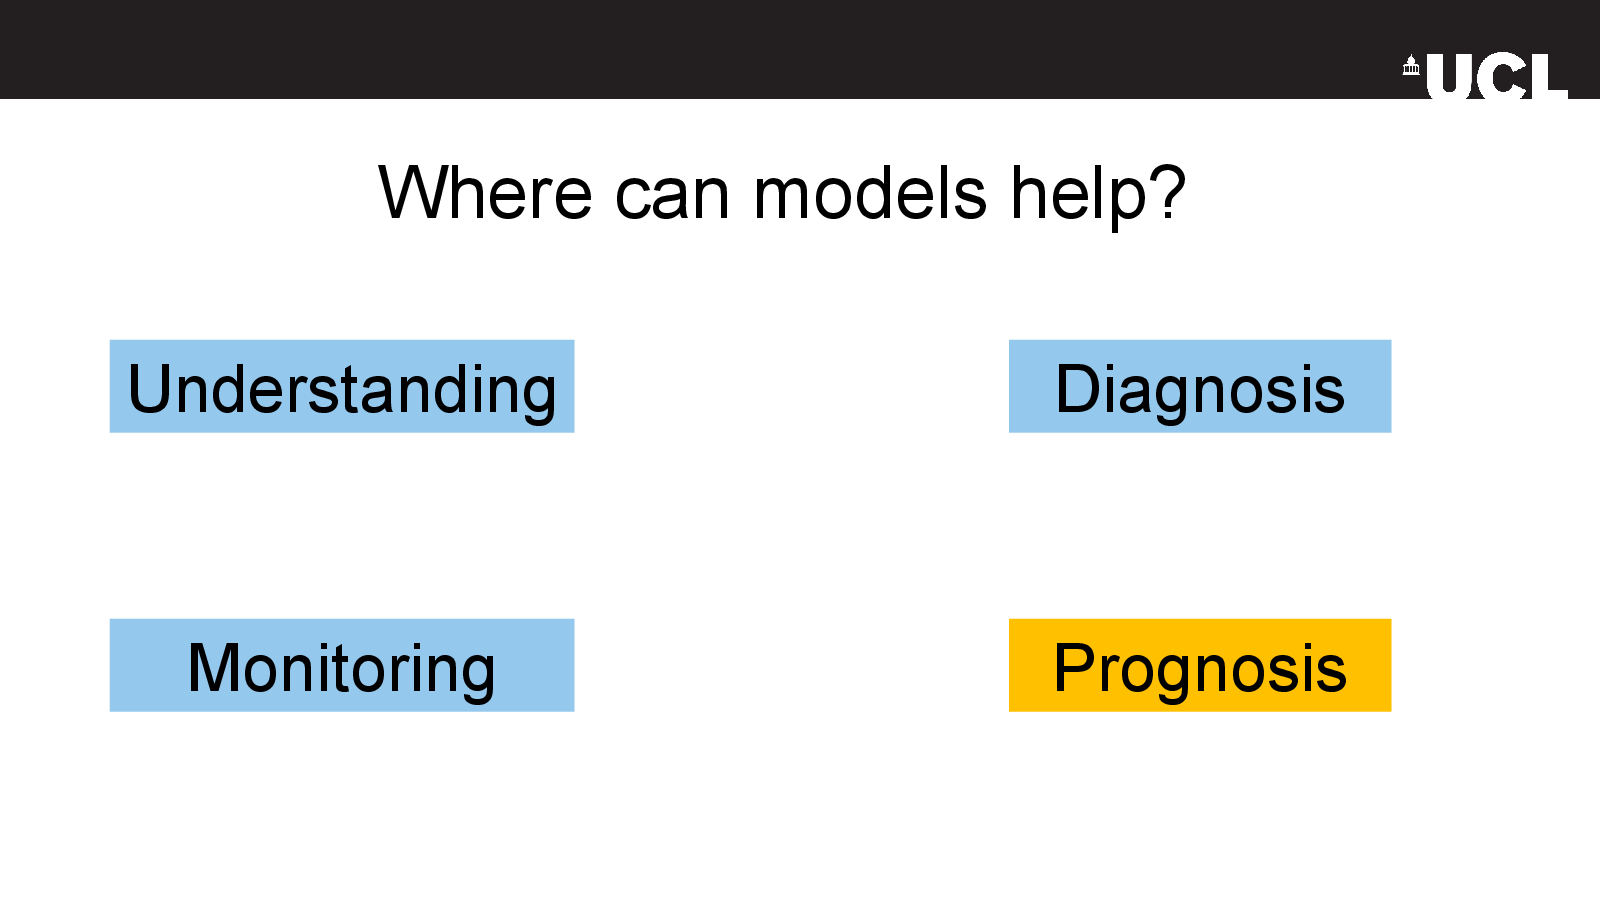
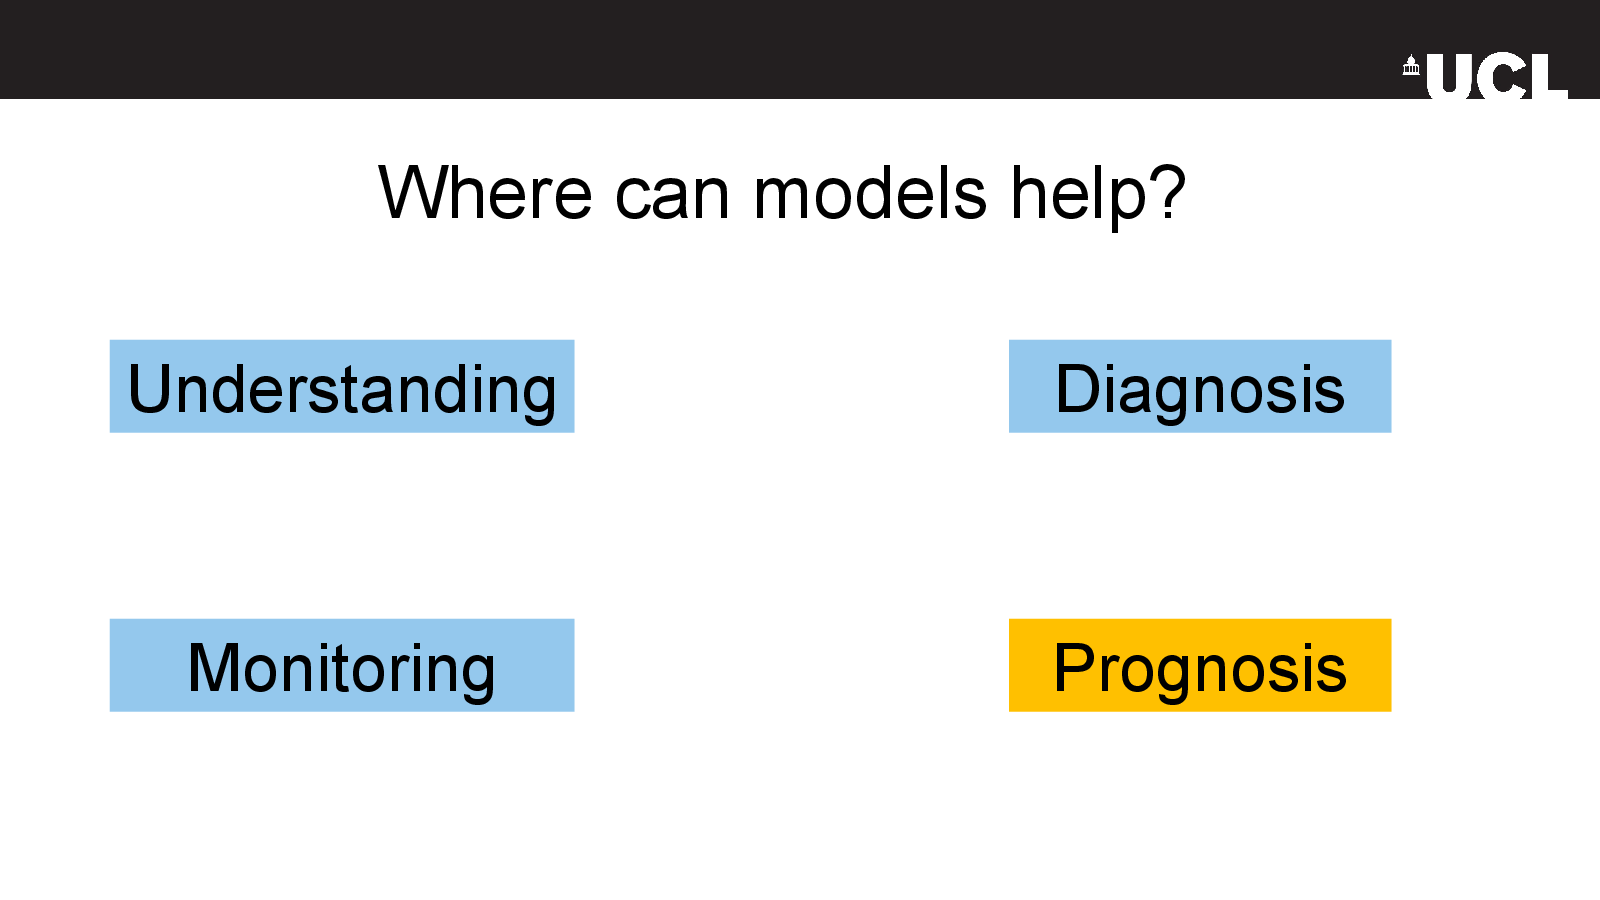
  • Where predictive models may help
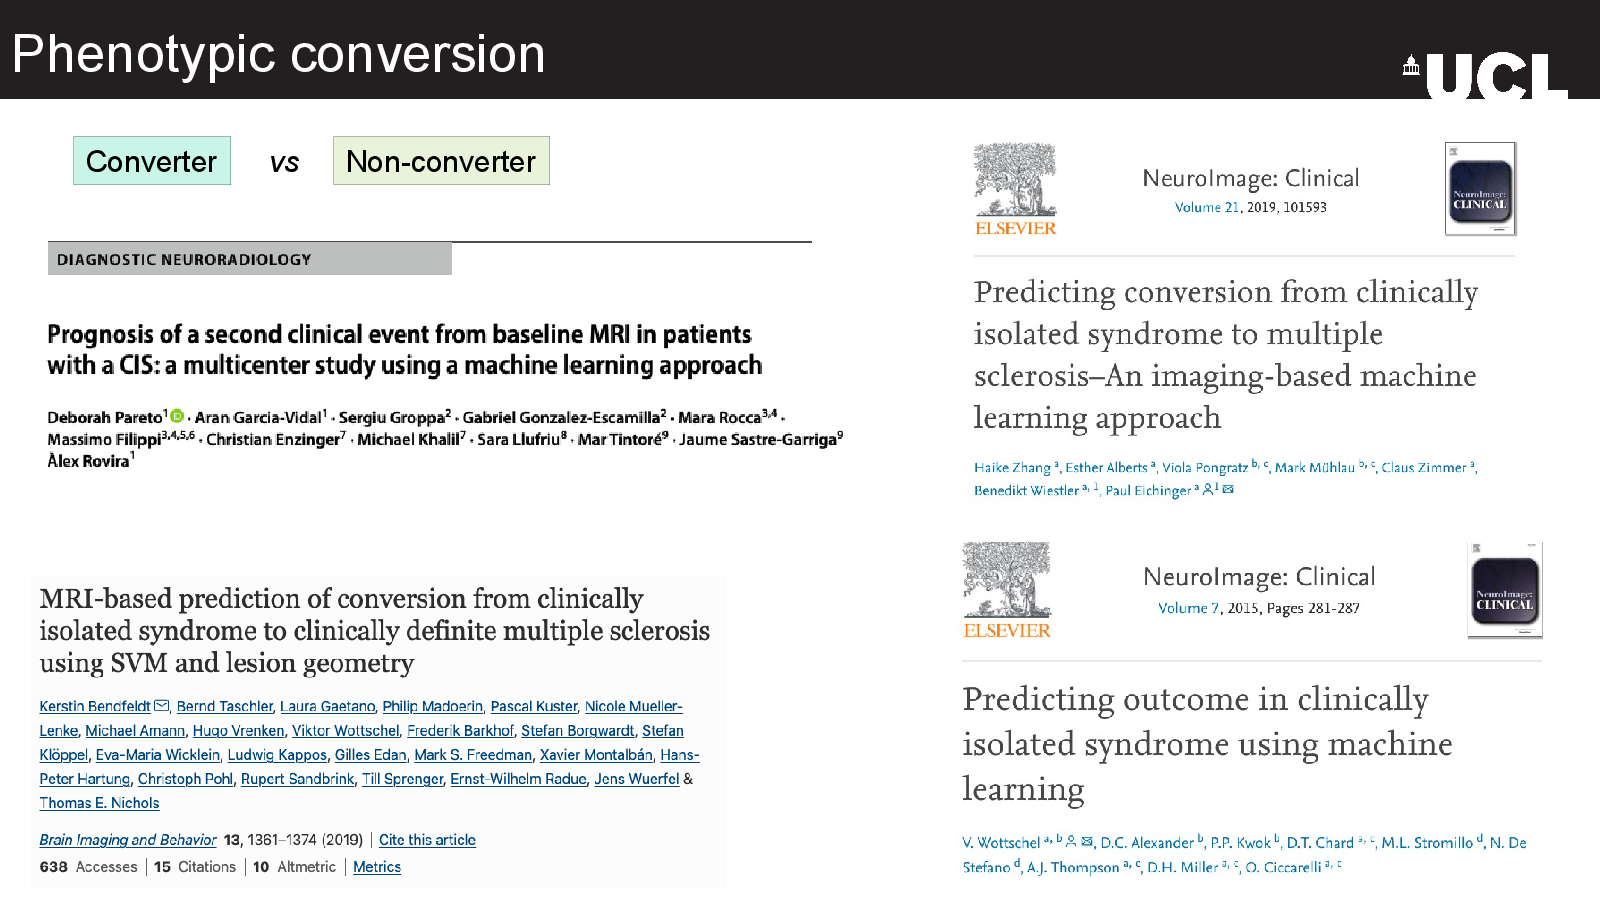
  • Disease activity and phenotypic conversion
  • Personalised disability risk
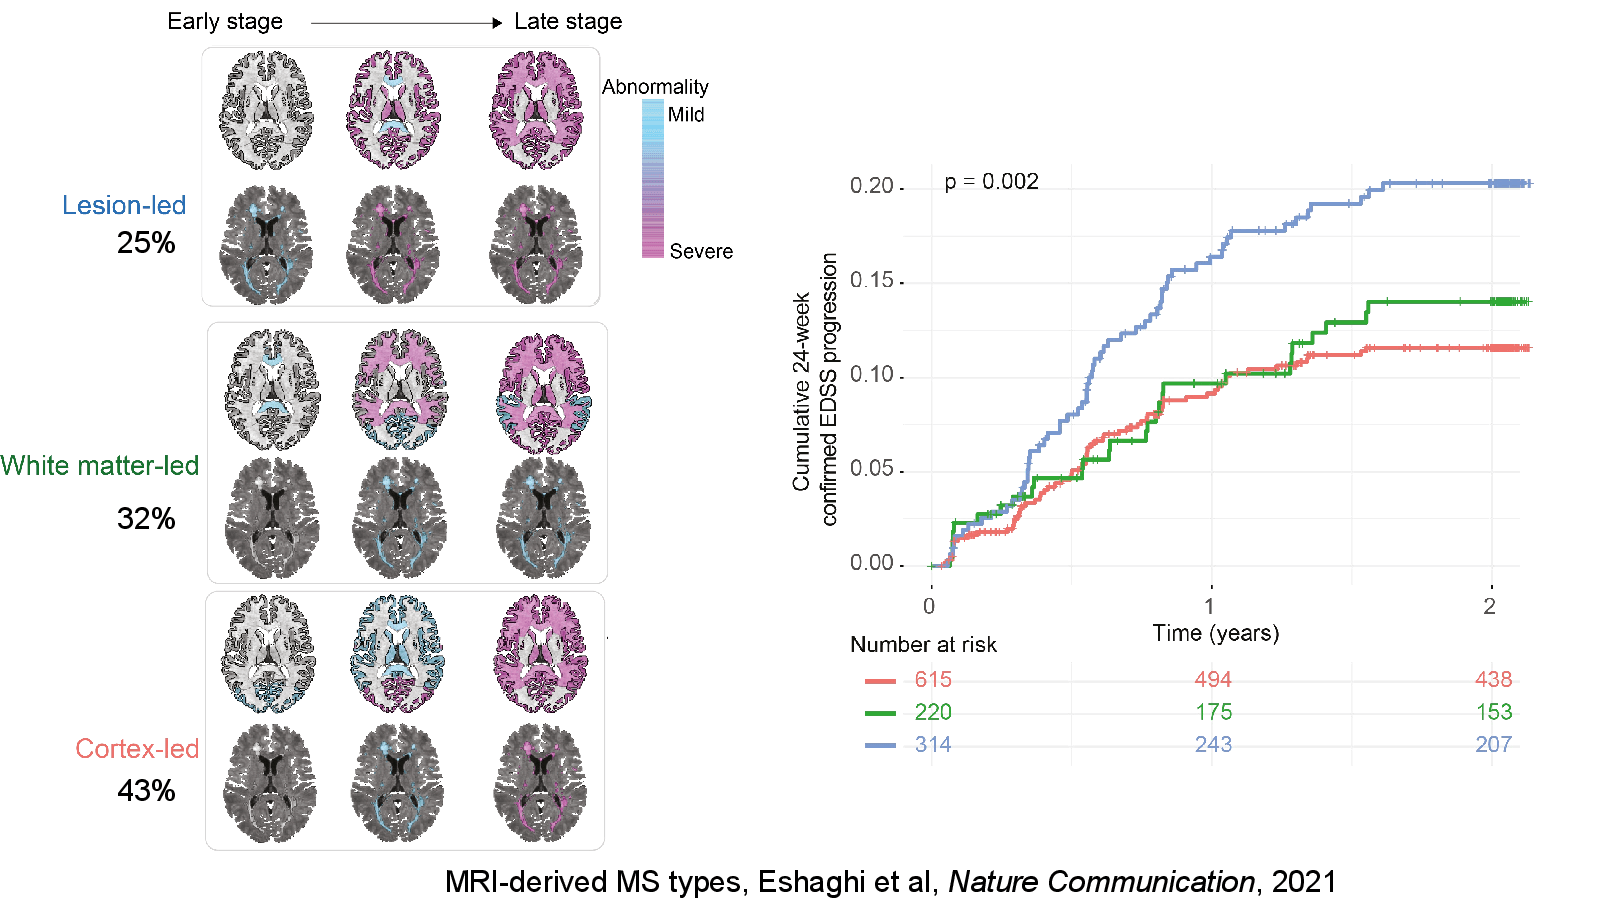
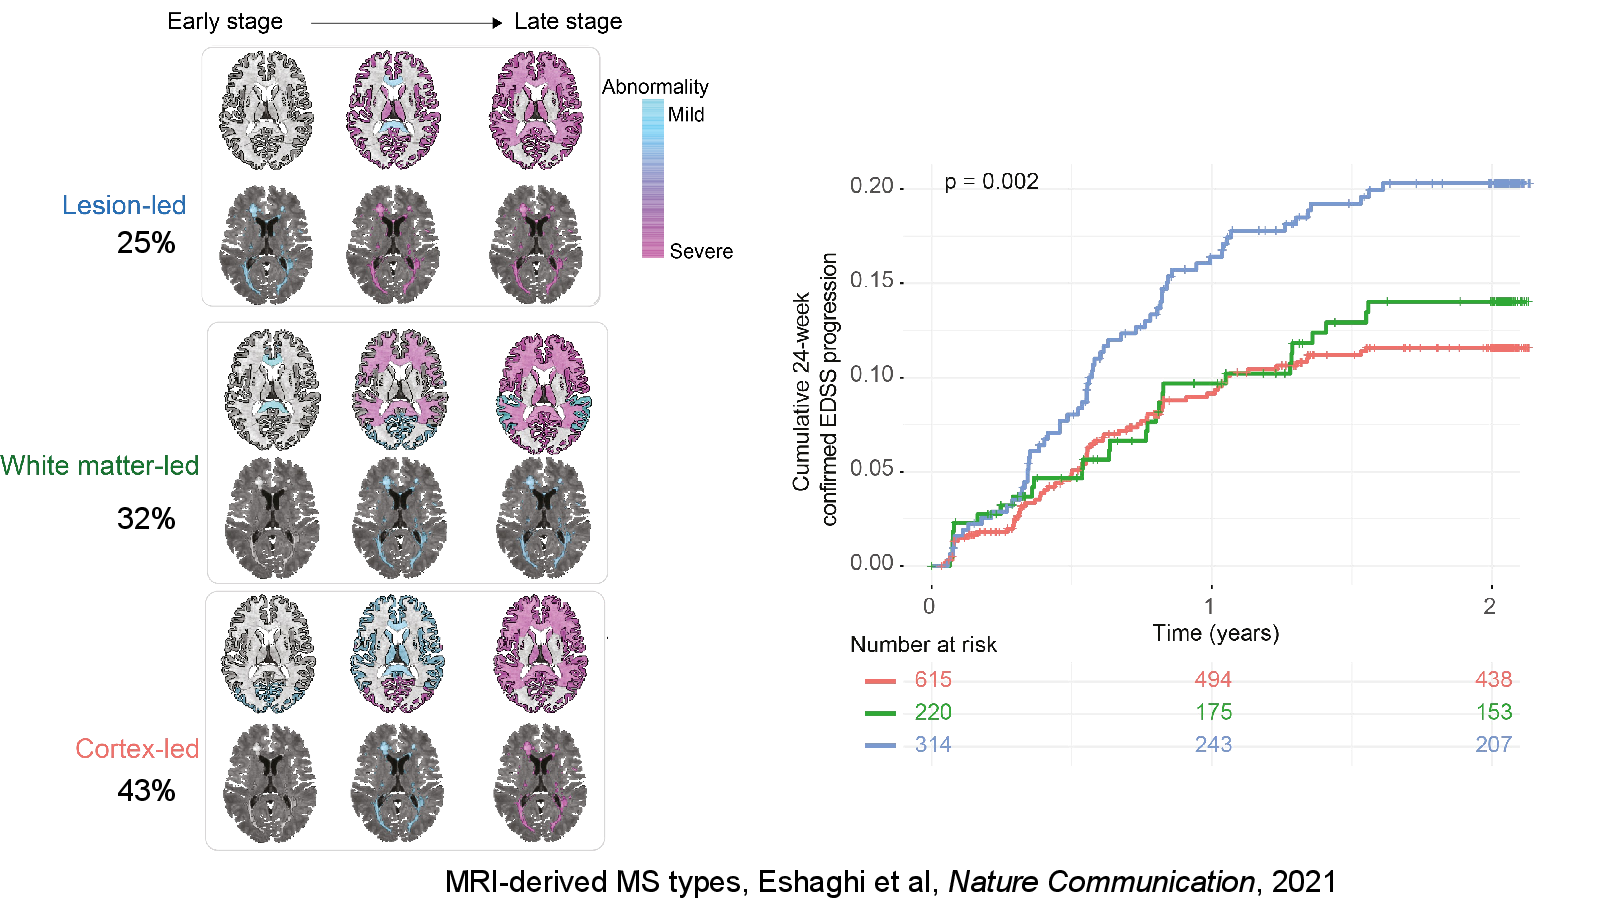
  • MRI-derived multiple sclerosis subtypes
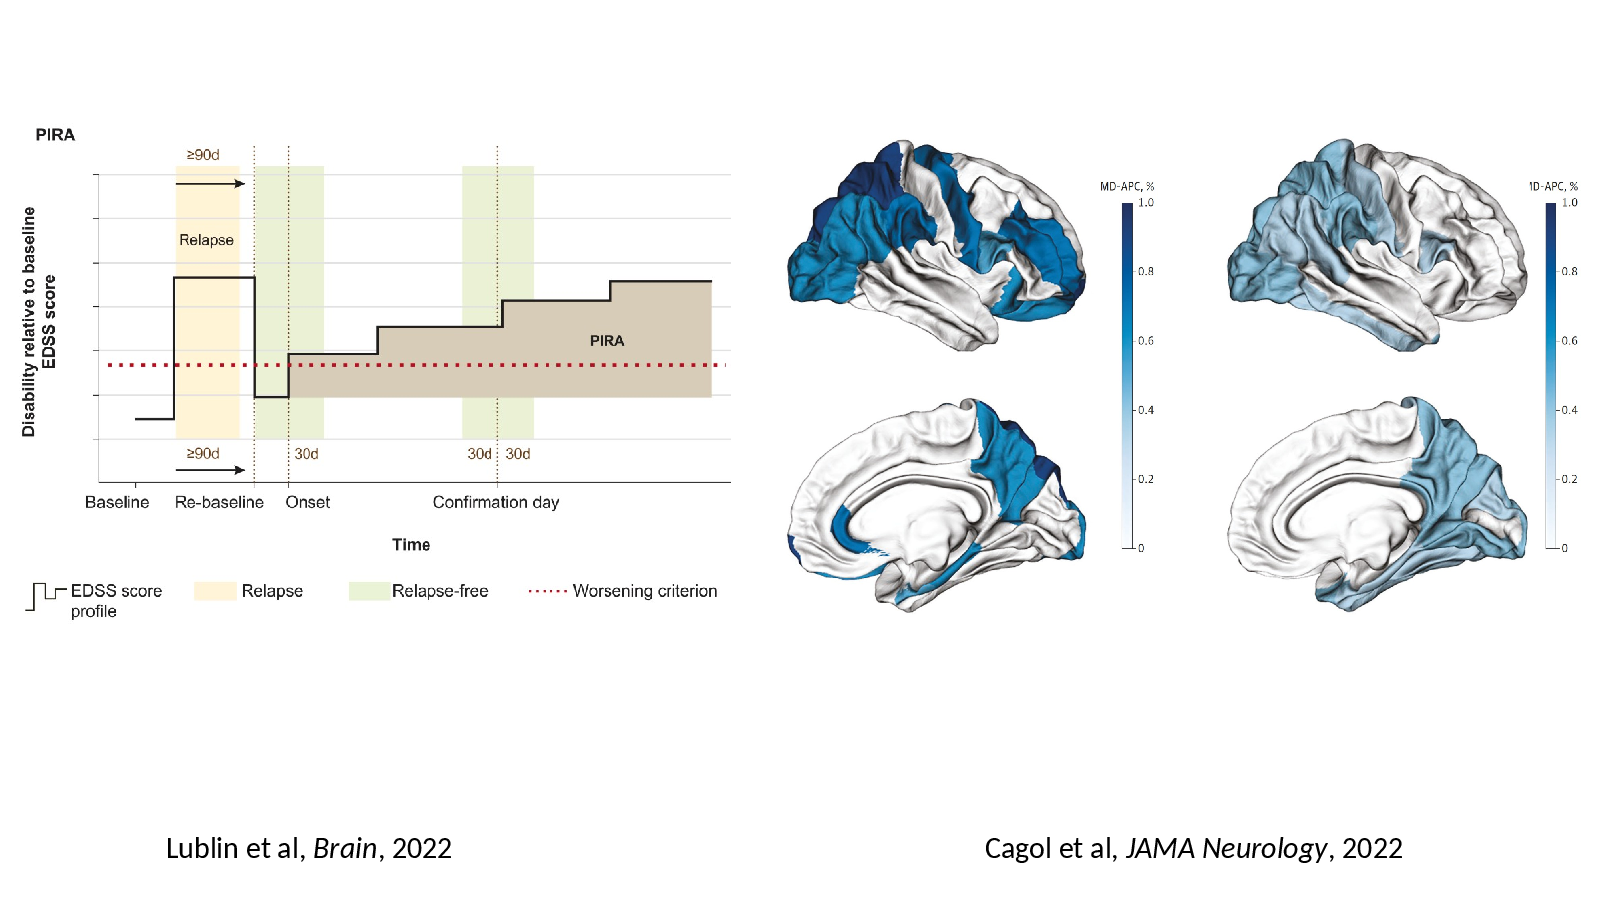
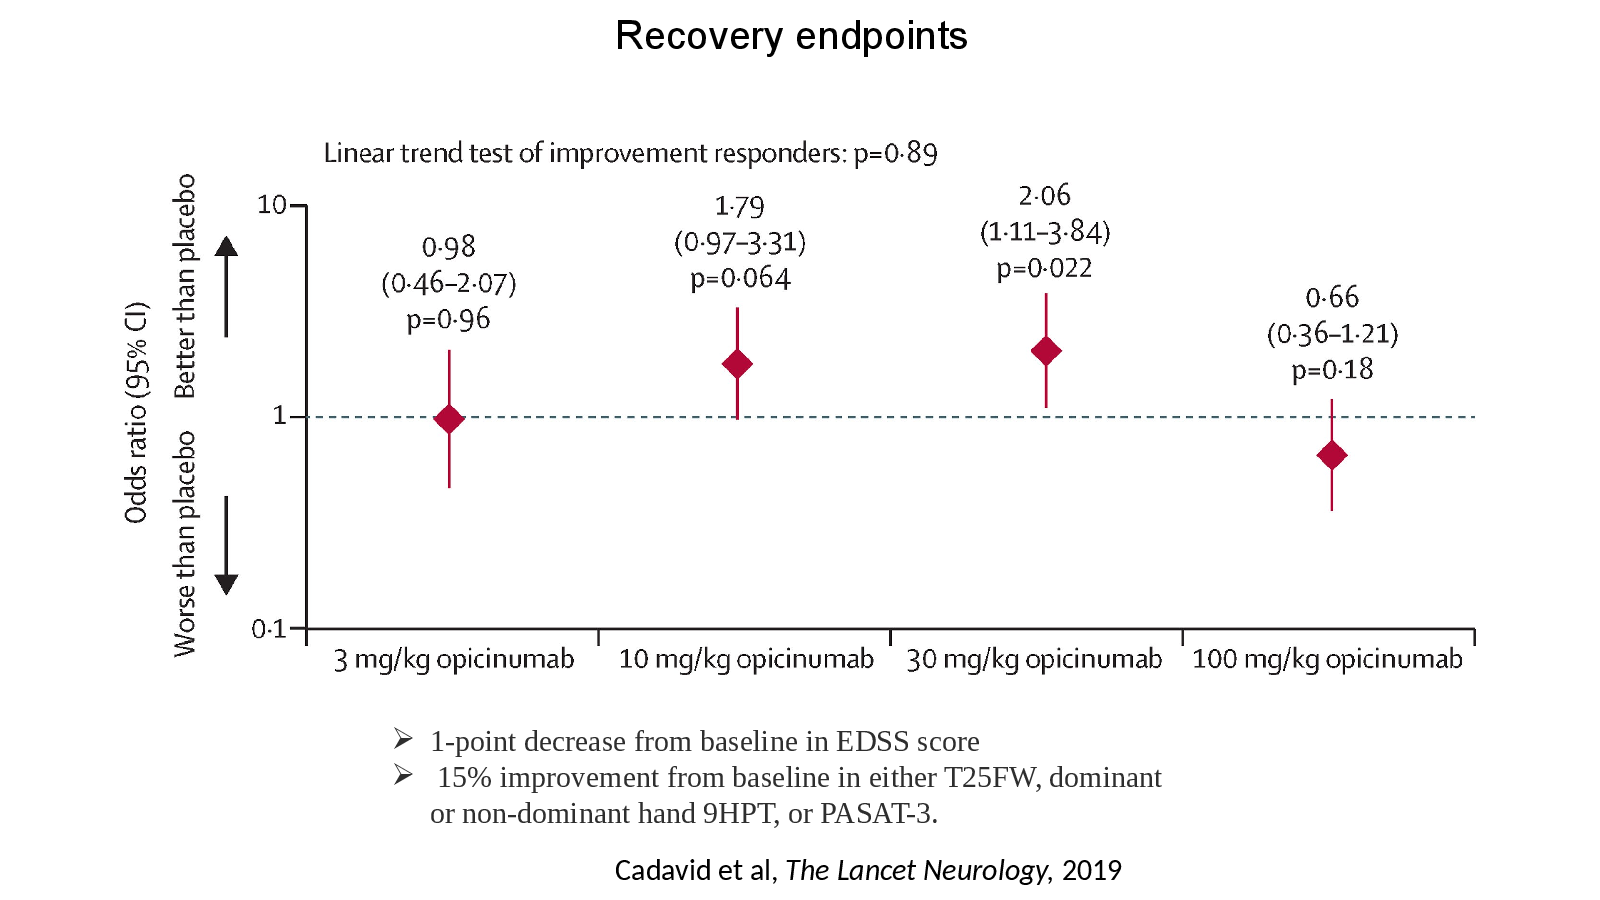
  • Emerging outcomes and future perspectives

Take-away

Complexity is useful when it improves a defined clinical decision; the model still needs an outcome and explanation that clinicians can assess.

Original deck

Slide by slide

Read the 23-slide presentation in order, or use the index to jump.

  1. Slide 01

    Clinical prediction using complex models

    Slide 1: Clinical prediction using complex modelsOpen full-size slide

    Arman Eshaghi, MD, PhD

    Queen Square Institute of Neurology

    and

    Department of Computer Science

    University College London

    UK

  2. Slide 02

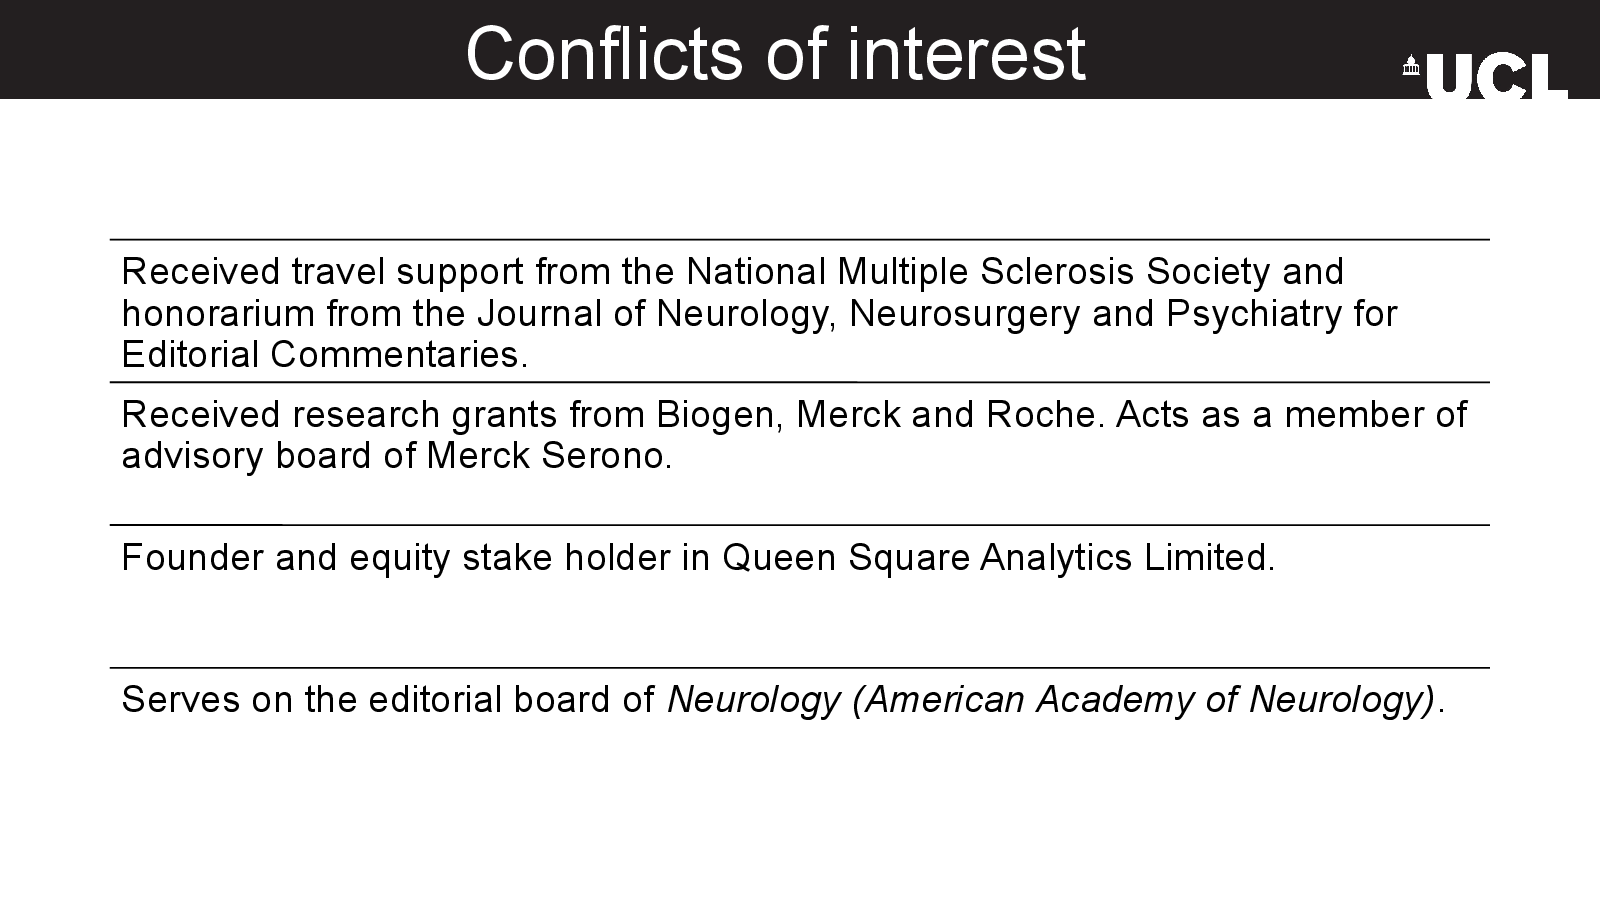
    Conflicts of interest

    Slide 2: Conflicts of interestOpen full-size slide
    • Received travel support from the National Multiple Sclerosis Society and honorarium from the Journal of Neurology, Neurosurgery and Psychiatry for Editorial Commentaries.
    • Received research grants from Biogen, Merck and Roche. Acts as a member of advisory board of Merck Serono.
    • Founder and equity stake holder in Queen Square Analytics Limited.
    • Serves on the editorial board of Neurology (American Academy of Neurology).
  3. Slide 03

    Outline

    Slide 3: OutlineOpen full-size slide

    Modelling and prognosis

    Literature highlights

    Translation and future perspectives

  4. Slide 04

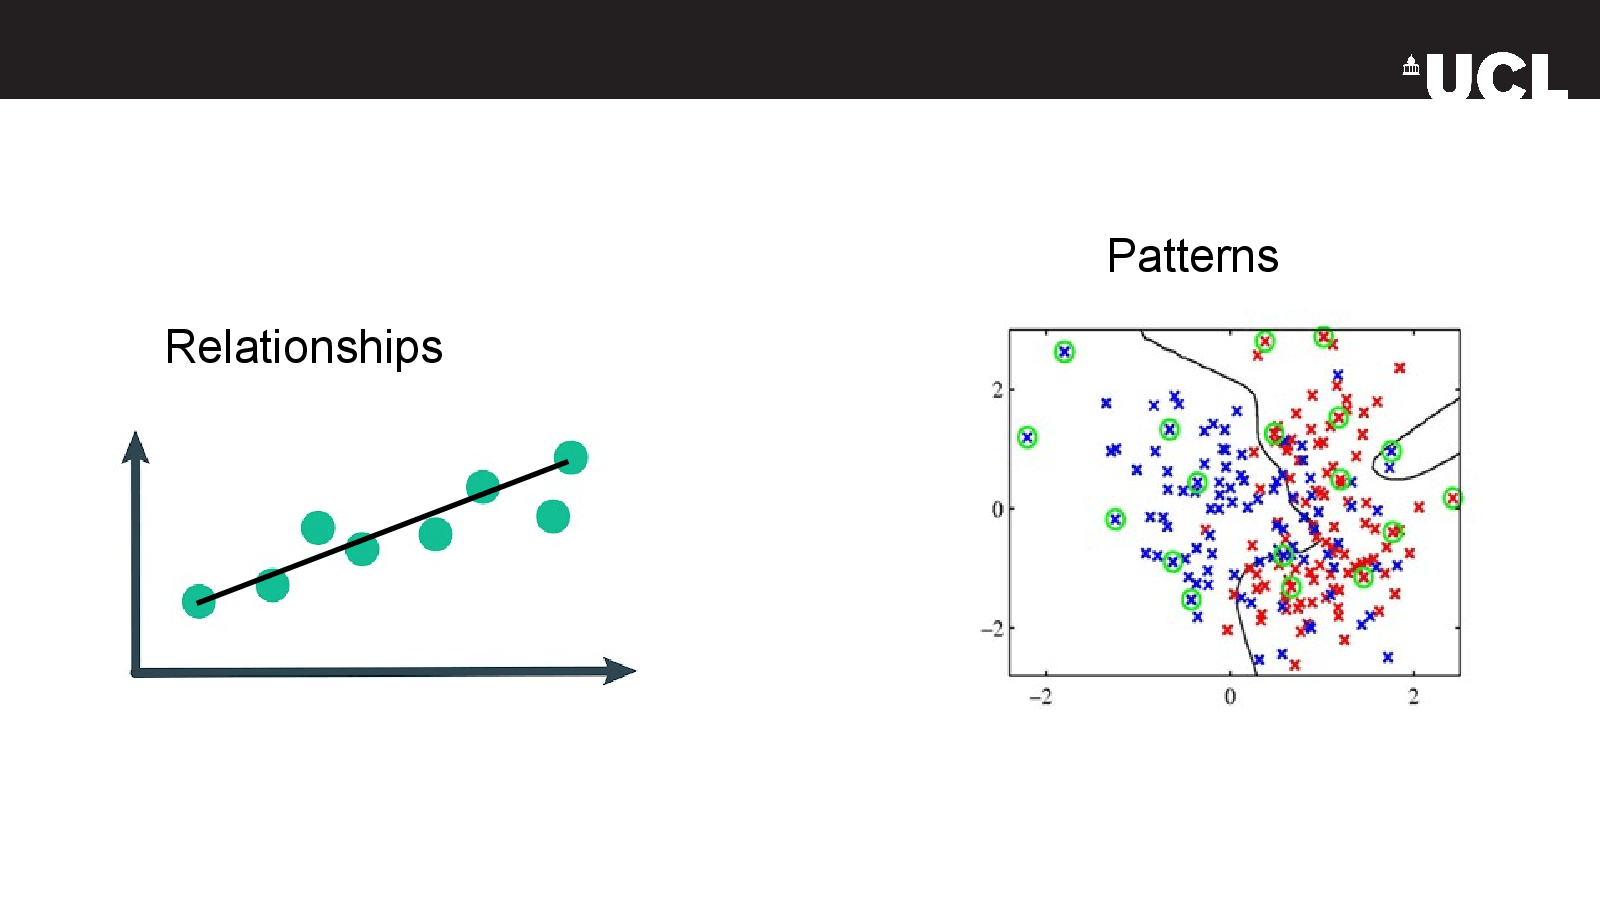
    Slide 4

    Full image of slide 4Open full-size slide

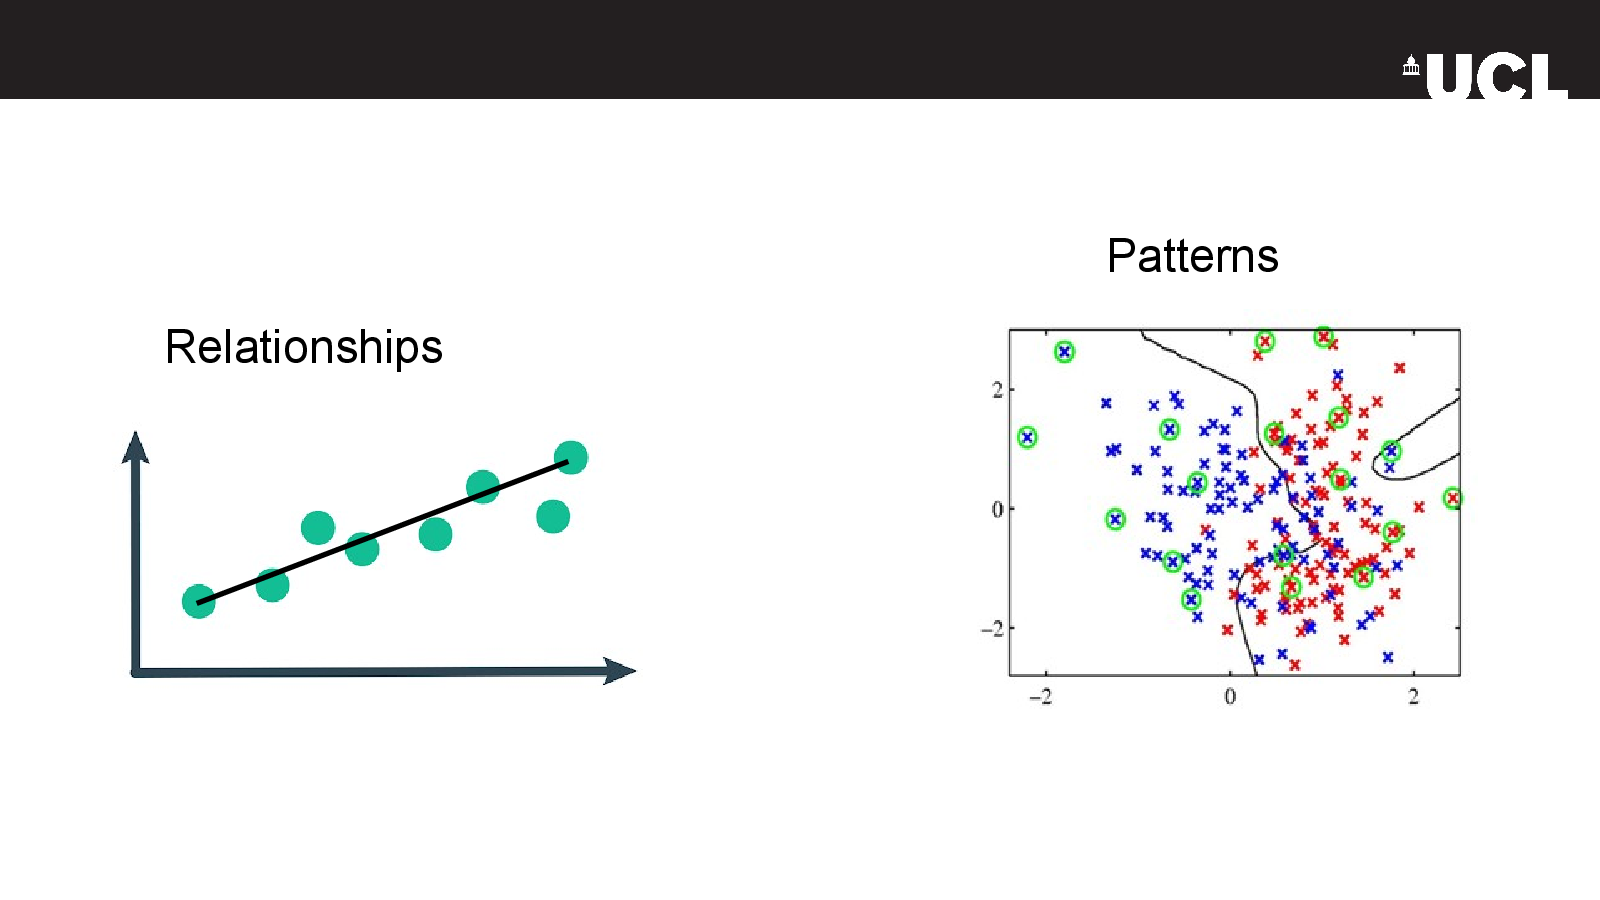
    Patterns

    Relationships

    Speaker notes

    Mathematical description of how things work.

  5. Slide 06

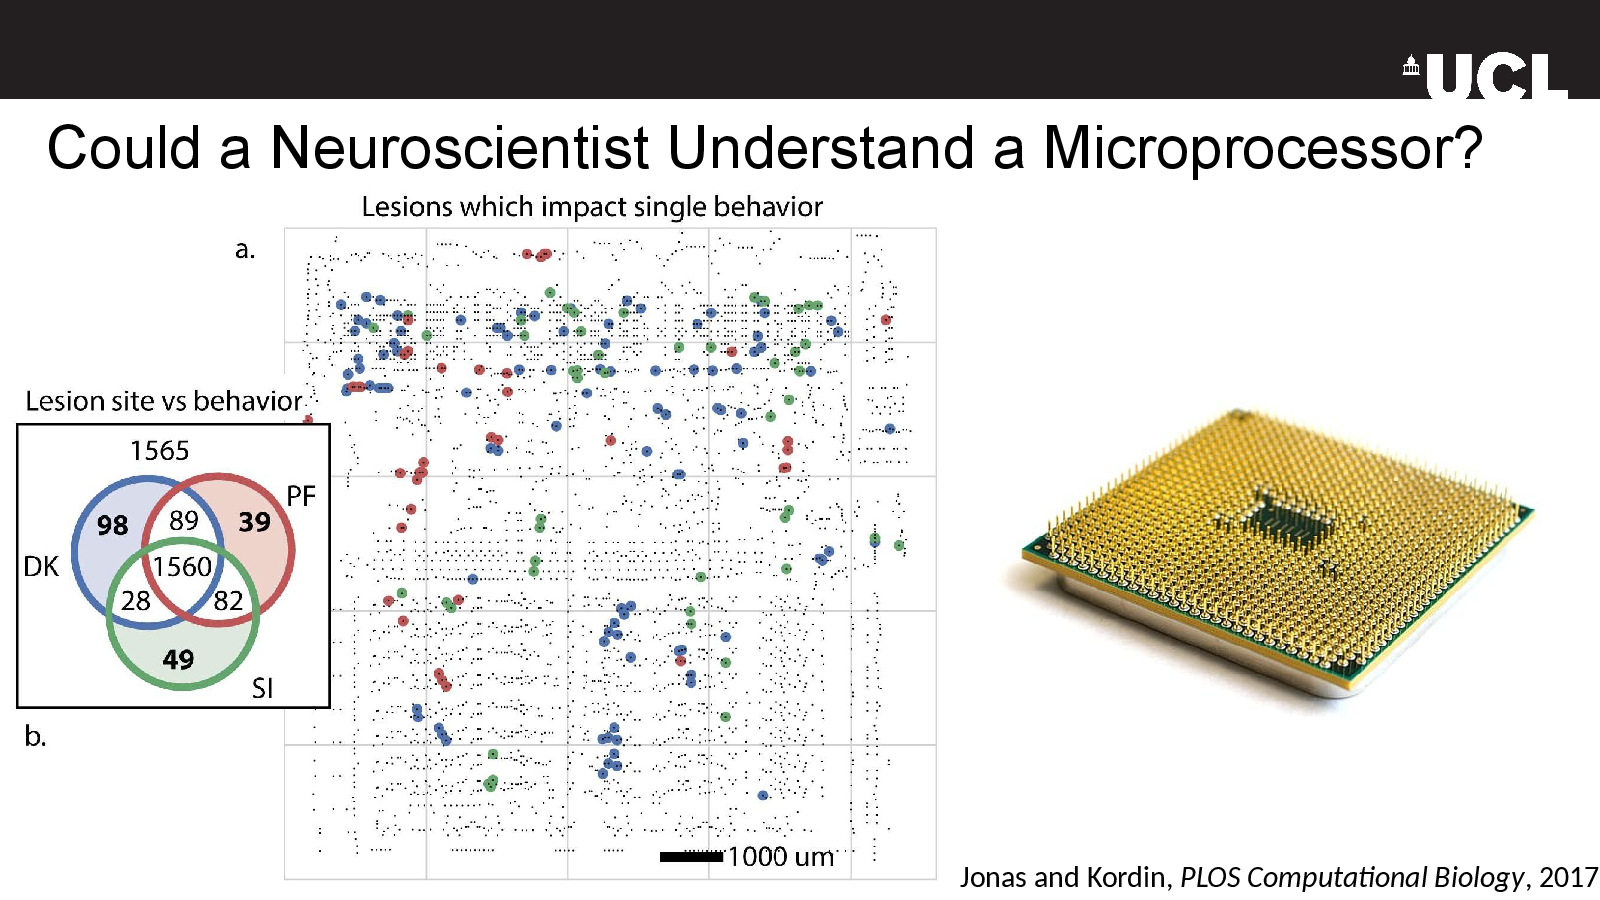
    Could a Neuroscientist Understand a Microprocessor?
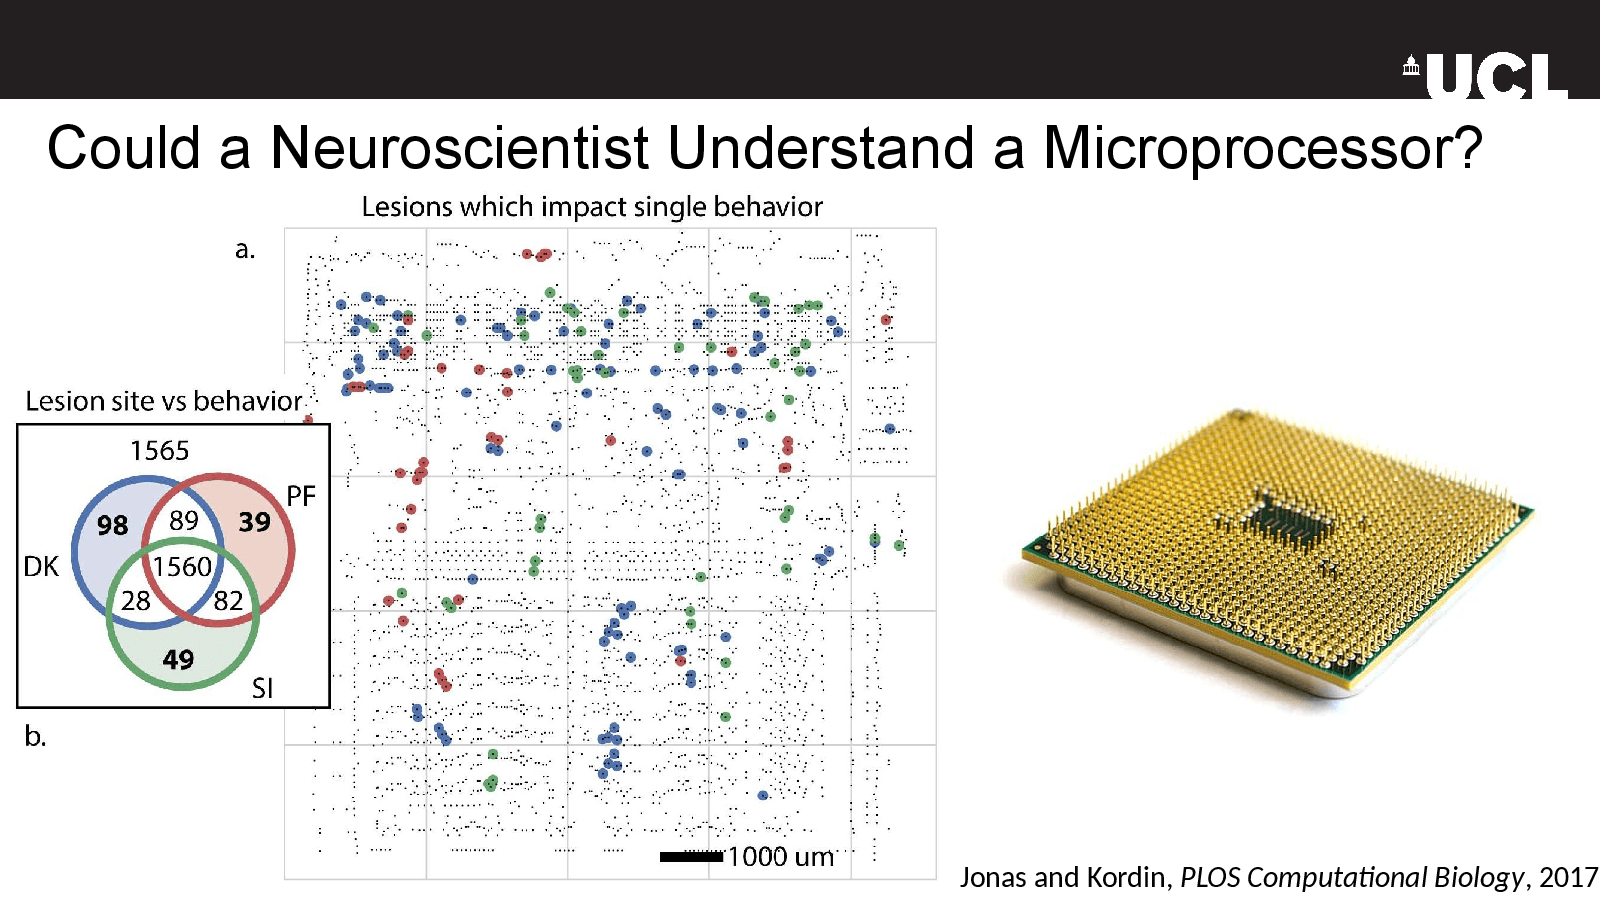
    Slide 6: Could a Neuroscientist Understand a Microprocessor?Open full-size slide

    Jonas and Kordin, PLOS Computational Biology, 2017

  6. Slide 07

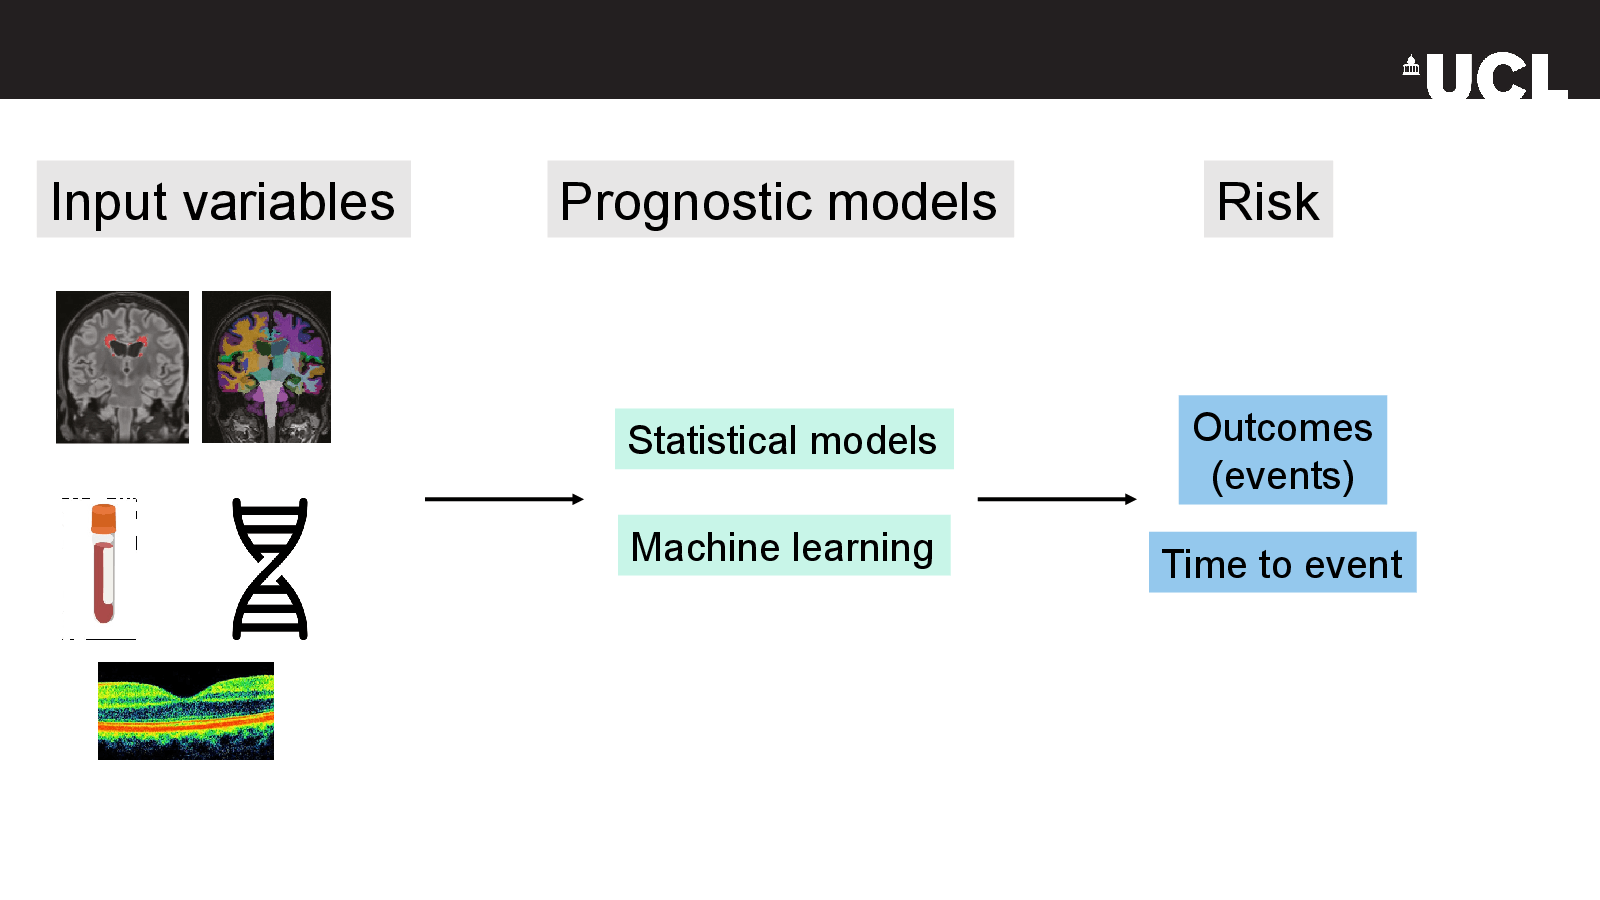
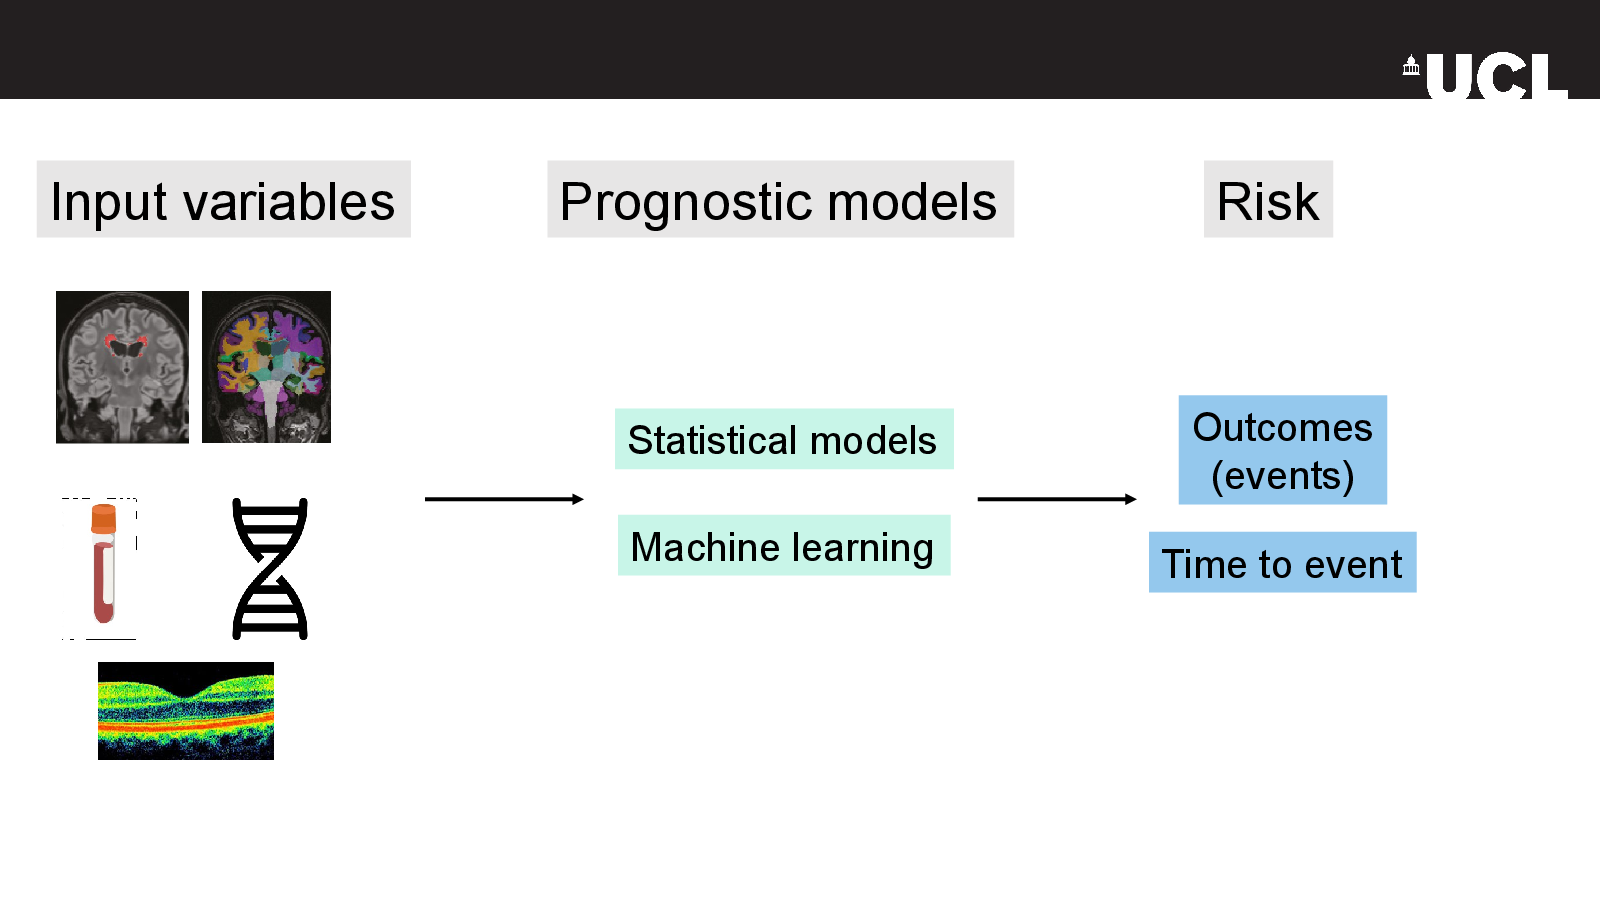
    Time to event

    Slide 7: Time to eventOpen full-size slide

    Input variables

    Prognostic models

    Risk

    Outcomes

    (events)

    Statistical models

    Machine learning

  7. Slide 08

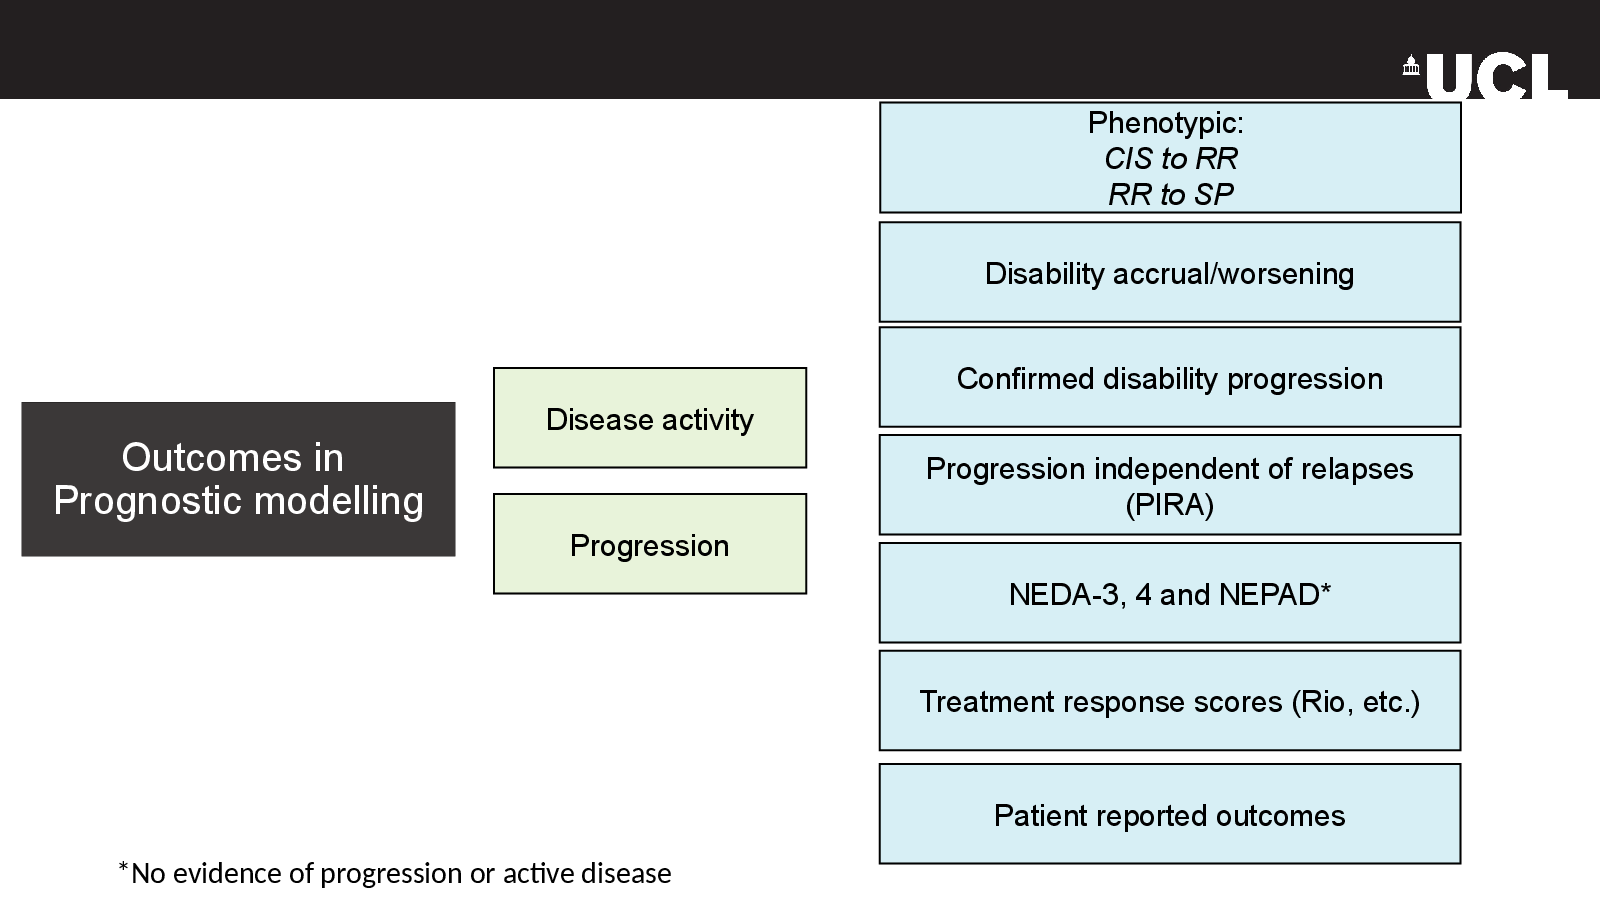
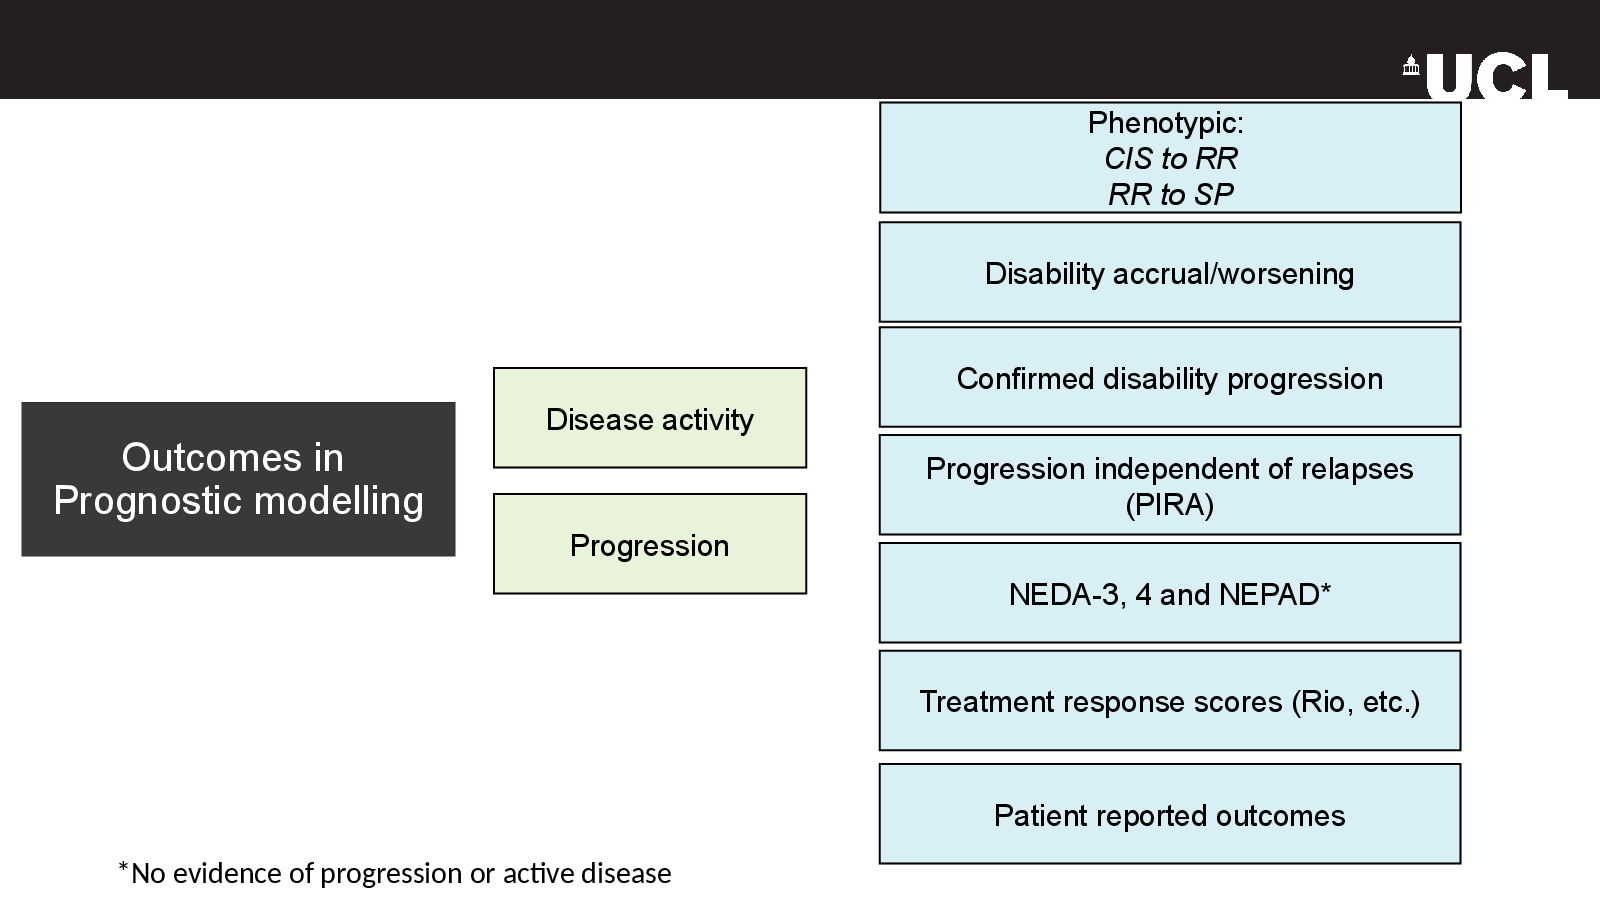
    Outcomes in

    Slide 8: Outcomes inOpen full-size slide

    Prognostic modelling

    Phenotypic:

    CIS to RR

    RR to SP

    Disability accrual/worsening

    Confirmed disability progression

    Disease activity

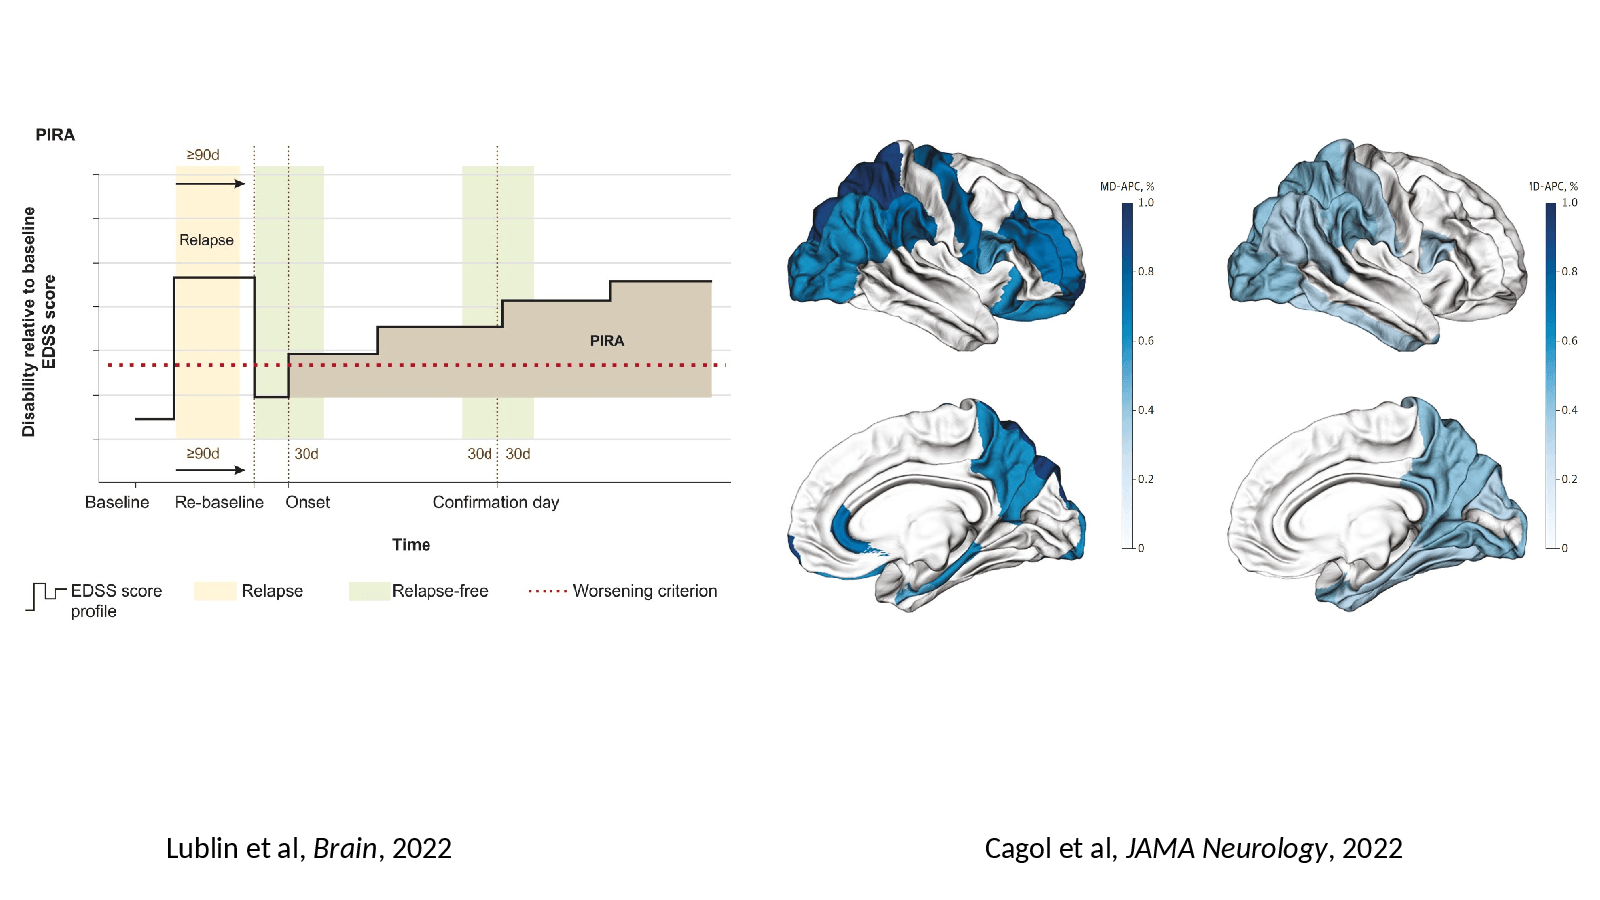
    Progression independent of relapses

    (PIRA)

    Progression

    NEDA-3, 4 and NEPAD*

    Treatment response scores (Rio, etc.)

    Patient reported outcomes

    *No evidence of progression or active disease

    Speaker notes

    https://www.uptodate.com/contents/indications-for-switching-or-stopping-disease-modifying-therapy-for-multiple-sclerosis

  8. Slide 11

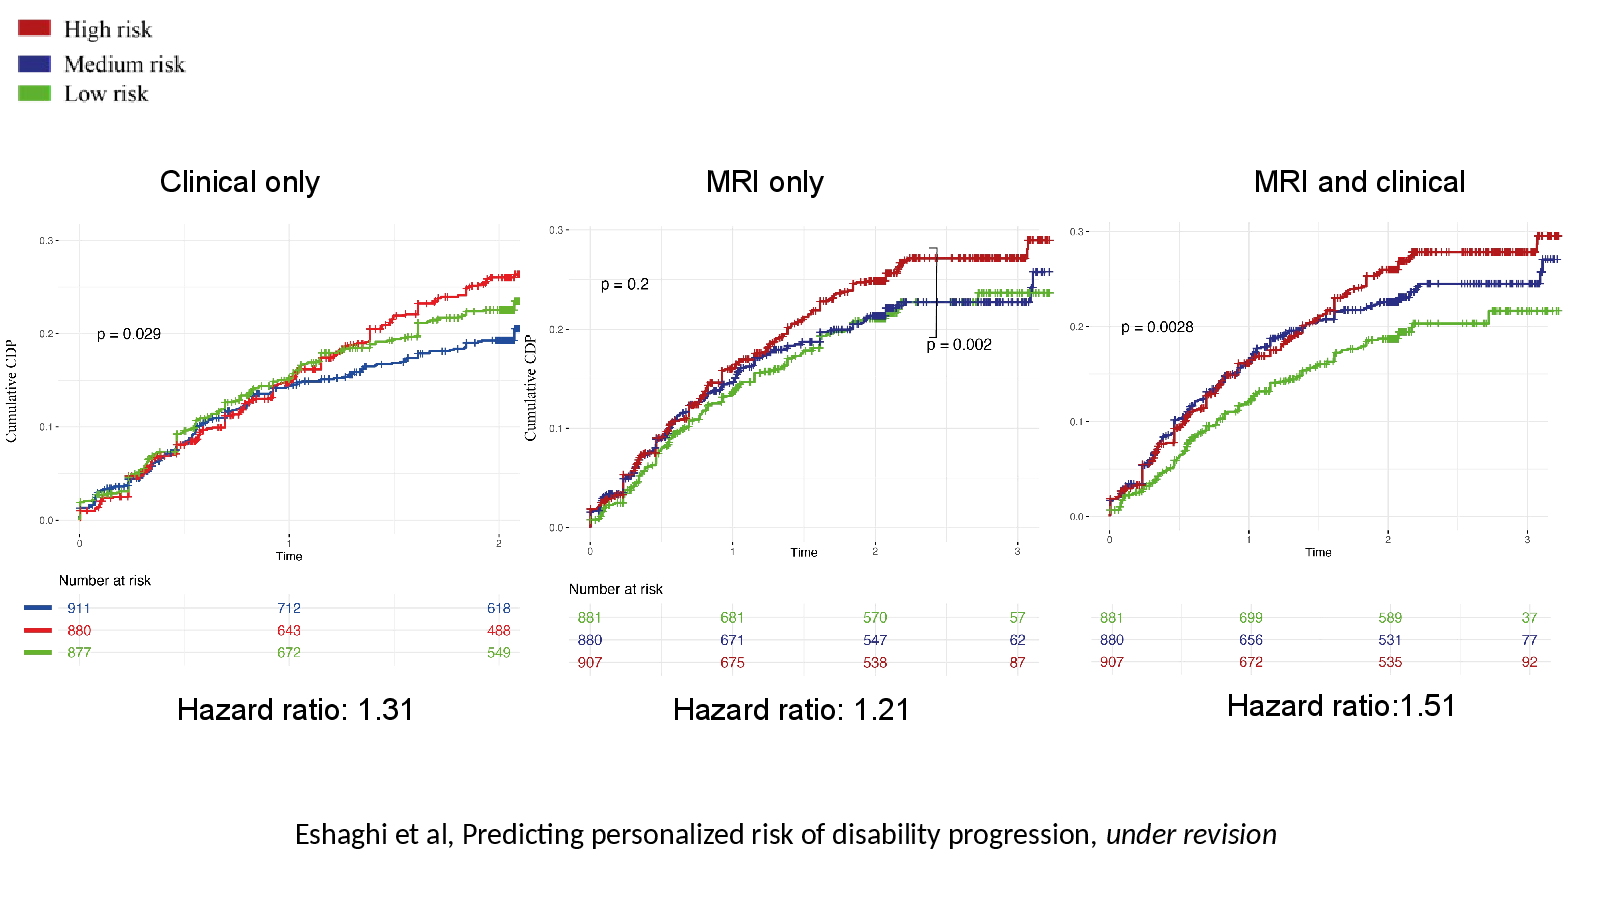
    Eshaghi et al, Predicting personalized risk of disability progression, under revision
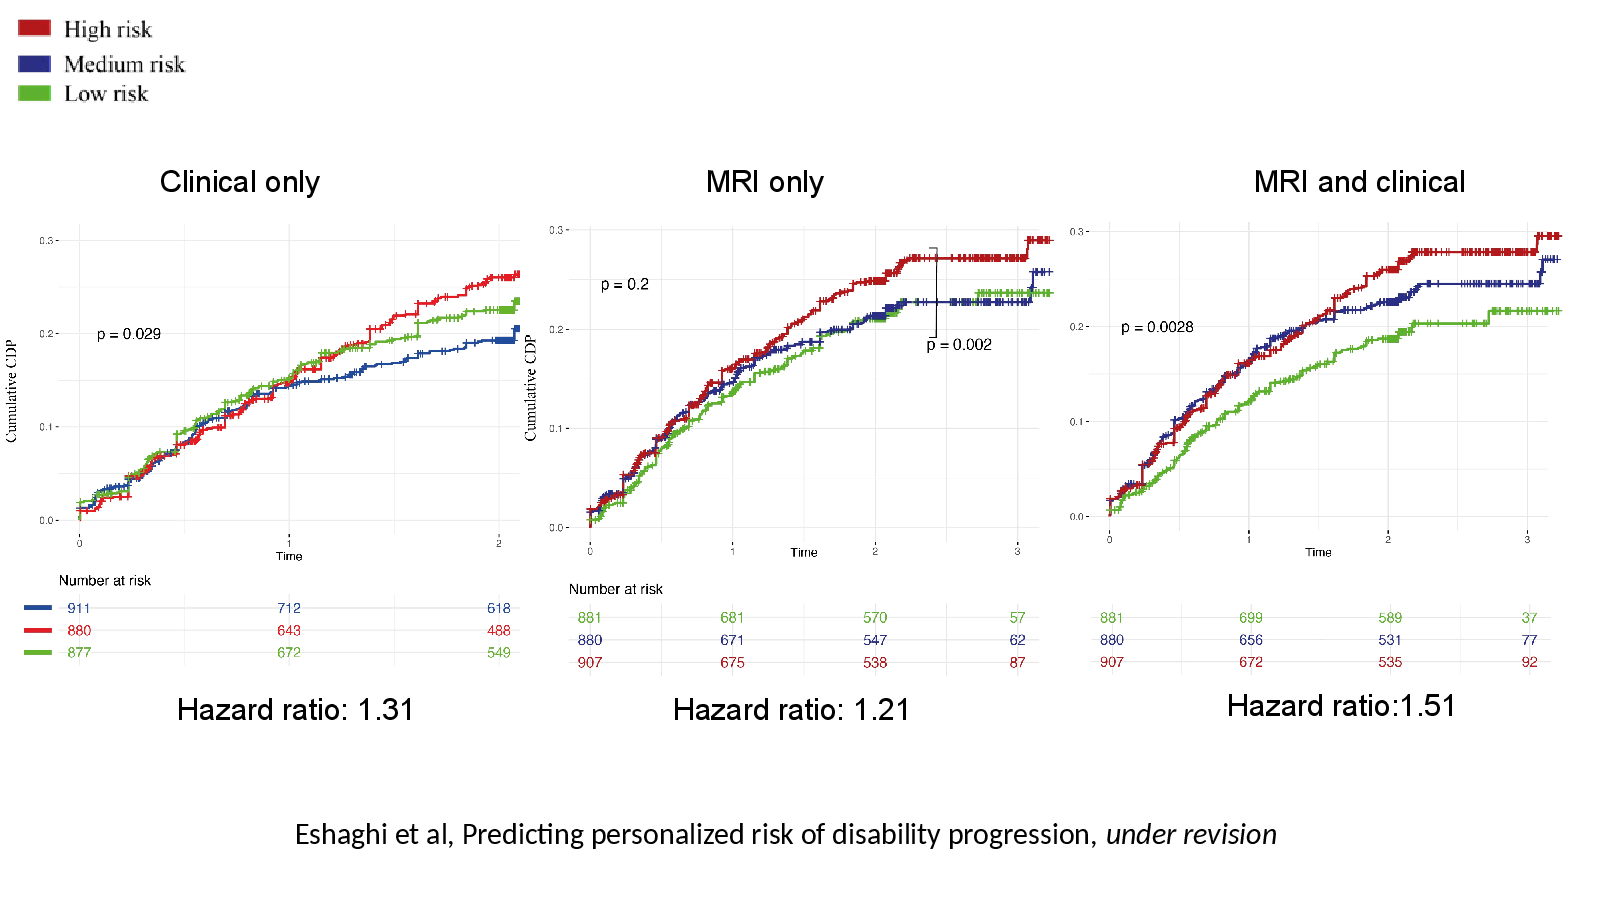
    Slide 11: Eshaghi et al, Predicting personalized risk of disability progression, under revisionOpen full-size slide
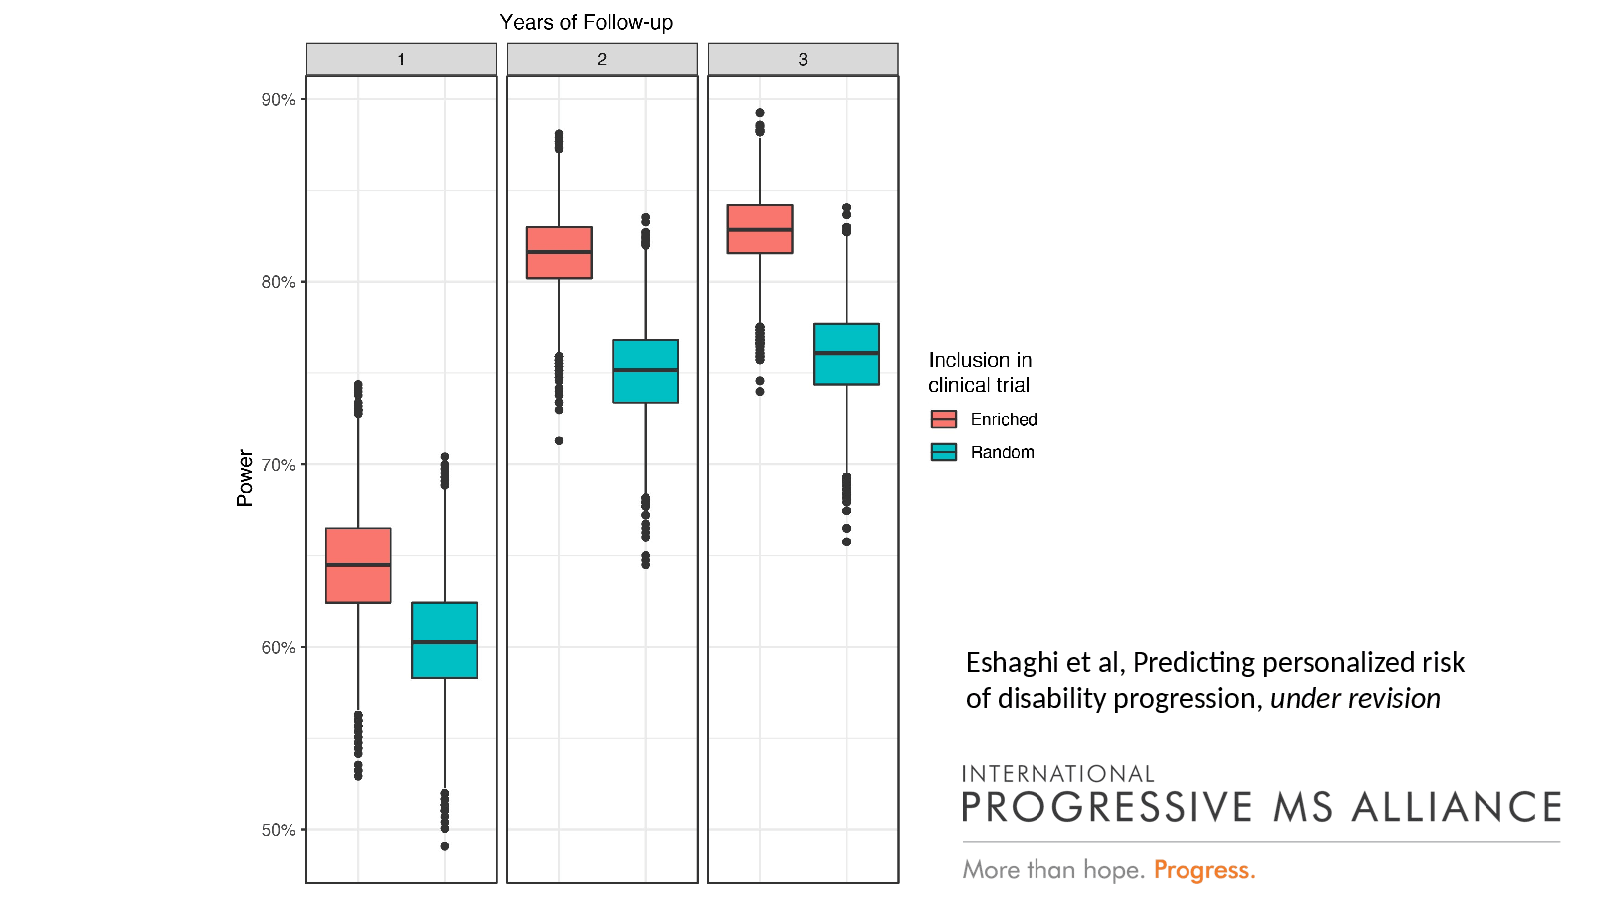
    Clinical only

    MRI only

    MRI and clinical

    Hazard ratio:1.51

    Hazard ratio: 1.31

    Hazard ratio: 1.21

  9. Slide 12

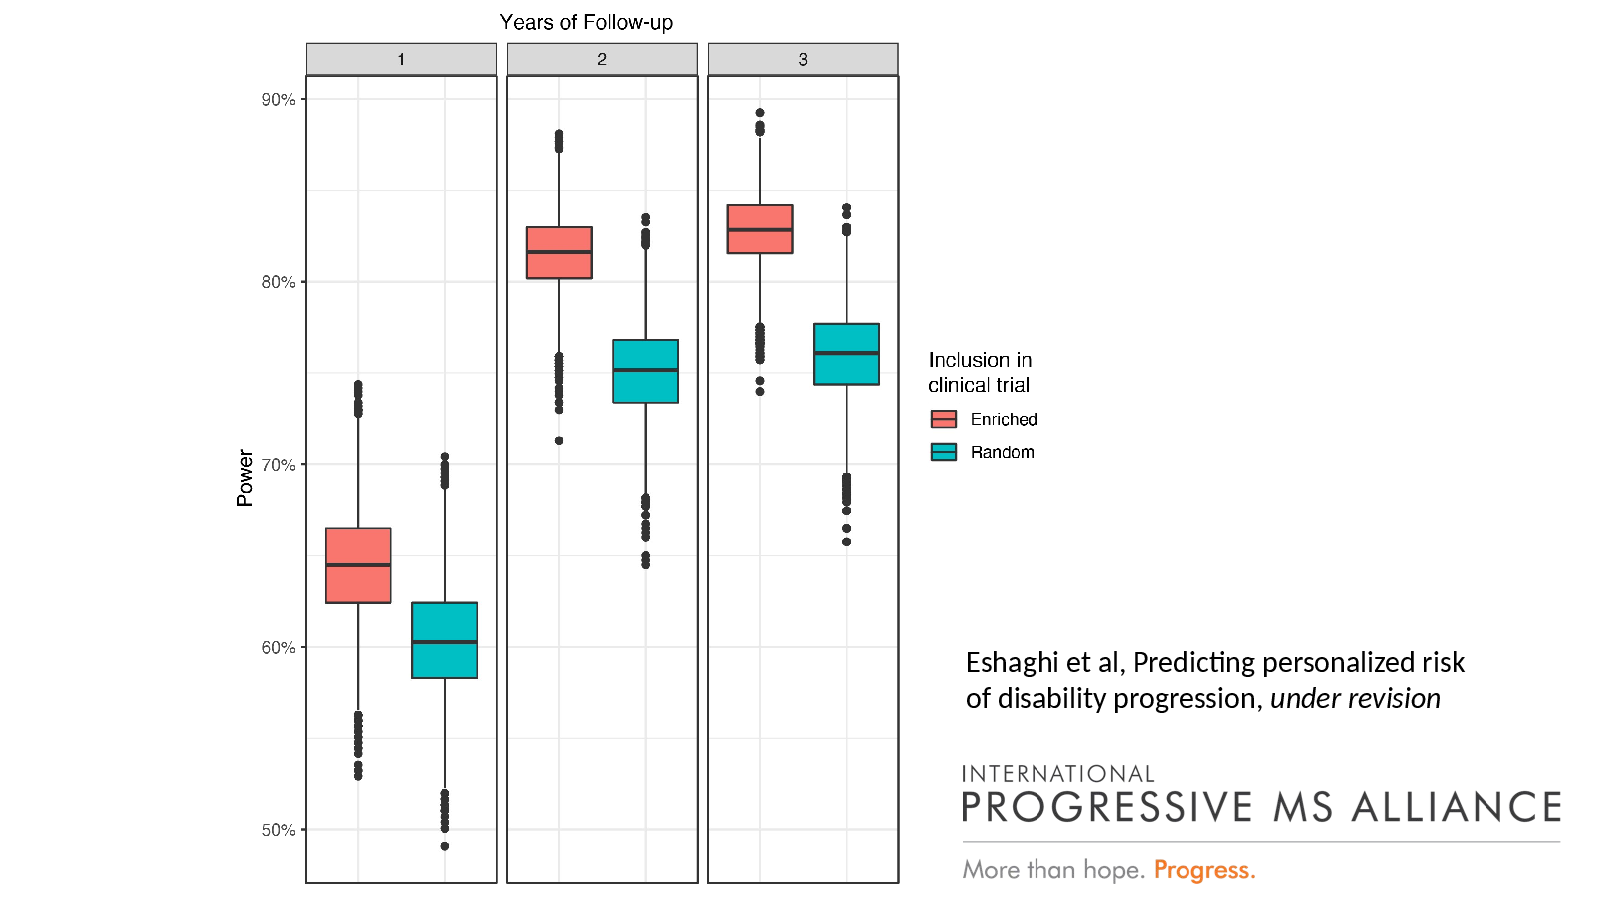
    Eshaghi et al, Predicting personalized risk

    Slide 12: Eshaghi et al, Predicting personalized riskOpen full-size slide

    of disability progression, under revision

  10. Slide 13

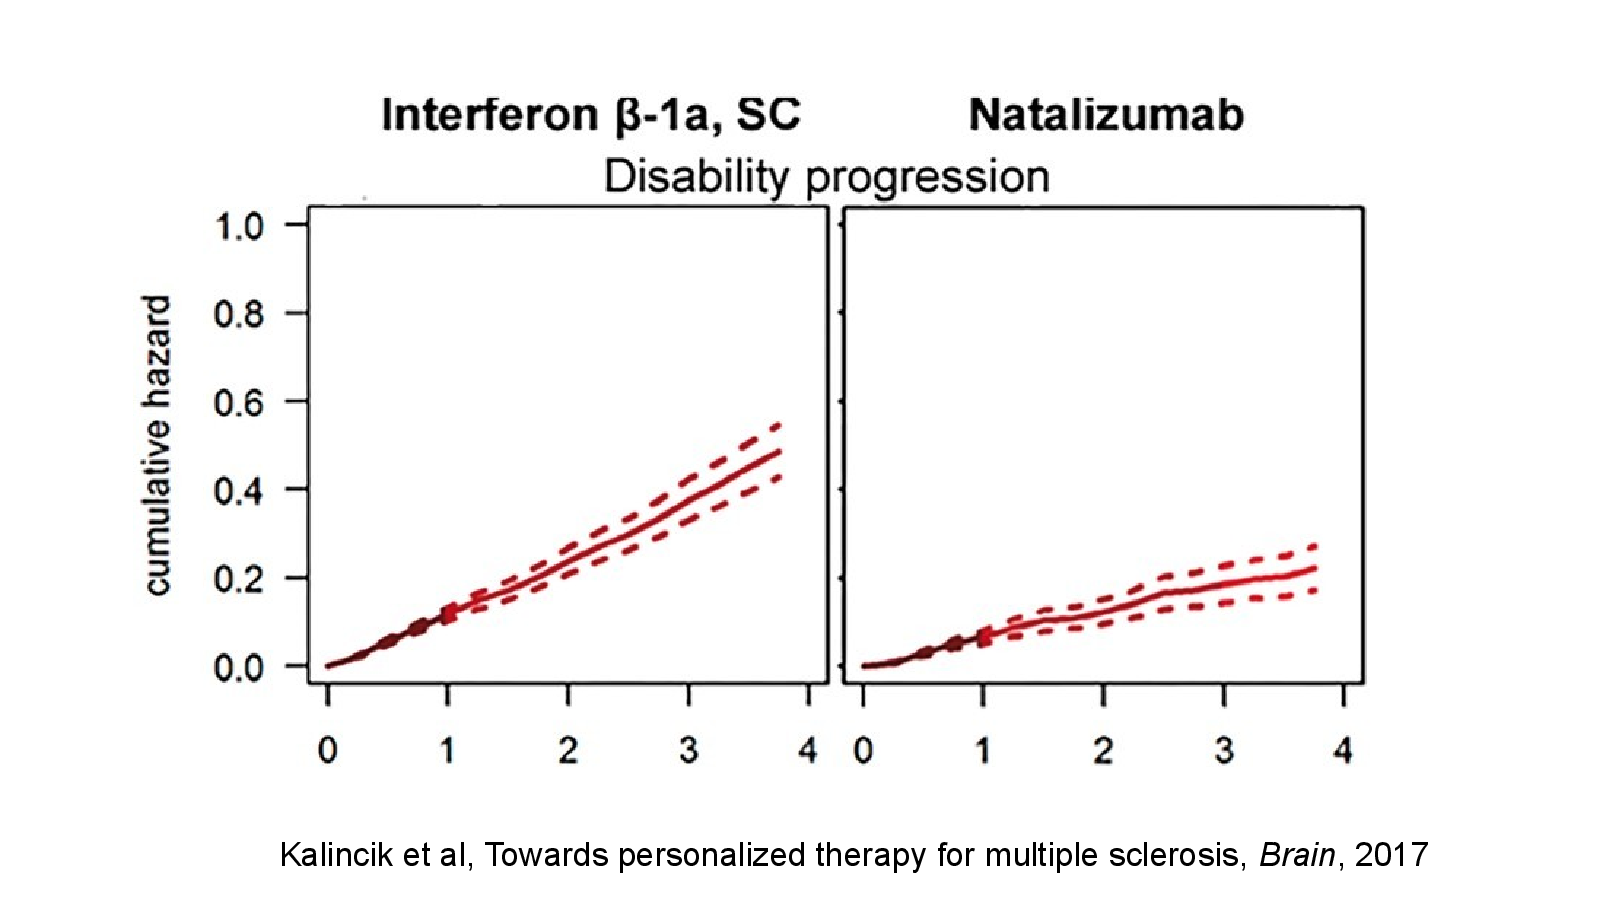
    Kalincik et al, Towards personalized therapy for multiple sclerosis, Brain, 2017
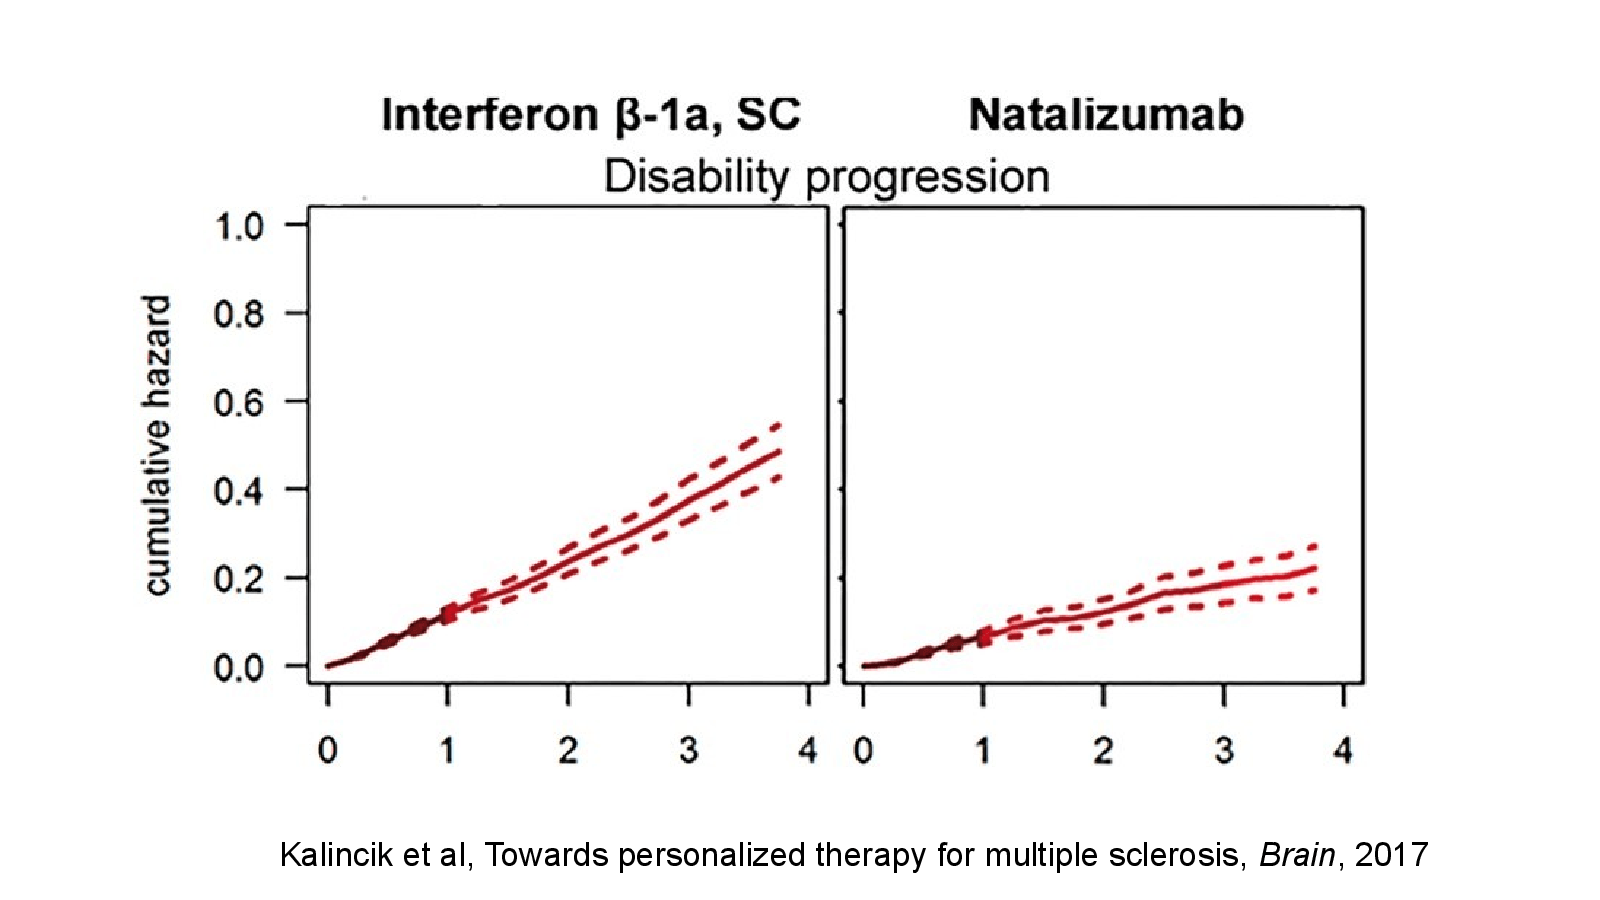
    Slide 13: Kalincik et al, Towards personalized therapy for multiple sclerosis, Brain, 2017Open full-size slide
    Speaker notes

    An example of individual prediction of response to interferon β-1a and natalizumab in moderately advanced, active multiple sclerosis. Six treatment outcomes are predicted for a 43-year-old female with relapsing-remitting multiple sclerosis, with an EDSS score of 5 (with sensory functional score of 4, and pyramidal, cerebellar and ambulatory functional scores of 3) and increase in the EDSS score within the previous year, who first presented with spinal cord symptoms at the age of 33. The patient had previously experienced 10 multiple sclerosis relapses, mostly with pyramidal symptoms, six of these of high severity and one while treated with DMTs, with the most recent relapse having occurred 51 days before the date of the prediction. She was previously treated with two DMTs, her most aggressive DMT was natalizumab and she discontinued interferon β-1a subcutaneous 51 days before the prediction. Her brain and spinal cord MRI showed abnormal findings in keeping with the diagnosis of multiple sclerosis and her CSF showed oligoclonal bands that were not present in the serum. Information about 74–93% of the variables informing the predictive models was available. The curves represent the most probable number of outcome events or area under EDSS-time curve (±95% prediction interval) over the next 4 years if recommencing natalizumab or interferon β-1a subcutaneous. The shading of the curves illustrates the robustness of the prediction (quantified as the product of the size of the training cohort and the accuracy of the prediction in the testing cohort).

    References

  11. Slide 22

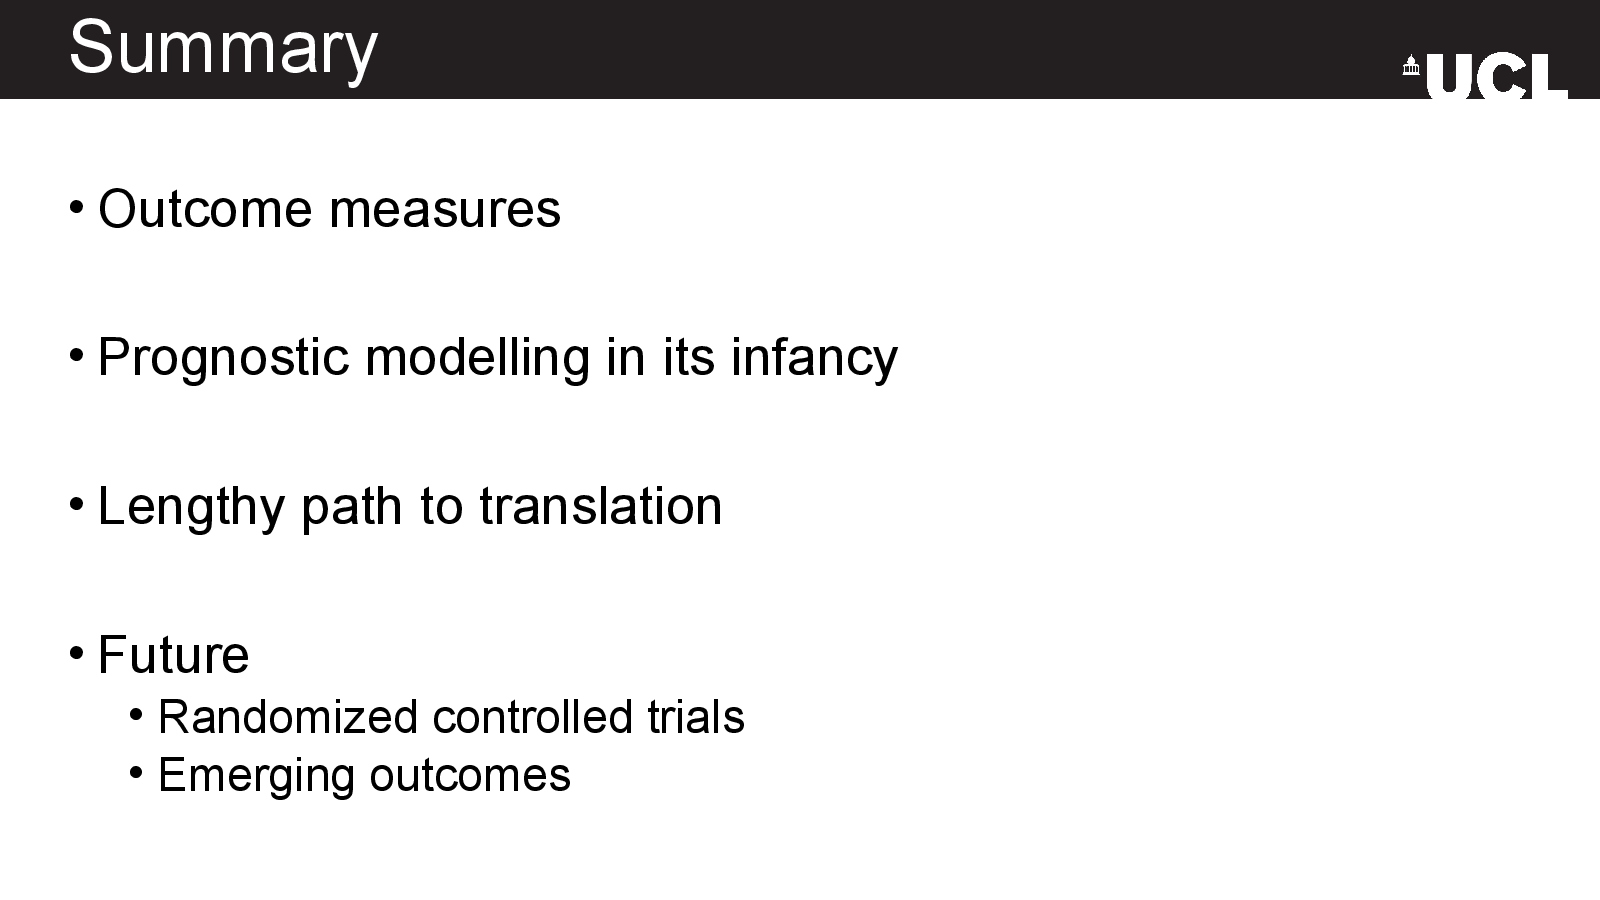
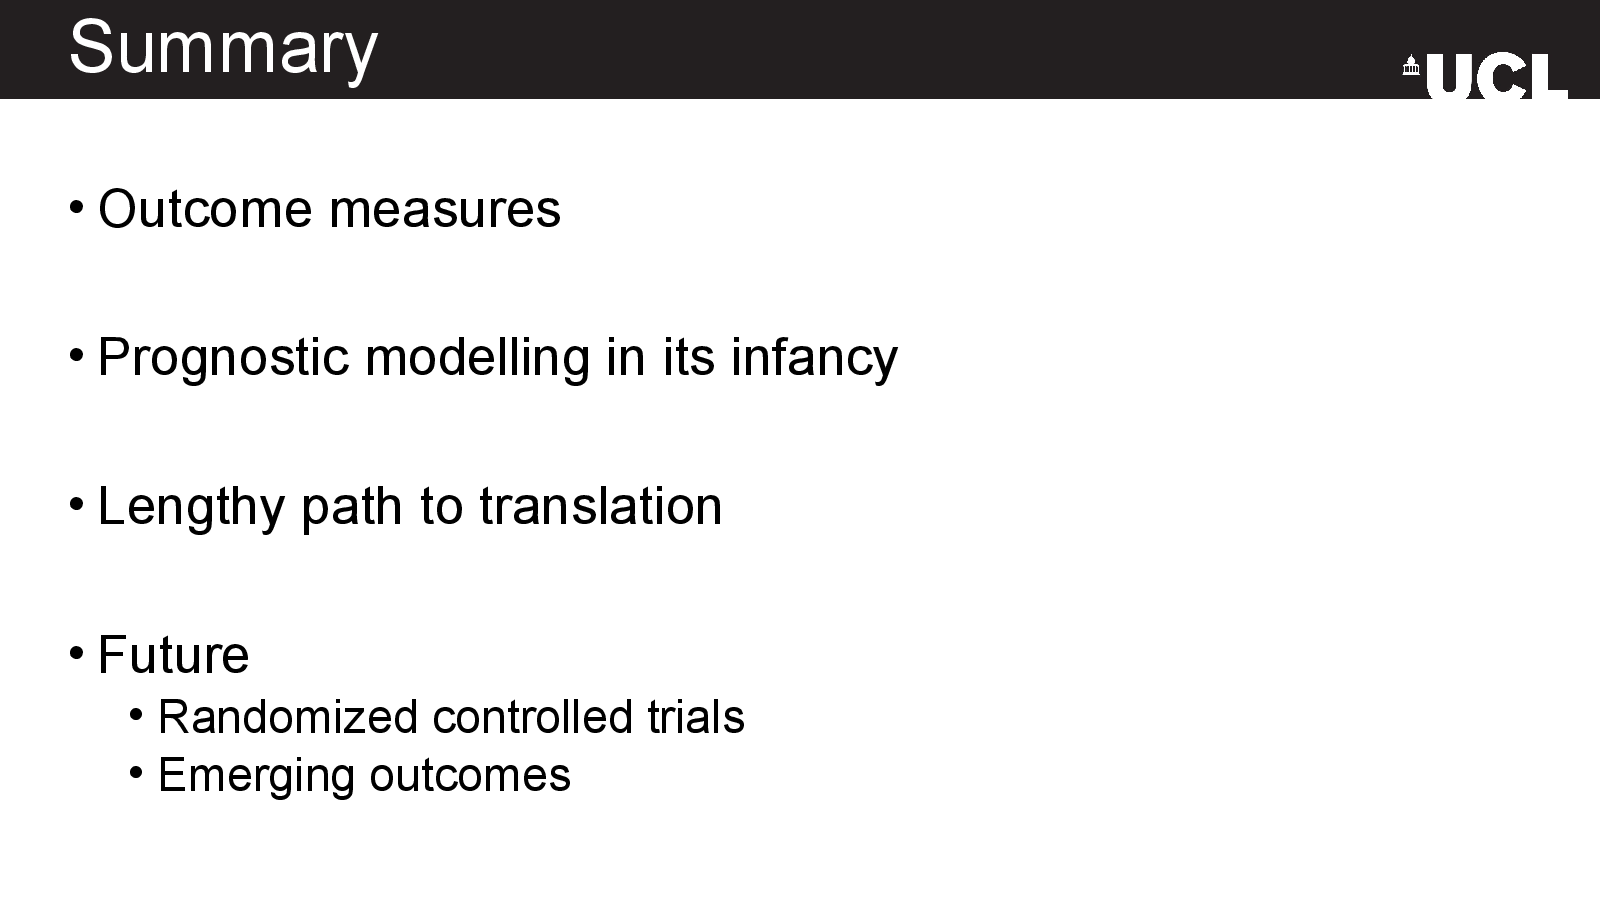
    Summary

    Slide 22: SummaryOpen full-size slide

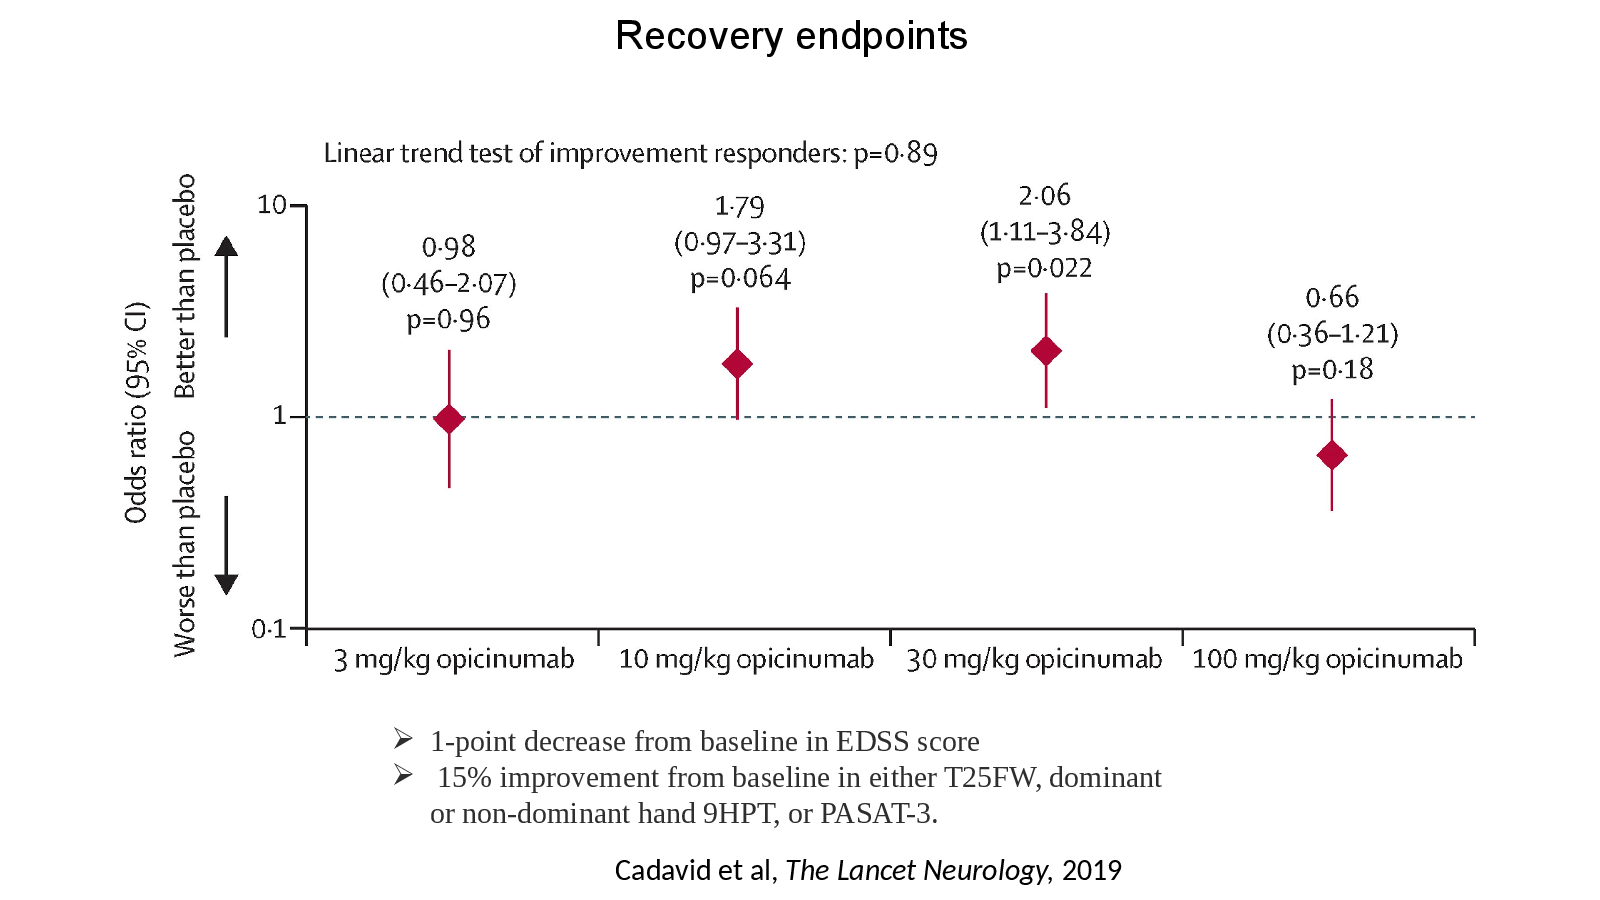
    Outcome measures

    Prognostic modelling in its infancy

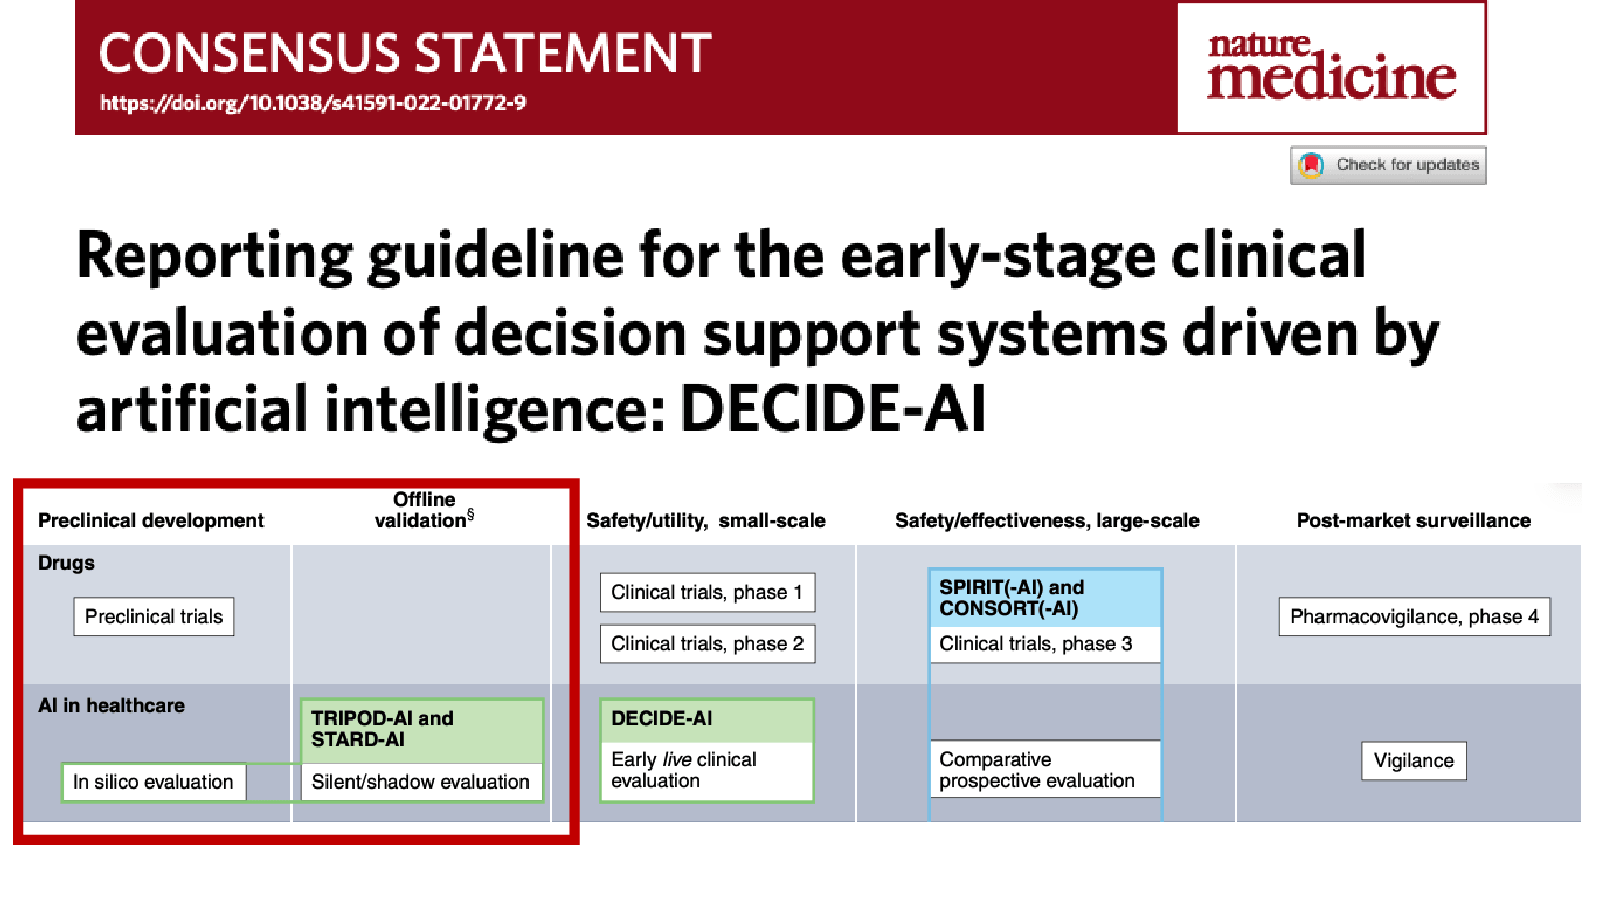
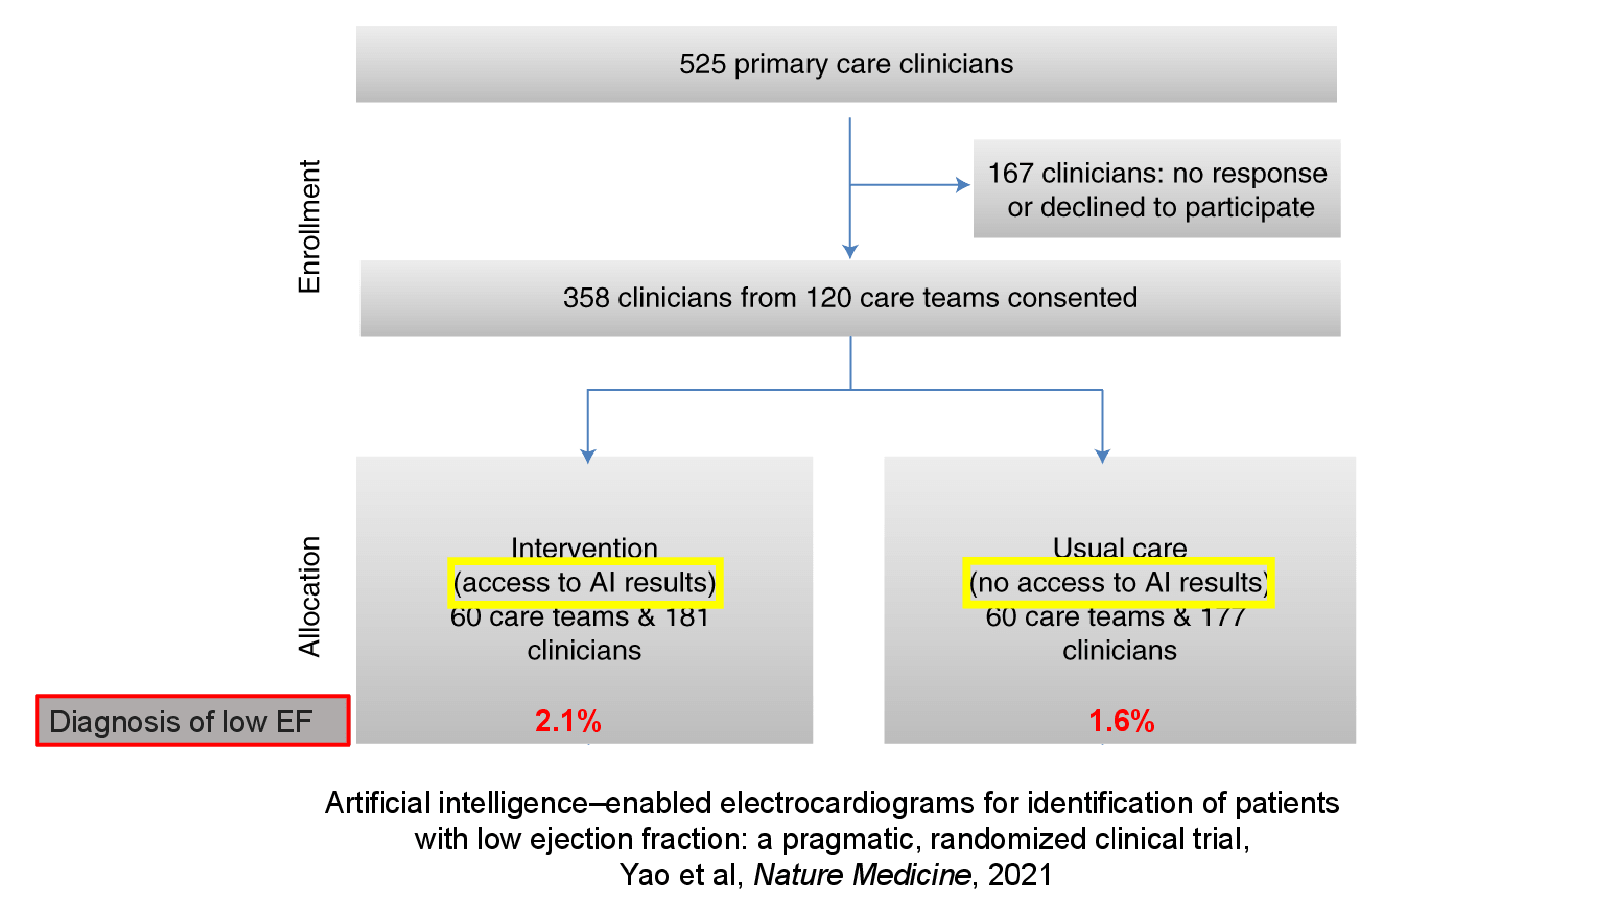
    Lengthy path to translation

    Future

    • Randomized controlled trials
    • Emerging outcomes