Conference ·
MRI findings in progressive multiple sclerosis
A clinical overview of what brain and spinal-cord MRI reveal about progression and treatment trials.
ICTRIMS · New Delhi, India
The whole neuraxis
- Delivered
- Event
- ICTRIMS
- Place
- New Delhi, India
- Format
- Conference
- Source deck
- 35 slides
From the slides
Deck notes
This ICTRIMS lecture traced MRI findings in progressive multiple sclerosis from clinical phenotypes to quantitative measures of brain and spinal-cord change. It placed those measures in the context of treatment trials.
The question
What can MRI reveal about progression beyond the clinical labels used to describe multiple sclerosis?
Deck outline
- The clinical description of progressive multiple sclerosis
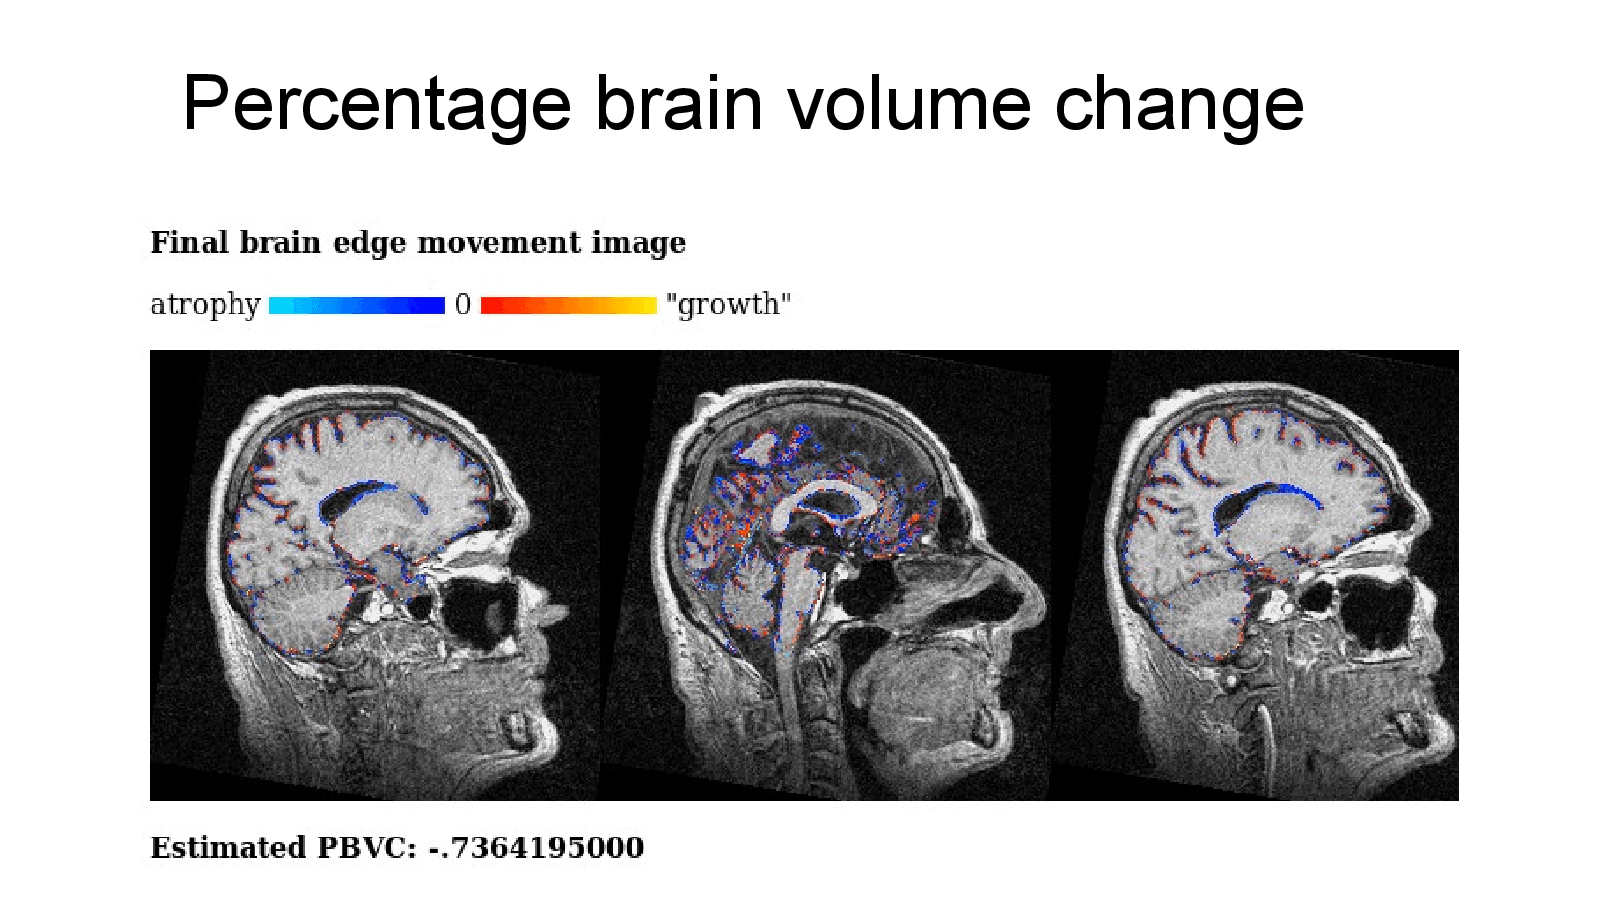
- Brain atrophy and percentage brain-volume change
- Data-driven MRI subtypes
- Evidence from treatment trials
- Spinal-cord atrophy and disability
- Clinical utility and targets for progression
Take-away
Brain and spinal-cord measures capture complementary aspects of progression, but their value rests on a clear connection to disability and treatment outcomes.
Original deck
Slide by slide
Read the 35-slide presentation in order, or use the index to jump.
Slide 01
MRI findings in Progressive Multiple Sclerosis
Open full-size slide↗Arman Eshaghi, MD, PhD
NIHR Advanced Fellow
UCL Queen Square Institute of Neurology
University College London
United Kingdom
Slide 02
Disclosures
Open full-size slide↗A.E has received research grants from the Medical Research Council (MRC), National Institute for Health and Social Care Research (NIHR), Innovate UK, Biogen, Merck, and Roche.
He serves as an advisory board member of Merck Serono and Bristol Myers Squib.
He is the founder and equity stake holder in Queen Square Analytics Limited.
He serves on the editorial board of Neurology (American Academy of Neurology).
Slide 03
Slide 3
Open full-size slide↗Slide 04
Outline
Open full-size slide↗Progressive MS
MRI signs
Quantitative MRI
Slide 05
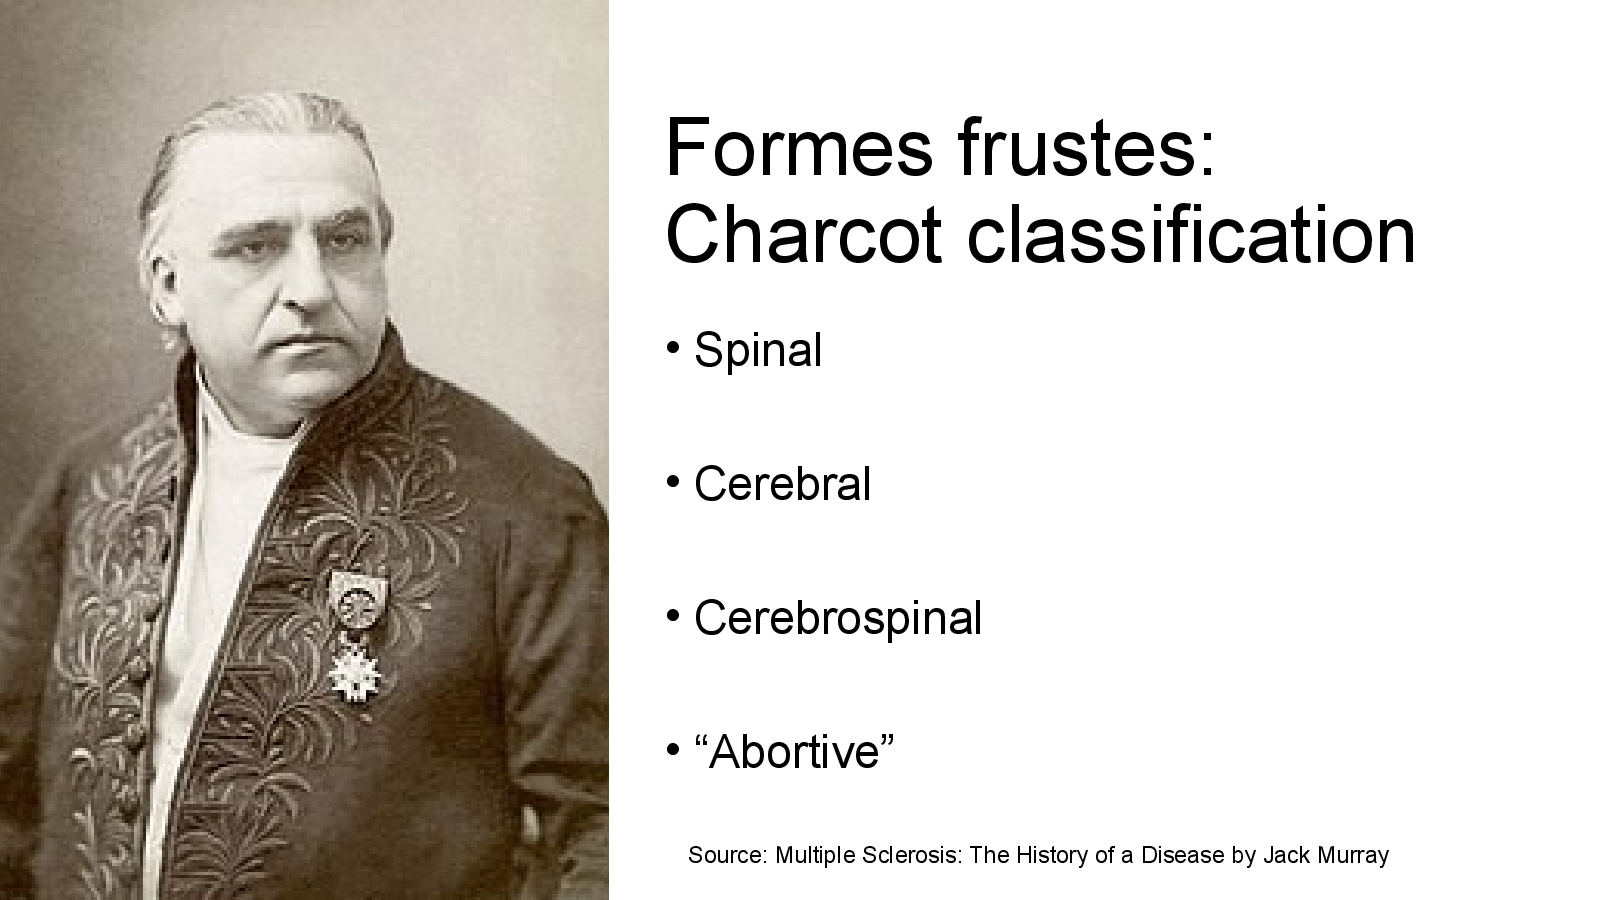
Formes frustes: Charcot classification
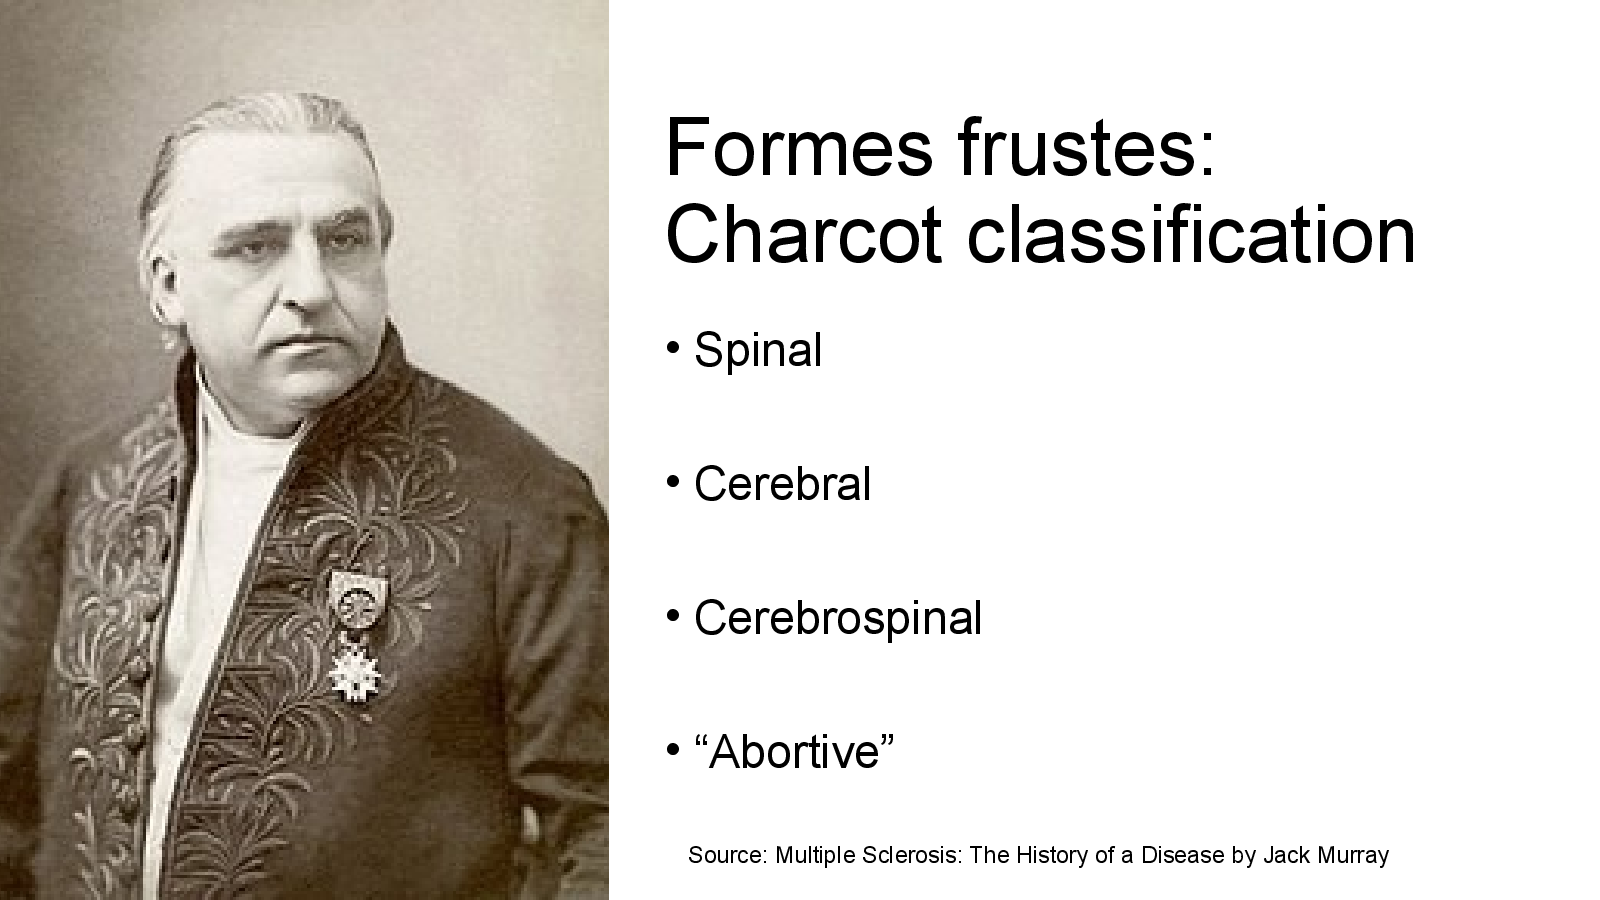
Open full-size slide↗Spinal
Cerebral
Cerebrospinal
“Abortive”
Source: Multiple Sclerosis: The History of a Disease by Jack Murray
Slide 06
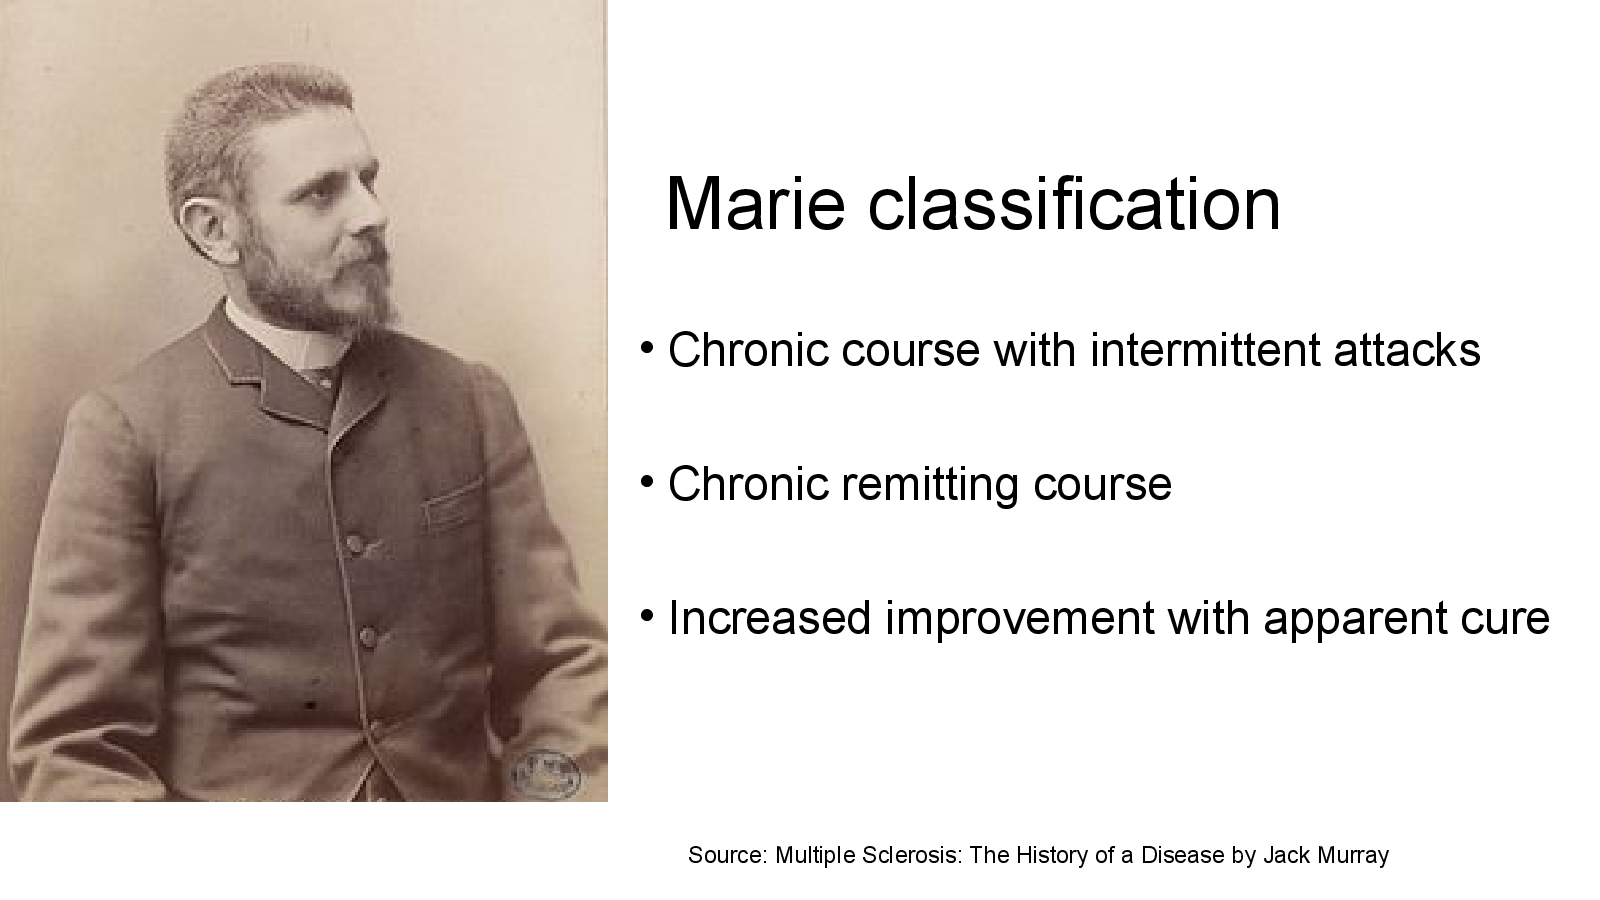
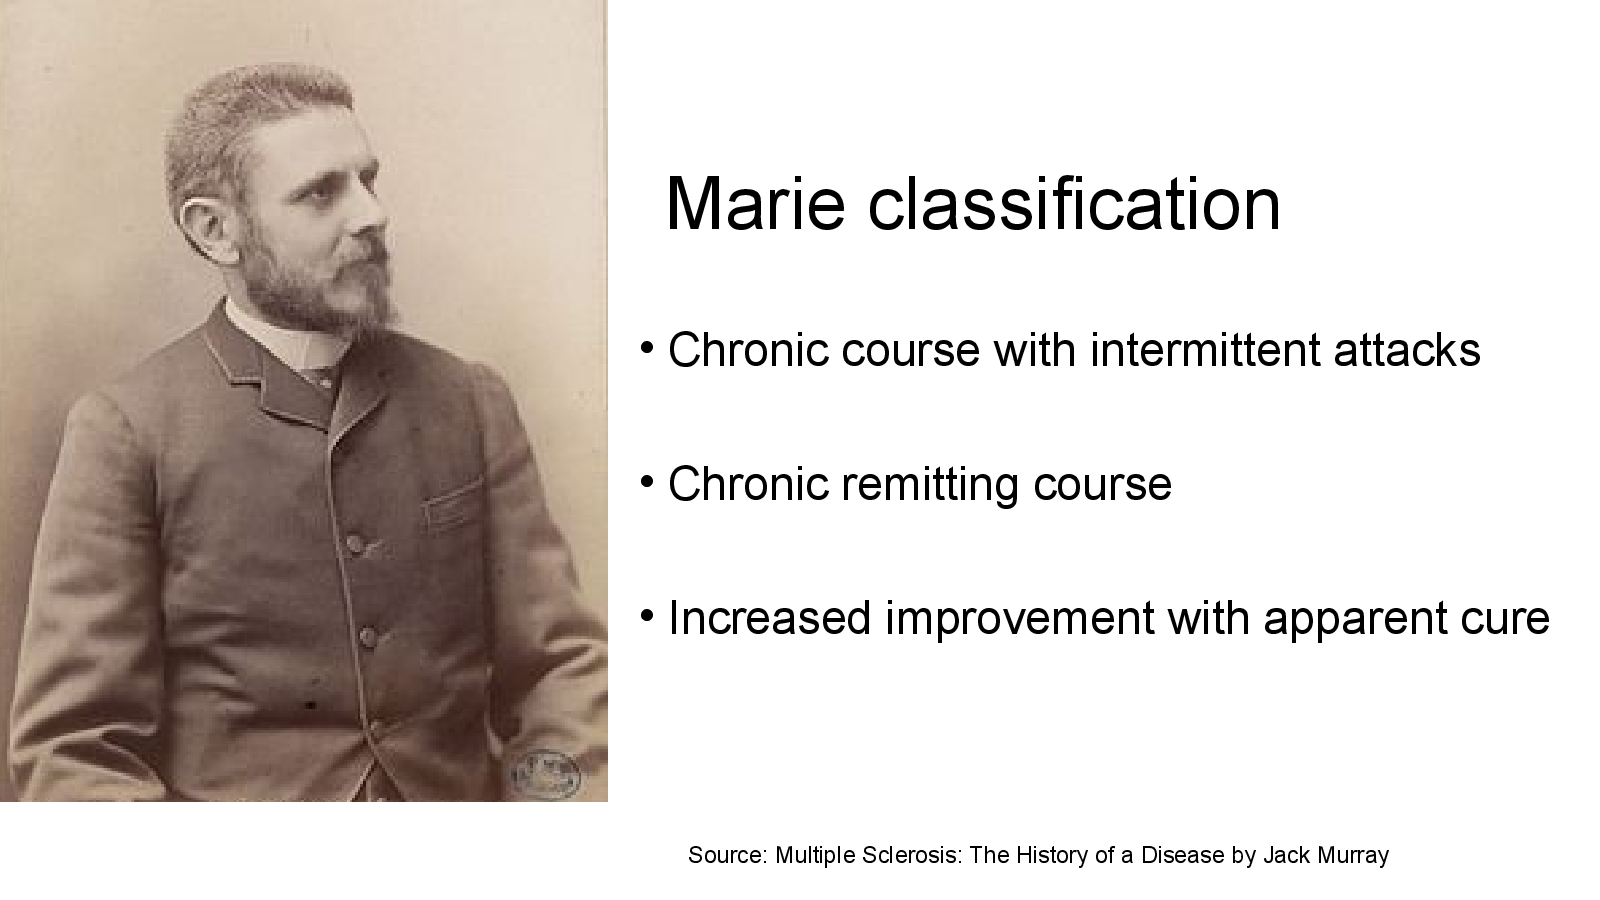
Marie classification
Open full-size slide↗Chronic course with intermittent attacks
Chronic remitting course
Increased improvement with apparent cure
Source: Multiple Sclerosis: The History of a Disease by Jack Murray
Slide 07
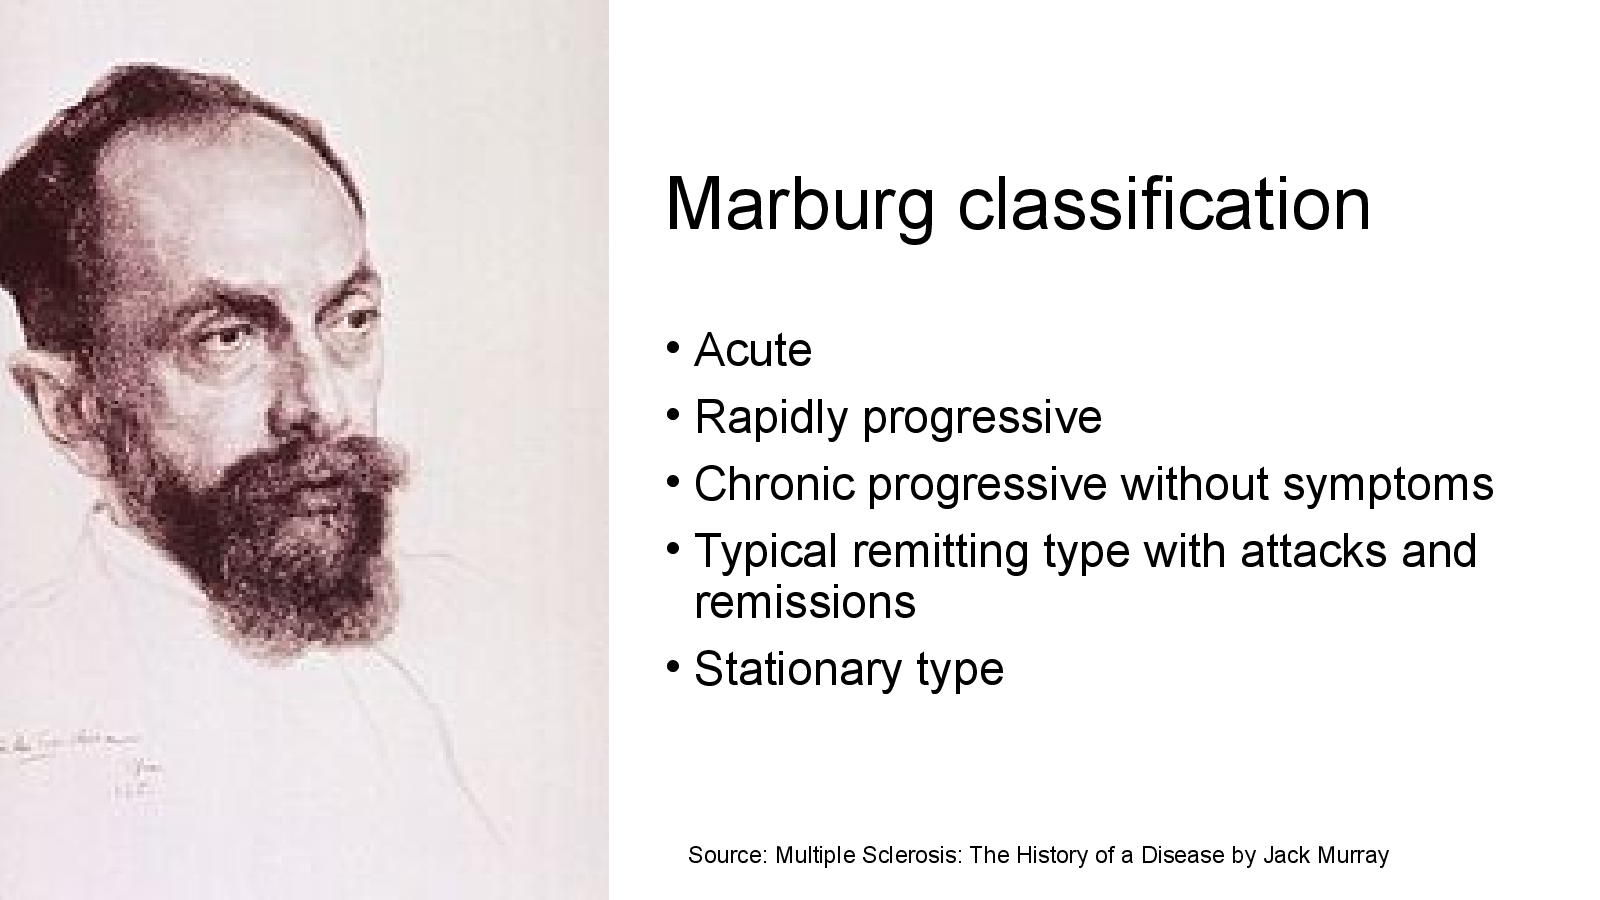
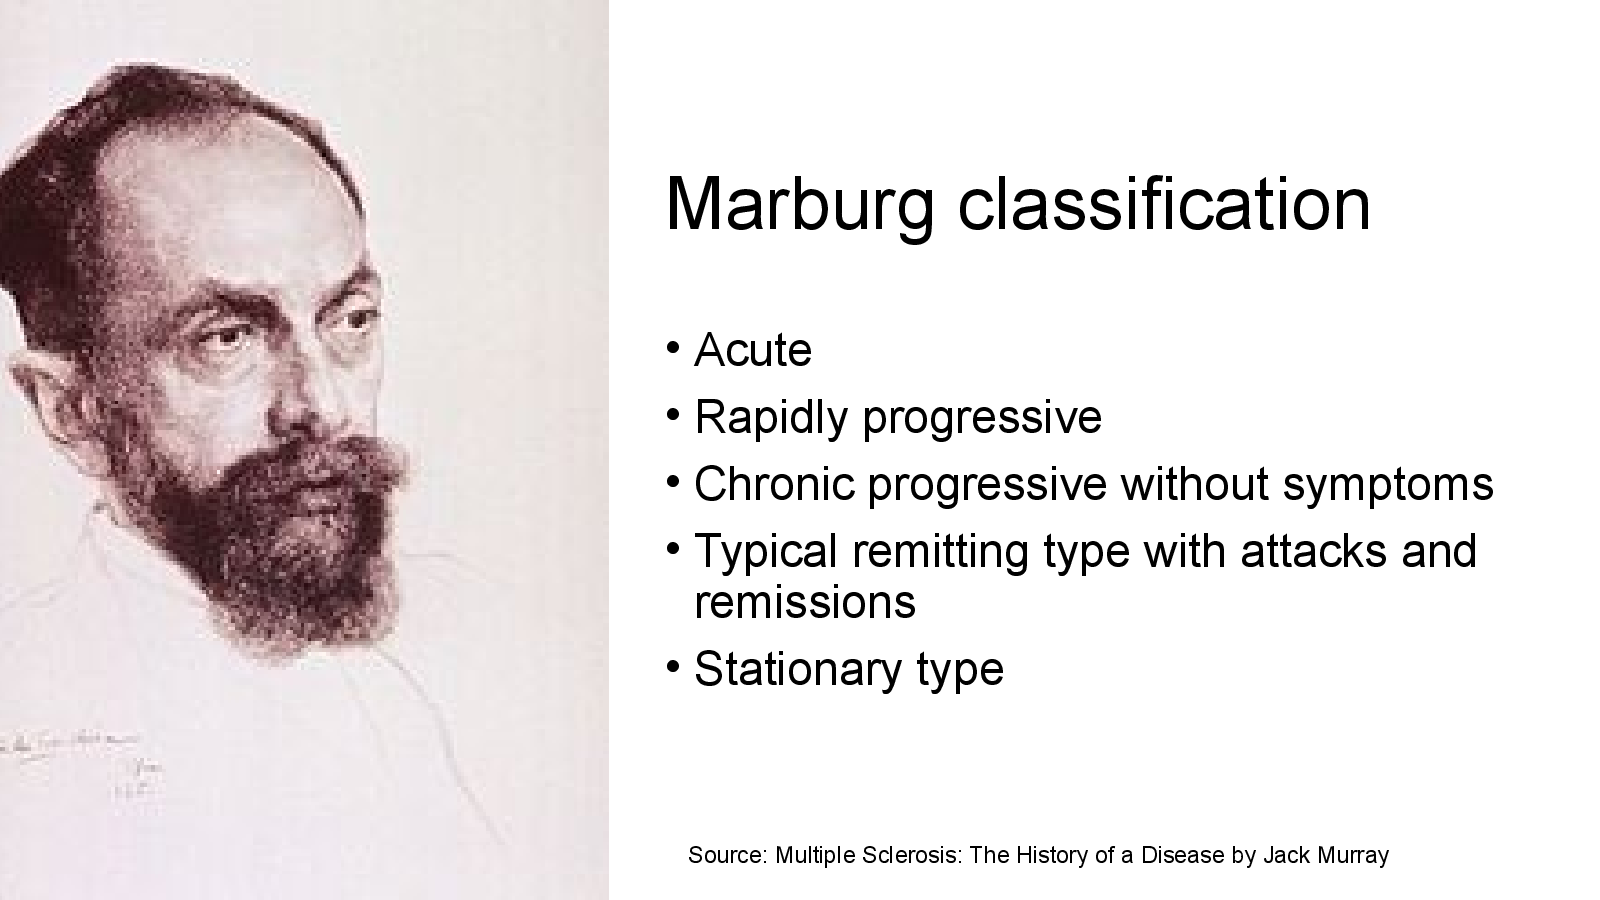
Marburg classification
Open full-size slide↗Acute
Rapidly progressive
Chronic progressive without symptoms
Typical remitting type with attacks and remissions
Stationary type
Source: Multiple Sclerosis: The History of a Disease by Jack Murray
Slide 08
George A. Schumacher
Open full-size slide↗Ian MacDonald
John Kurtzke
Donald Paty
Slide 09
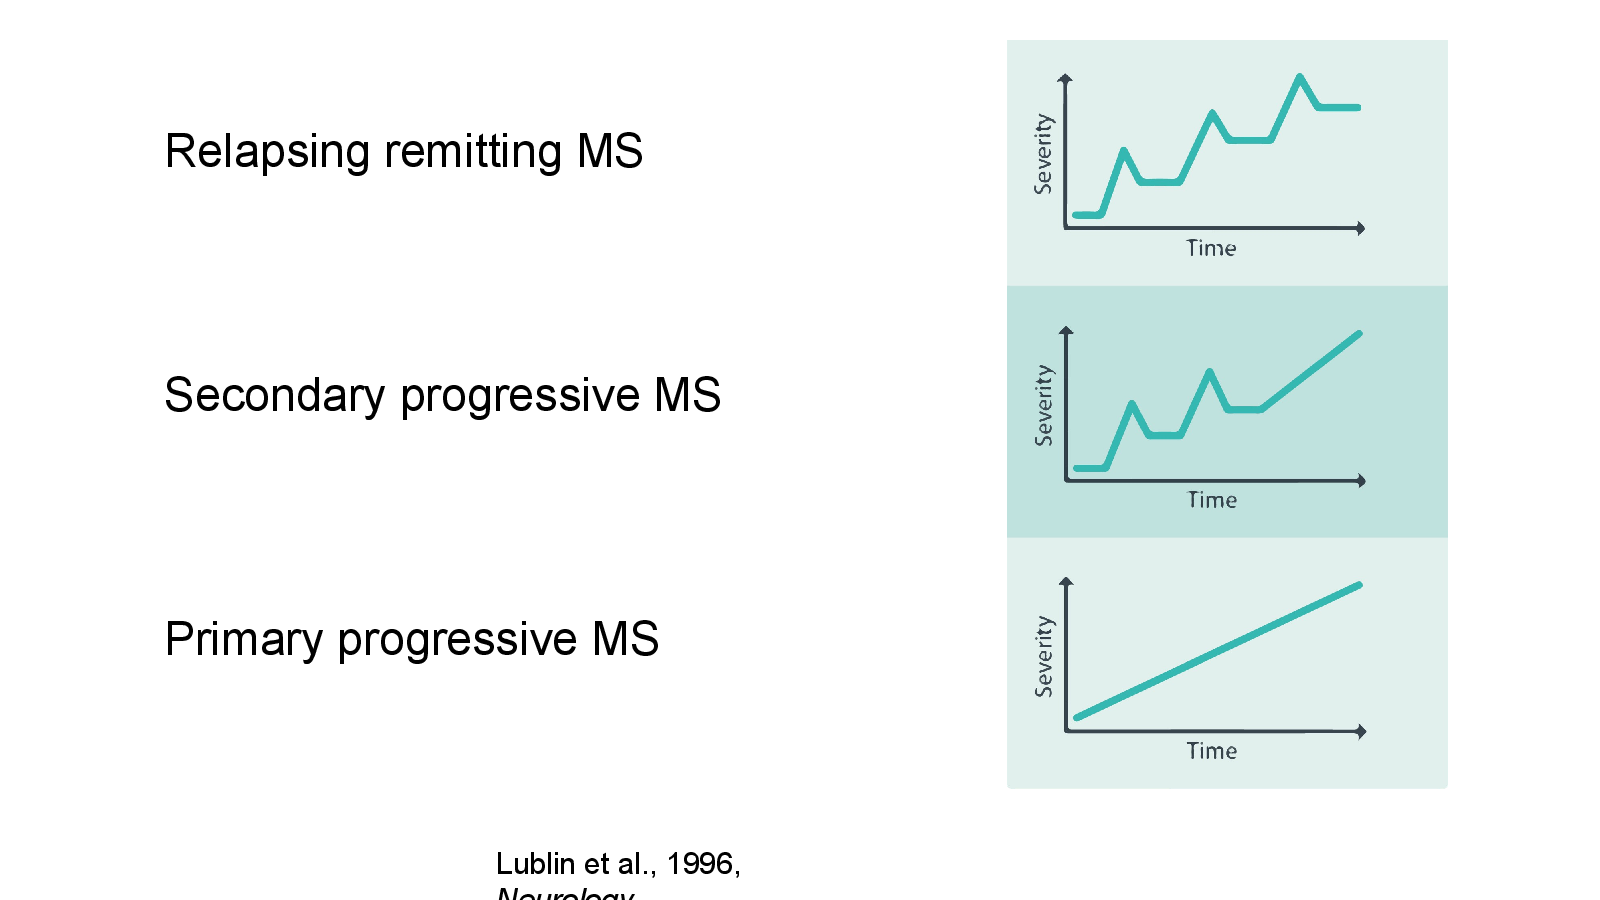
Lublin et al., 1996, Neurology
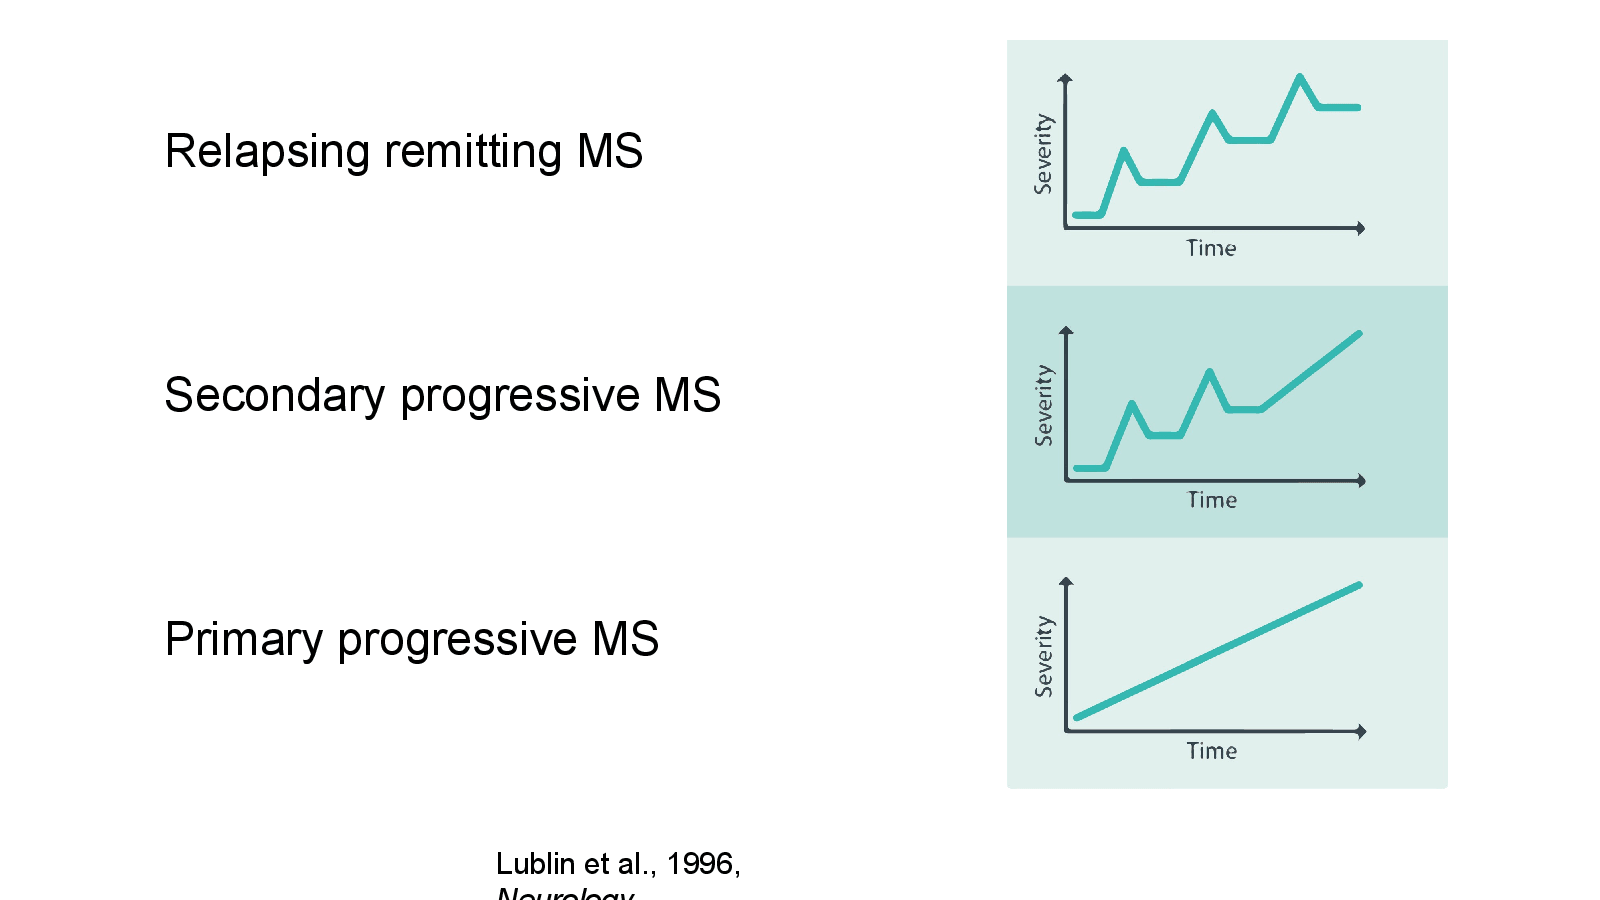
Open full-size slide↗Relapsing remitting MS
Secondary progressive MS
Primary progressive MS
Speaker notes+
- Start by: one of the main reasons for suboptimal treatment selection is ….
References
Slide 10
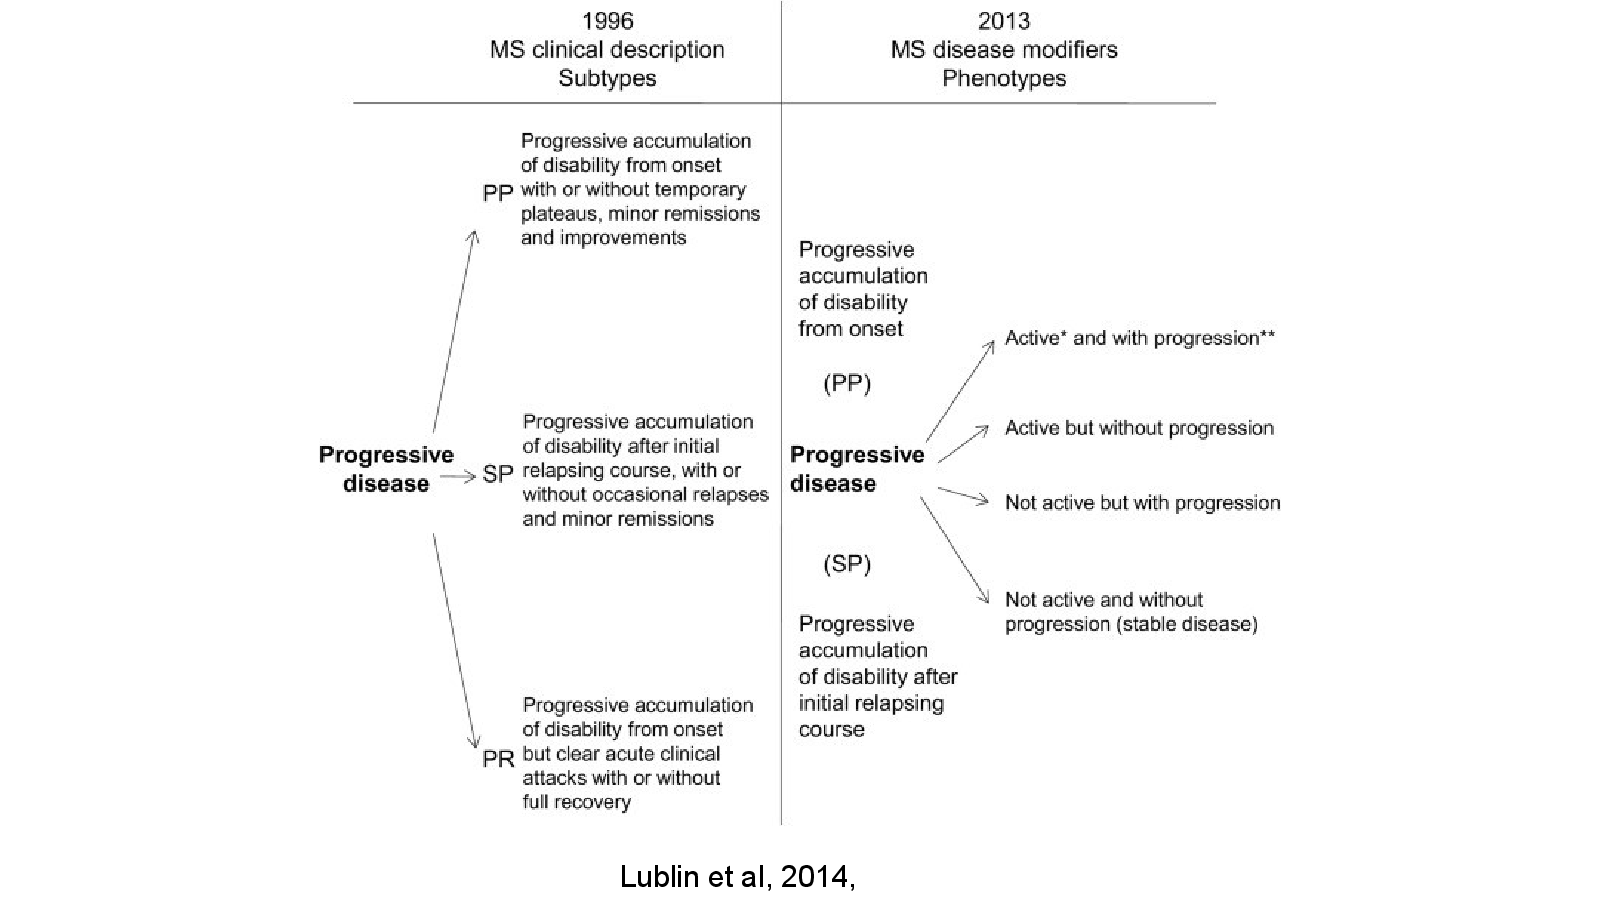
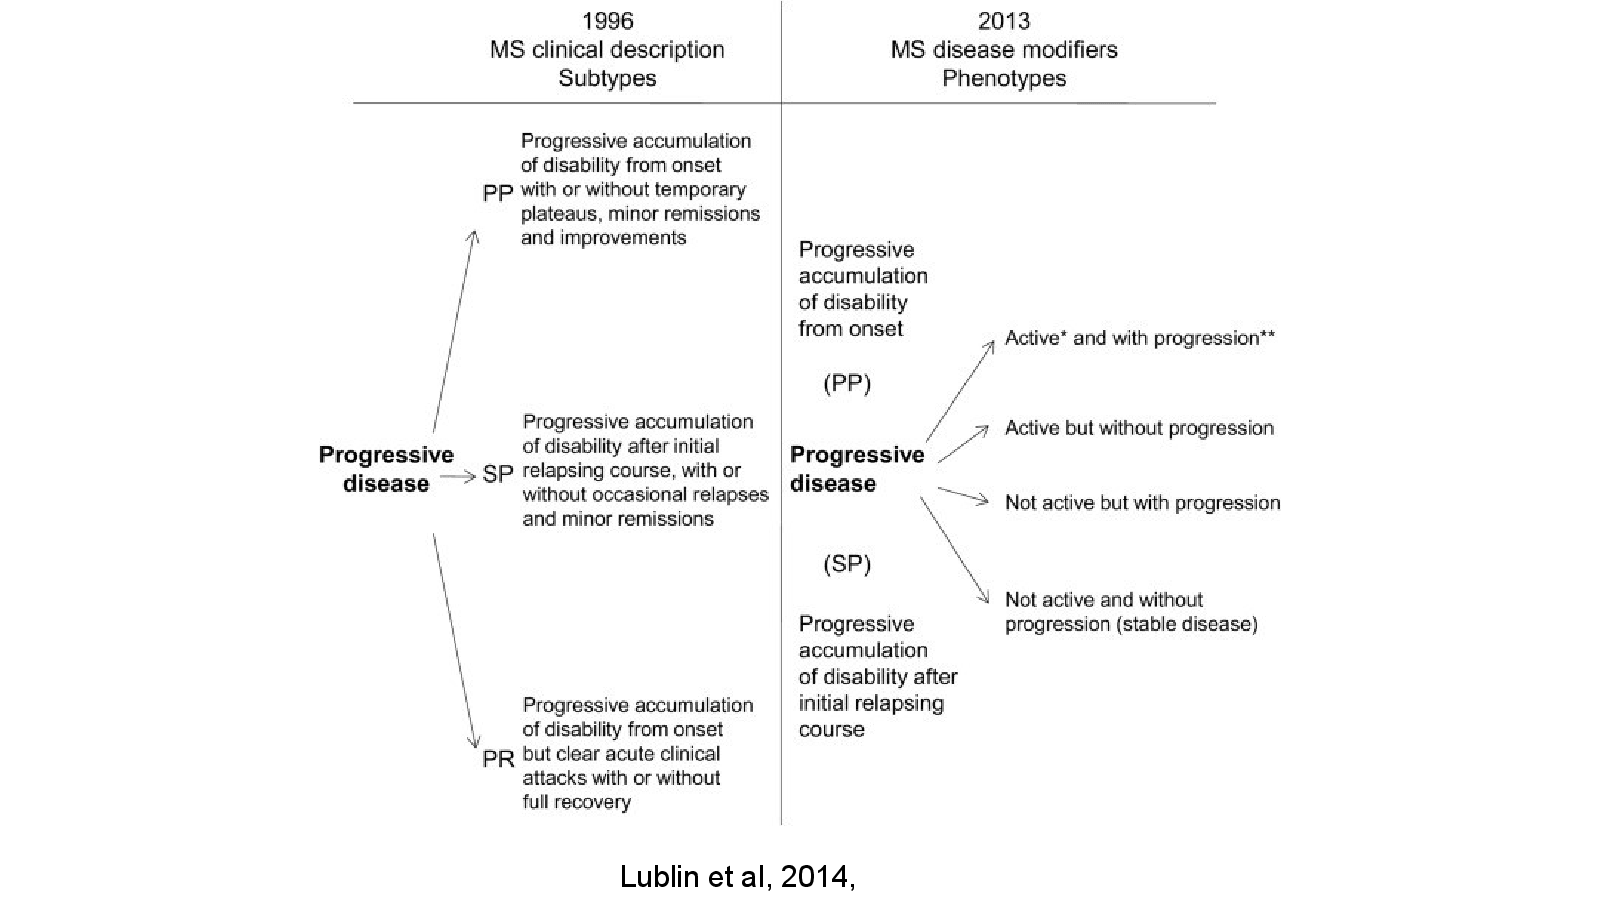
Lublin et al, 2014, Neurology
Open full-size slide↗References
Slide 11
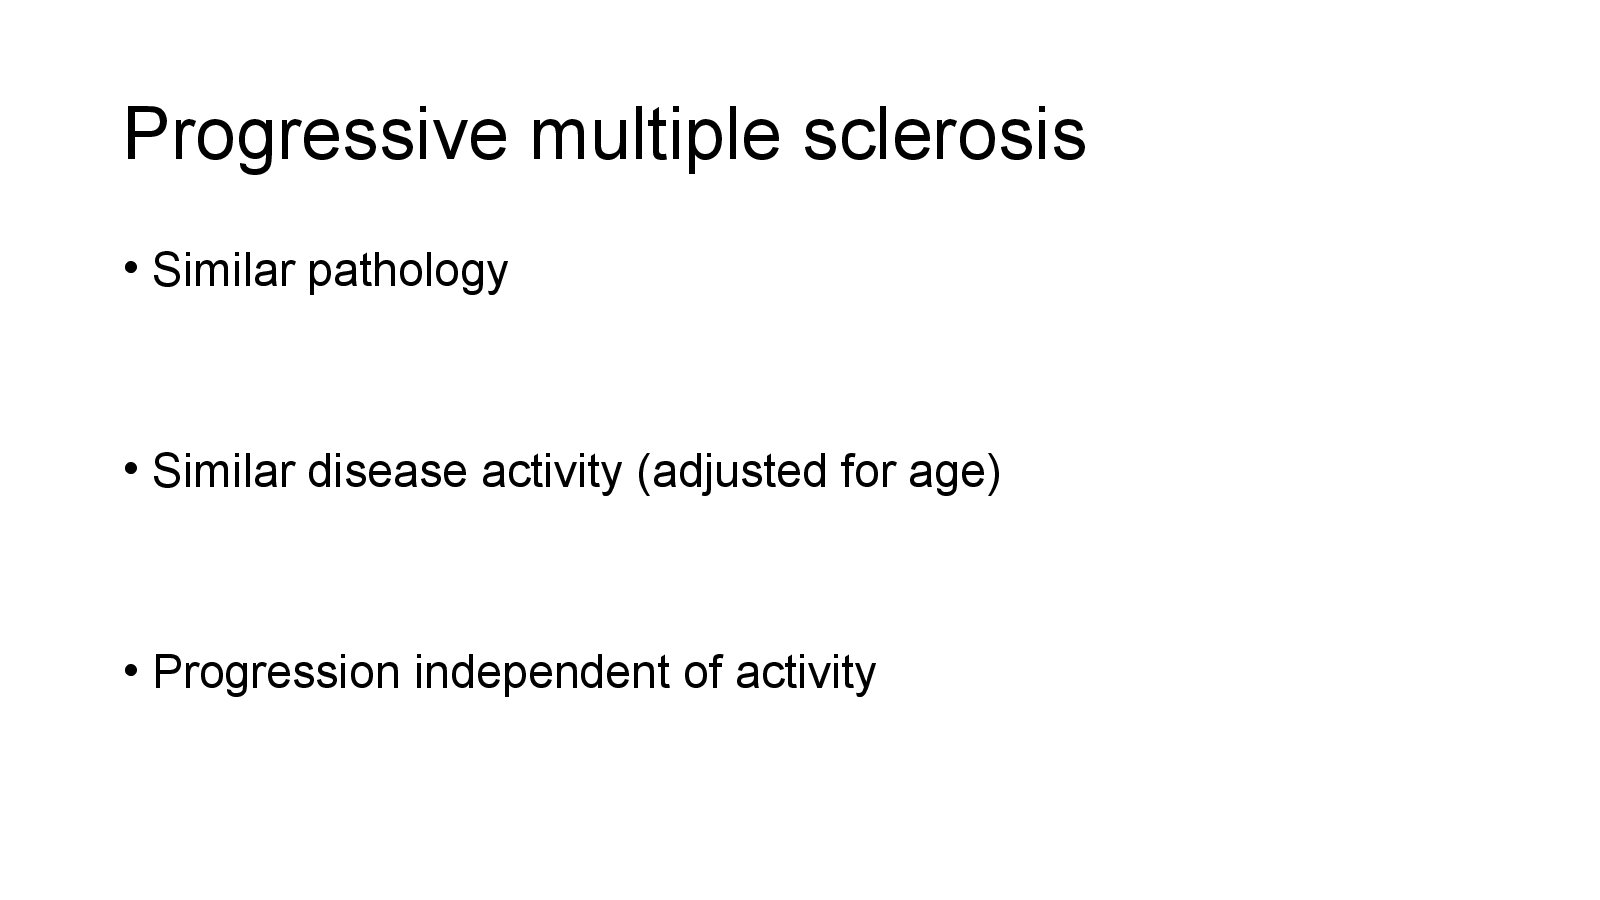
Progressive multiple sclerosis
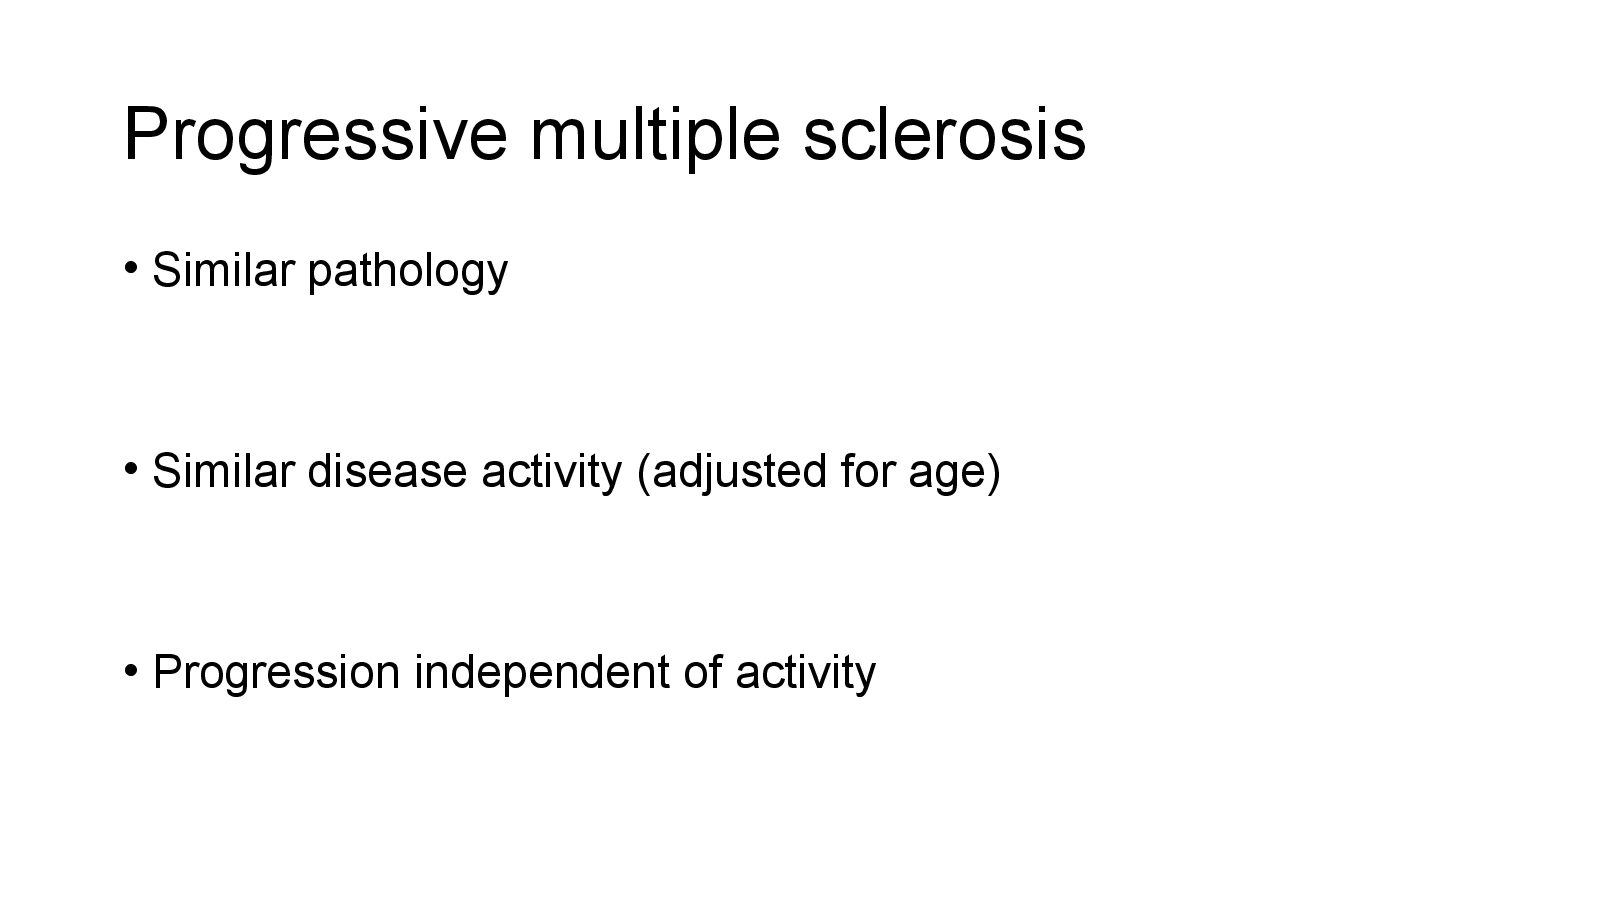
Open full-size slide↗Similar pathology
Similar disease activity (adjusted for age)
Progression independent of activity
Slide 12
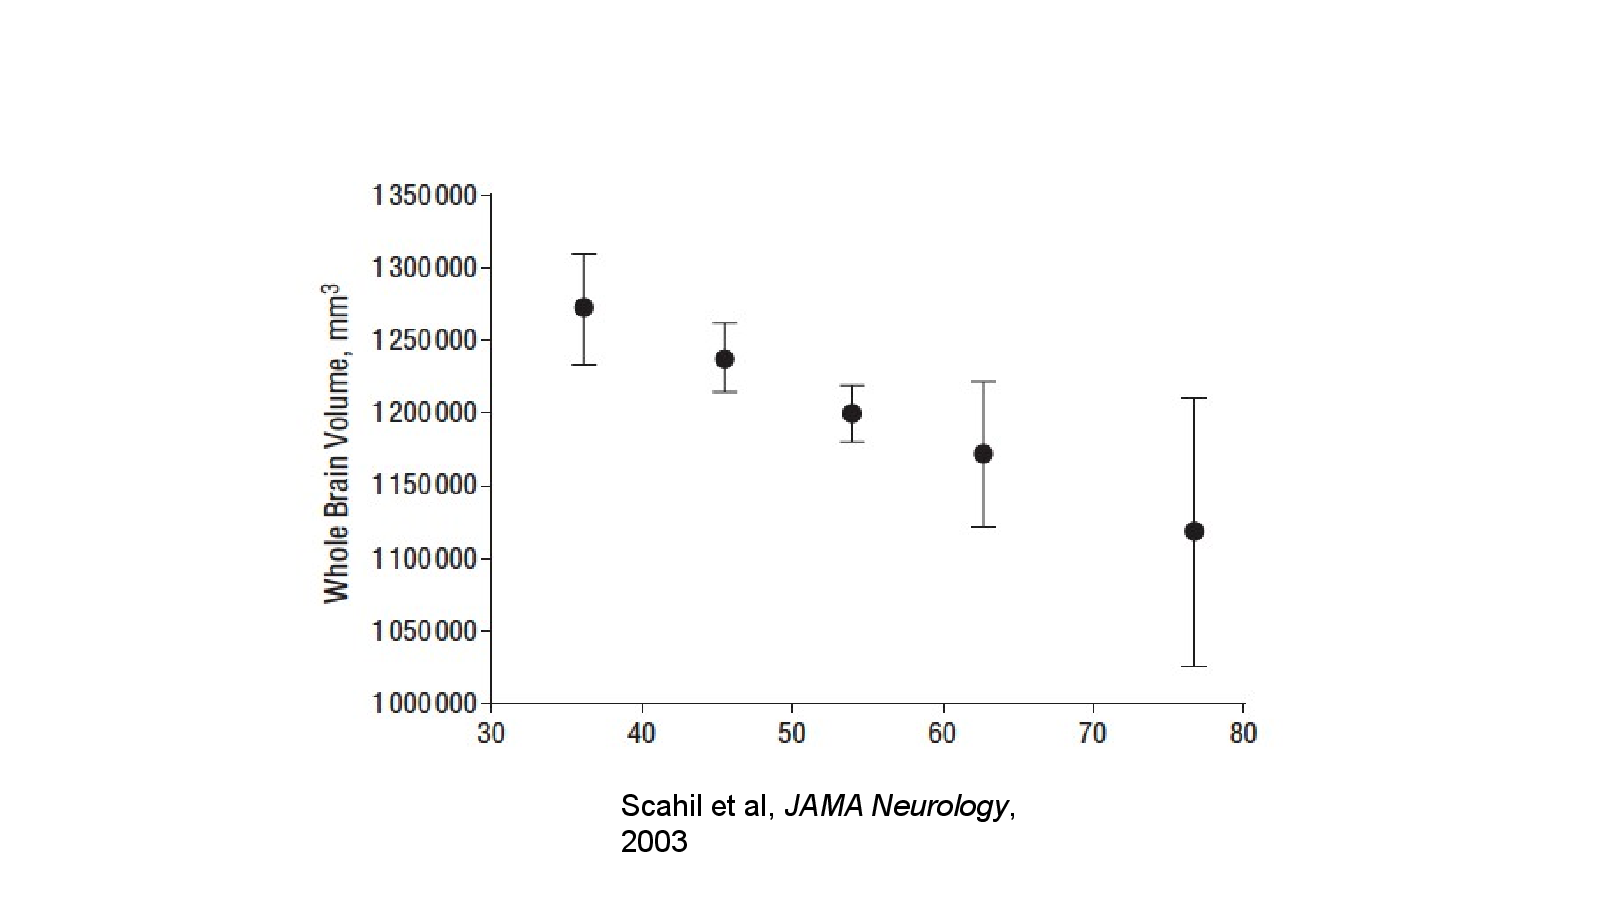
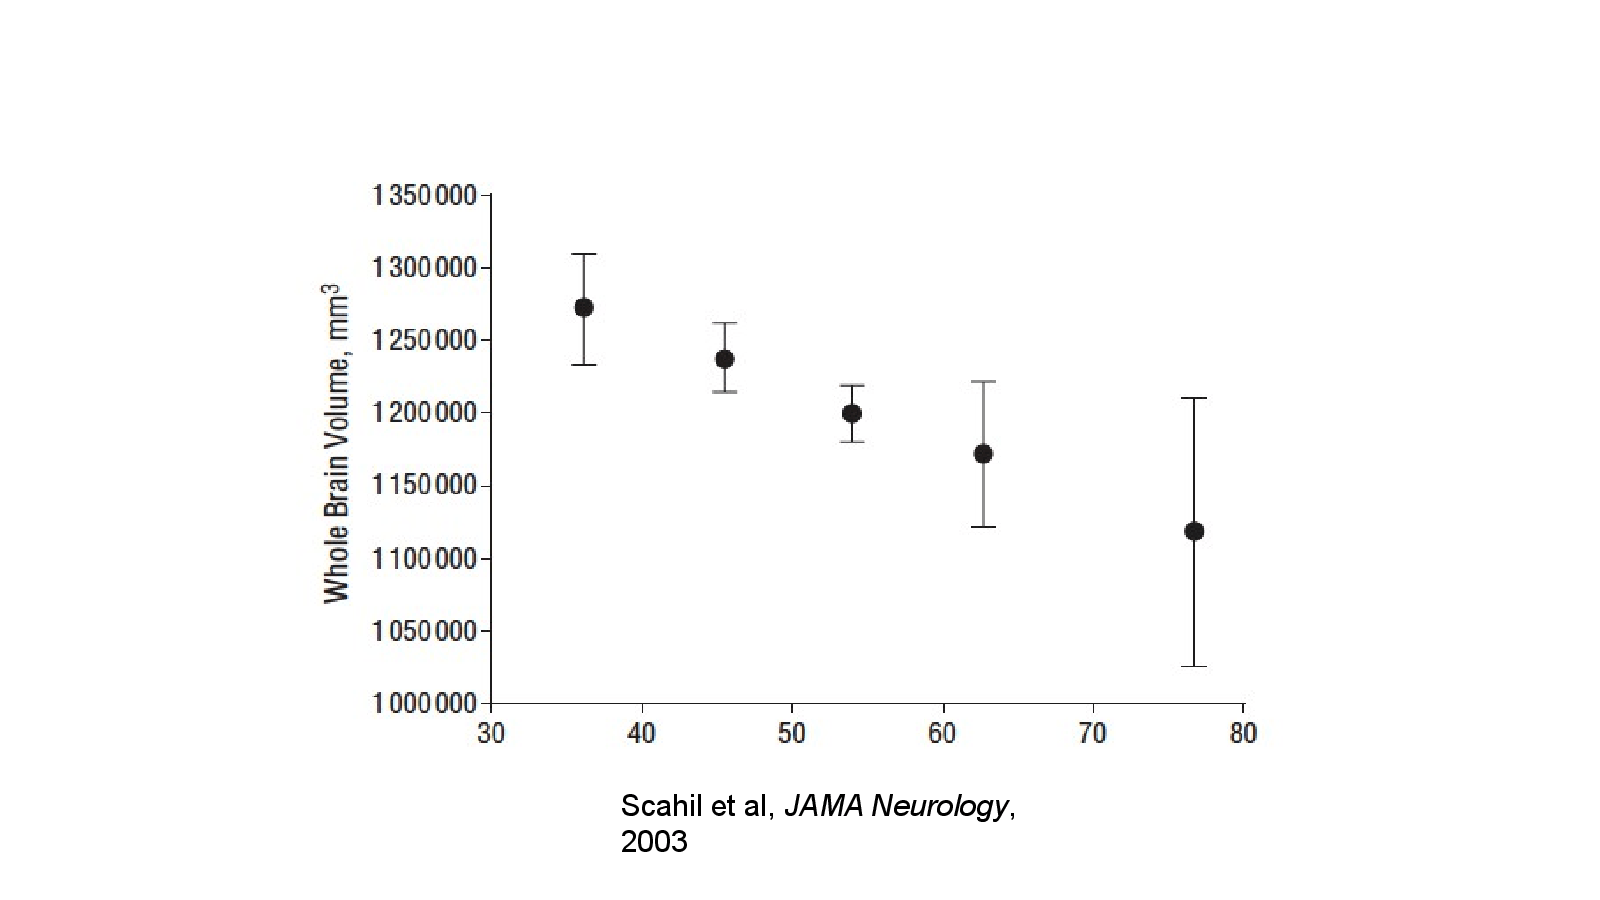
Scahil et al, JAMA Neurology, 2003
Open full-size slide↗References
Slide 13
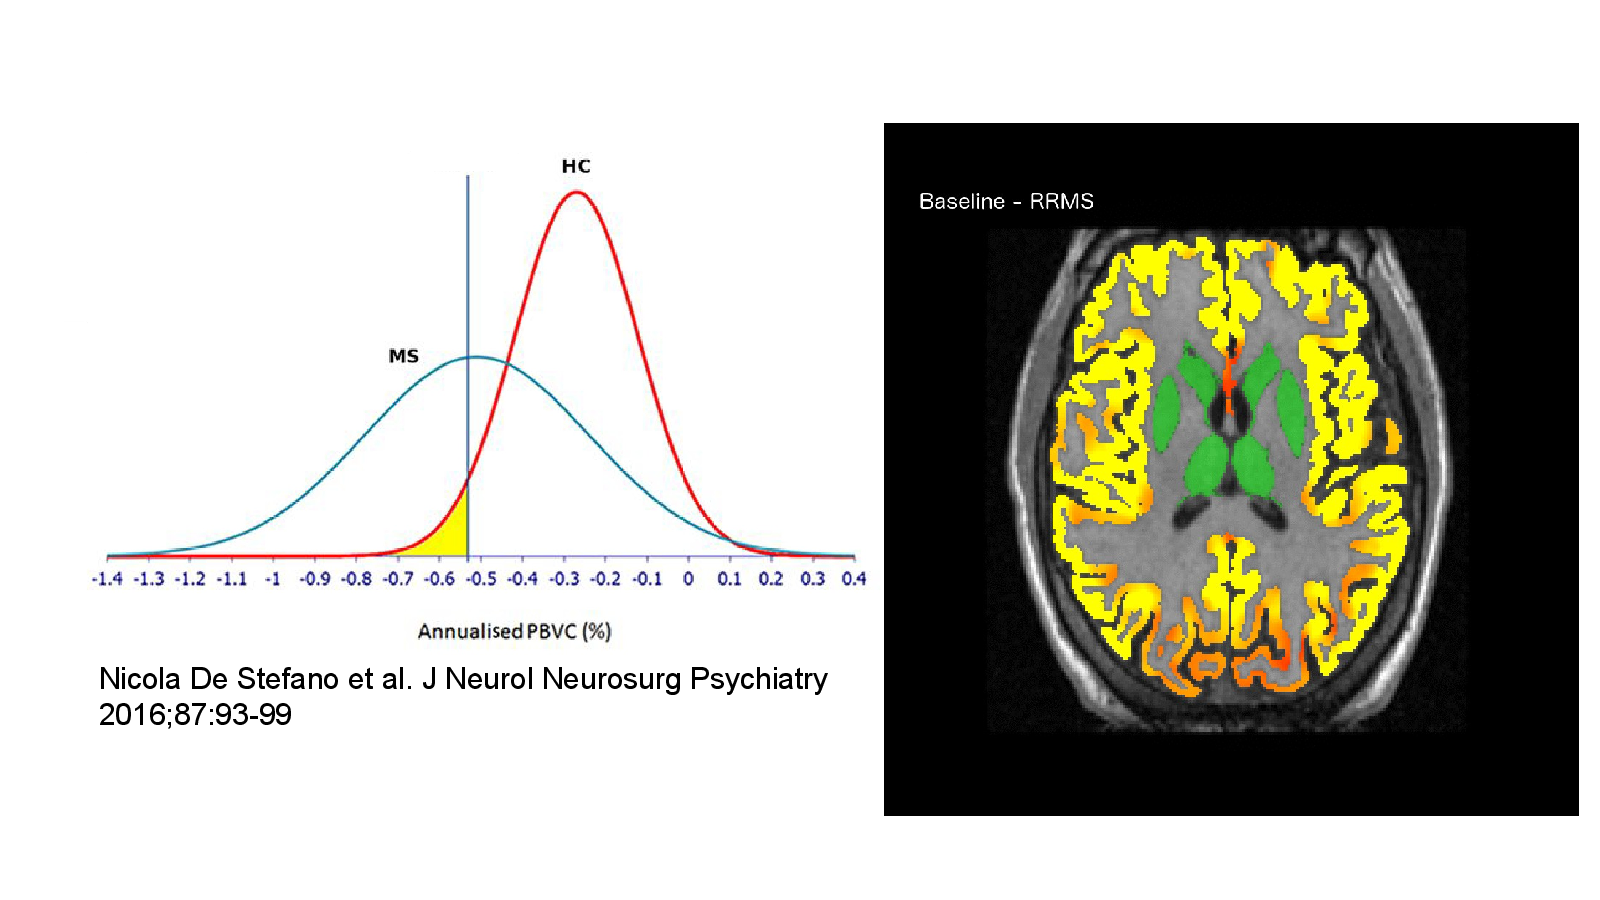
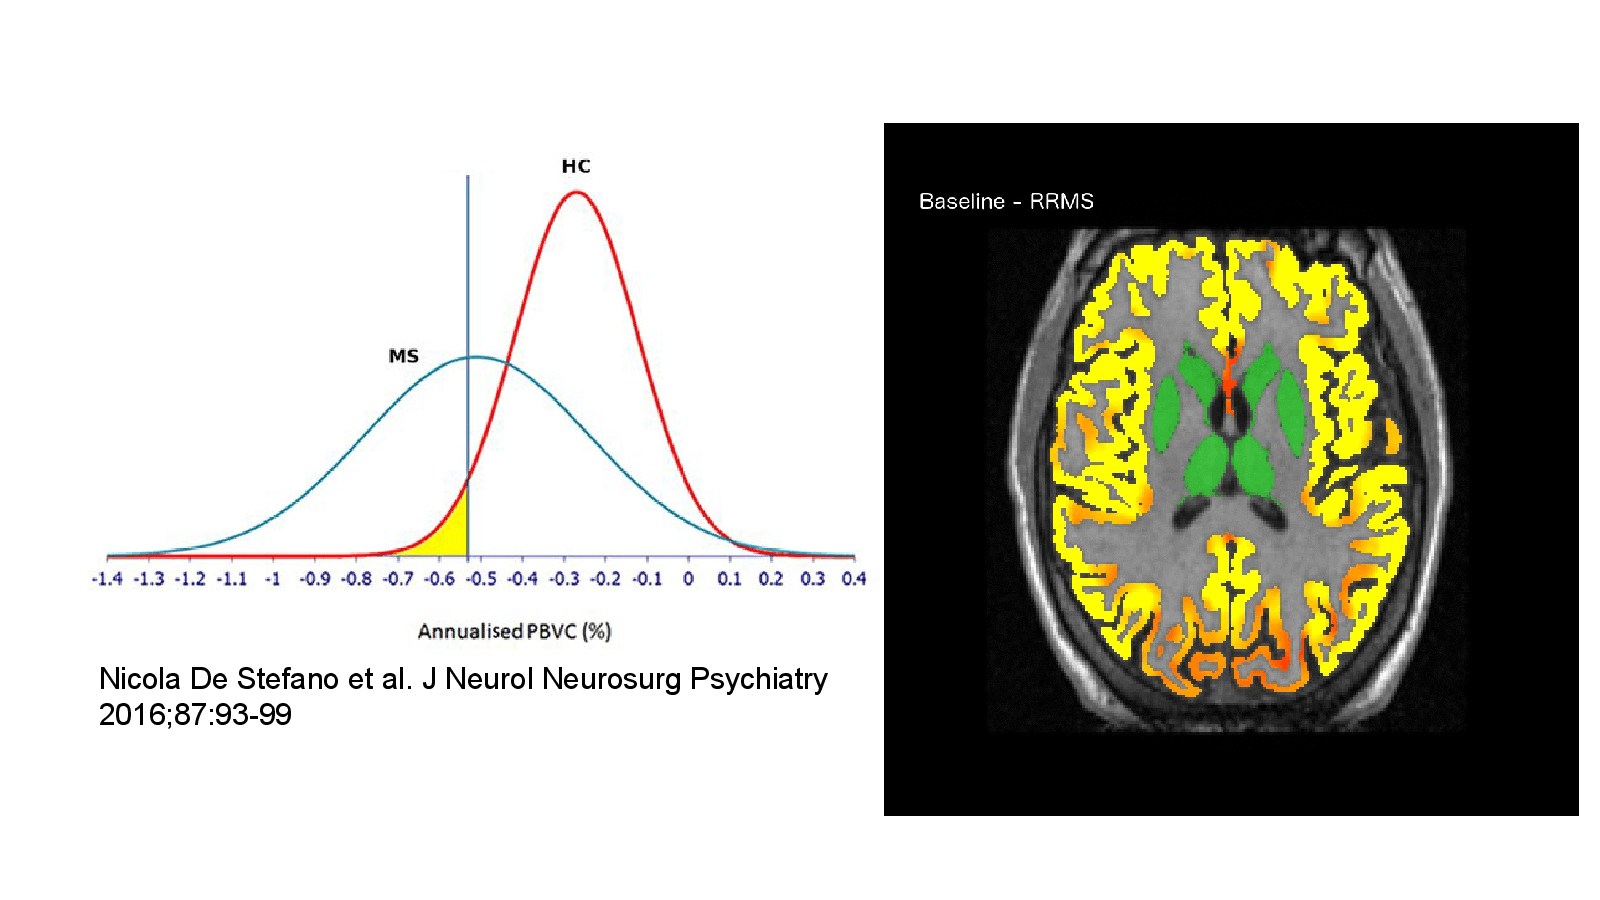
Nicola De Stefano et al. J Neurol Neurosurg Psychiatry 2016;87:93-99
Open full-size slide↗References
Slide 14
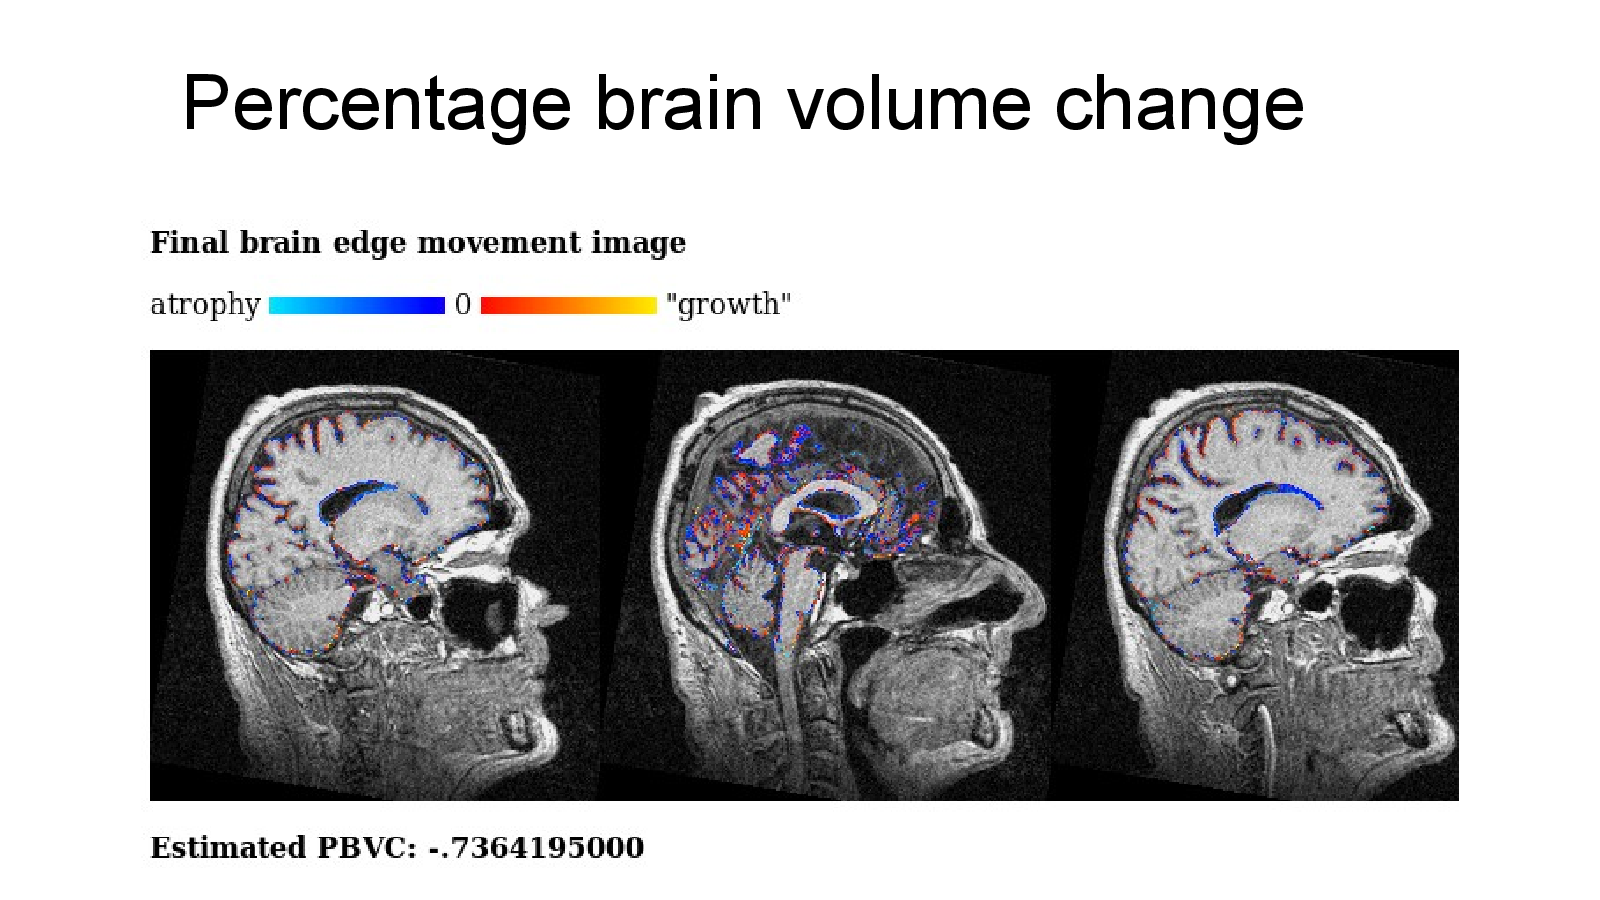
Percentage brain volume change
Open full-size slide↗Slide 15
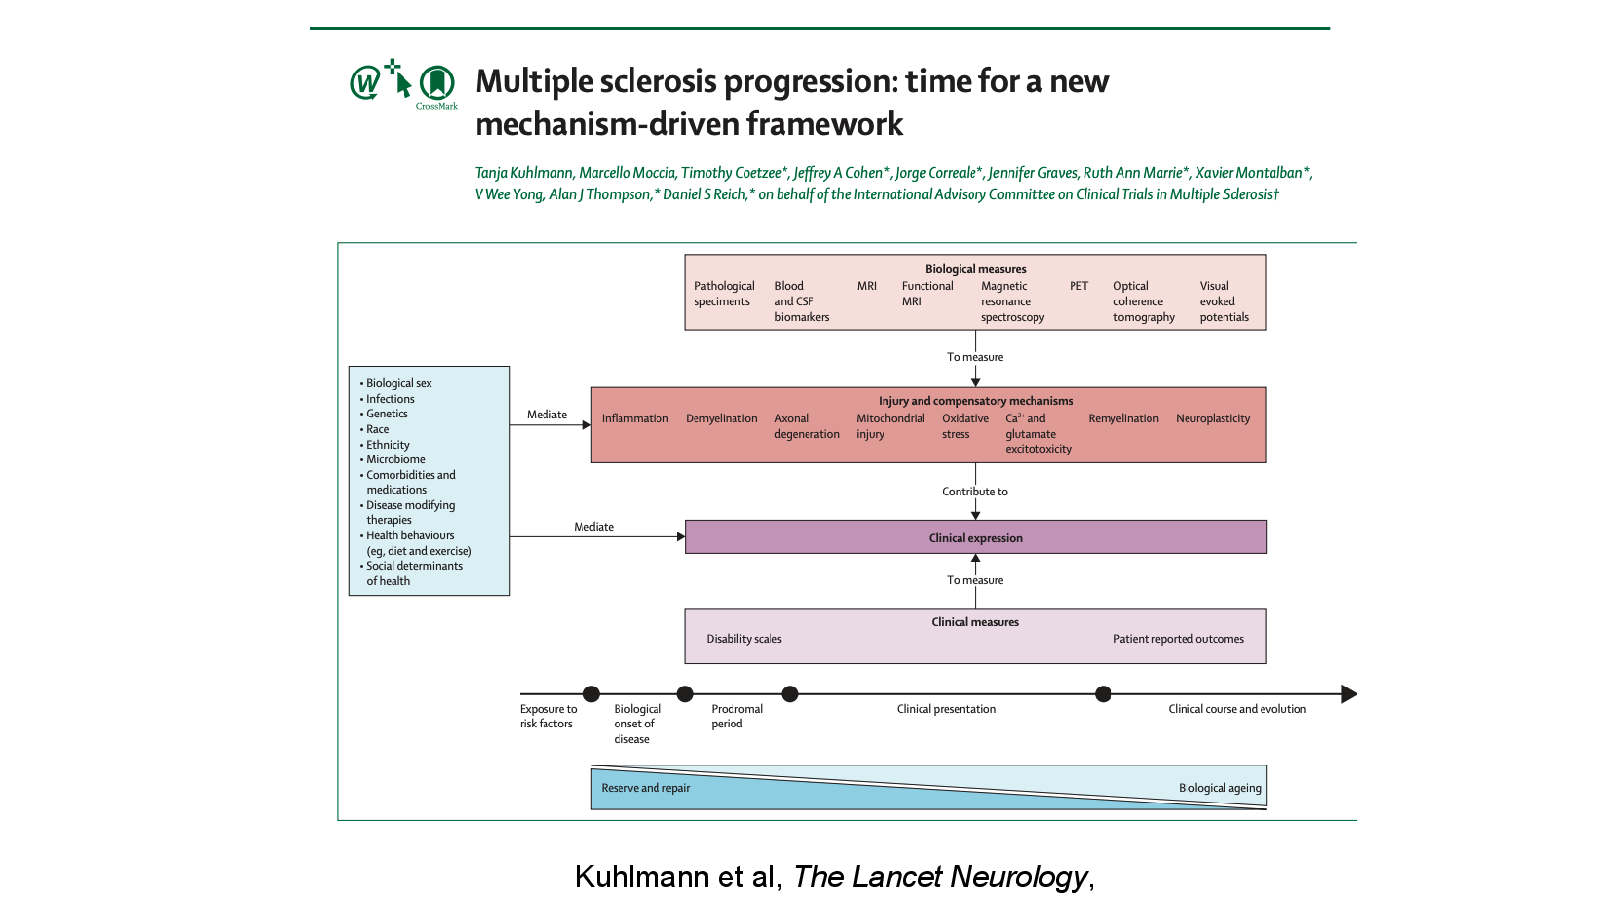
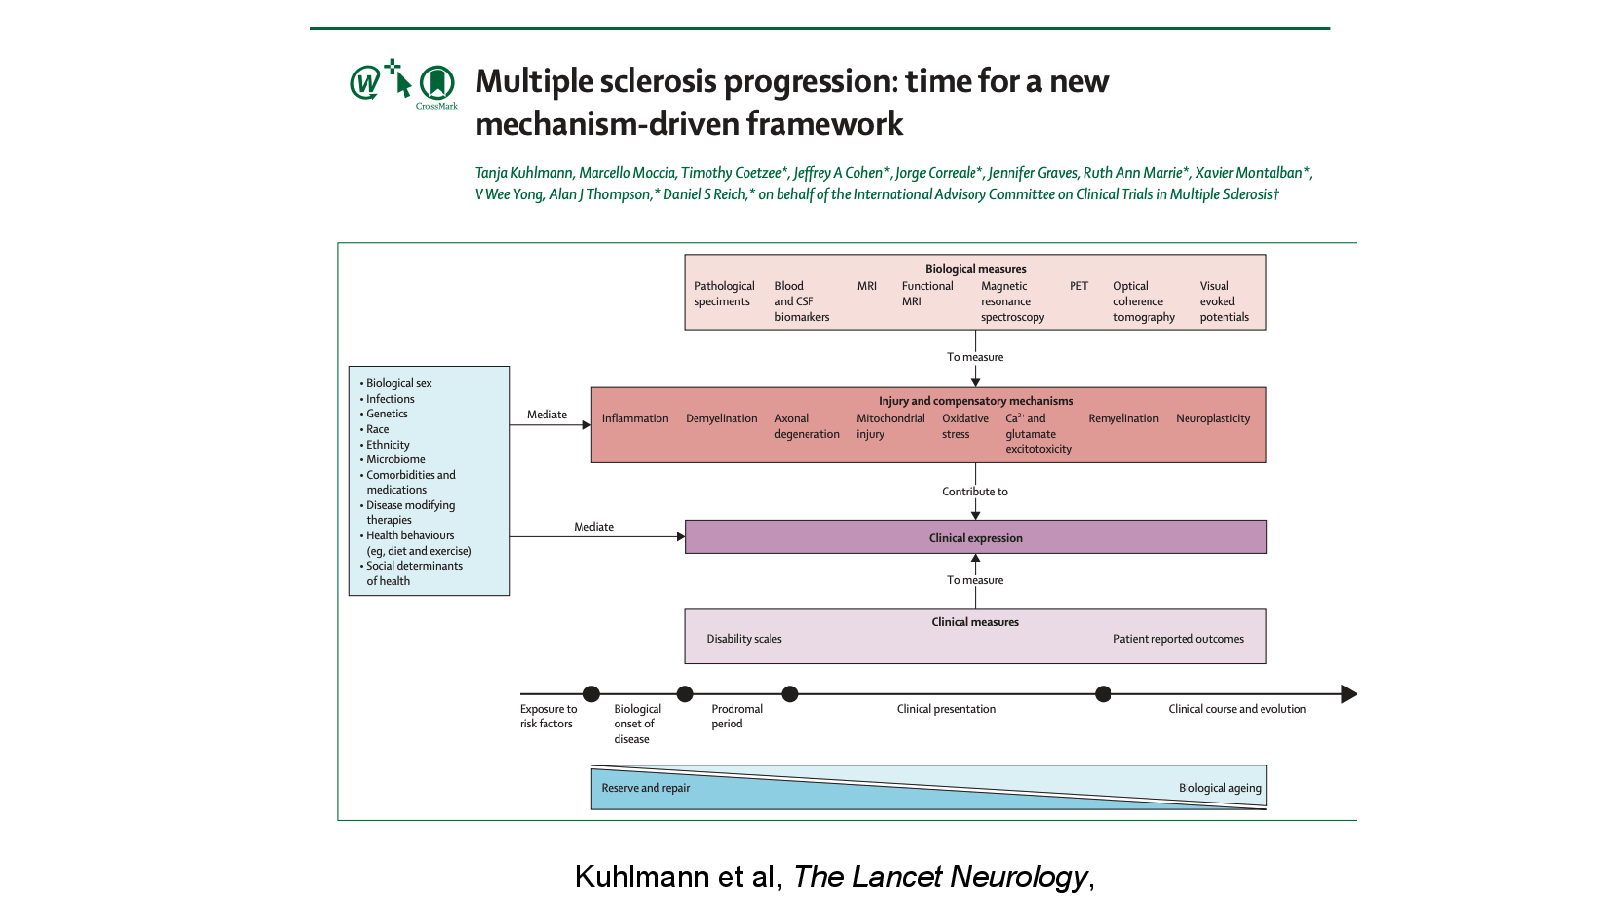
Kuhlmann et al, The Lancet Neurology, 2022
Open full-size slide↗References
Slide 16
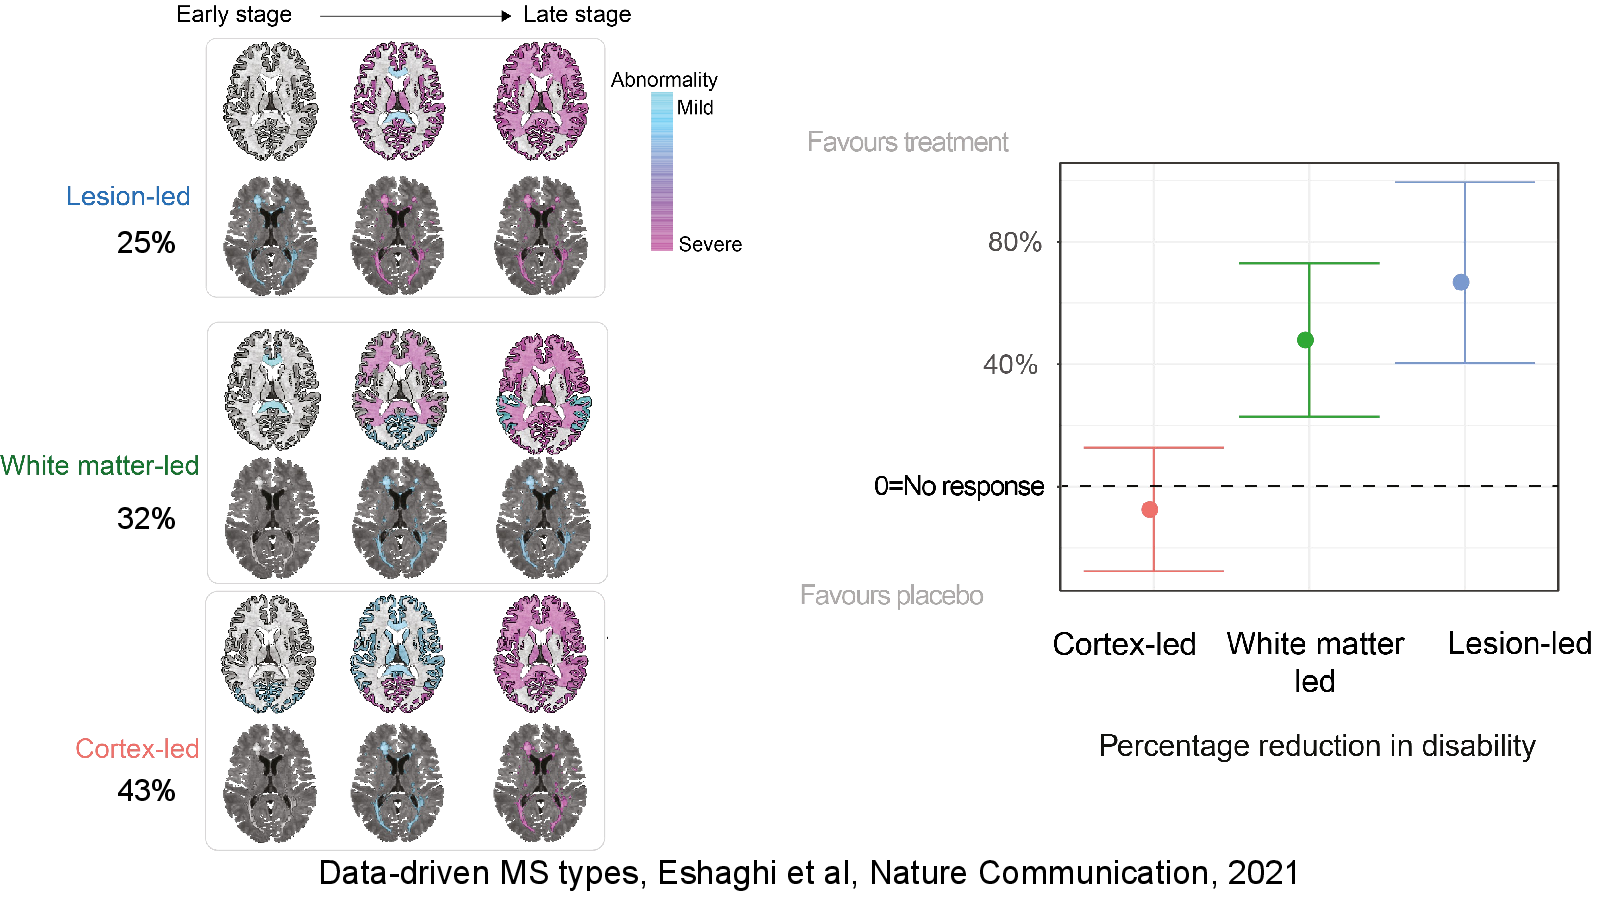
Data-driven MS types, Eshaghi et al, Nature Communication, 2021
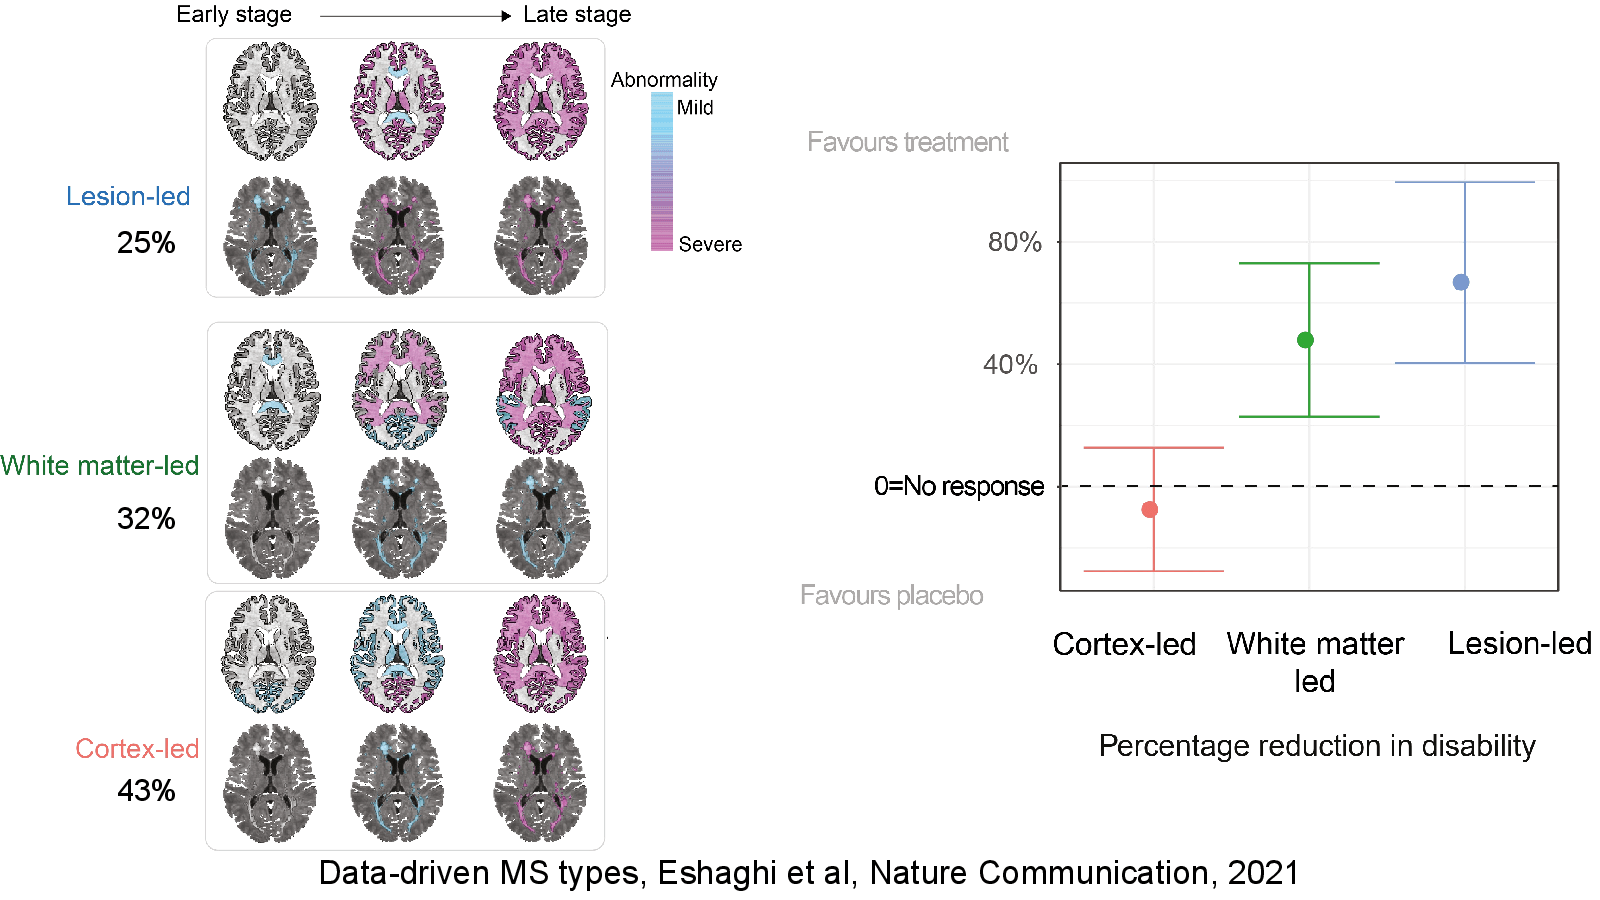
Open full-size slide↗25%
32%
43%
References
Slide 17
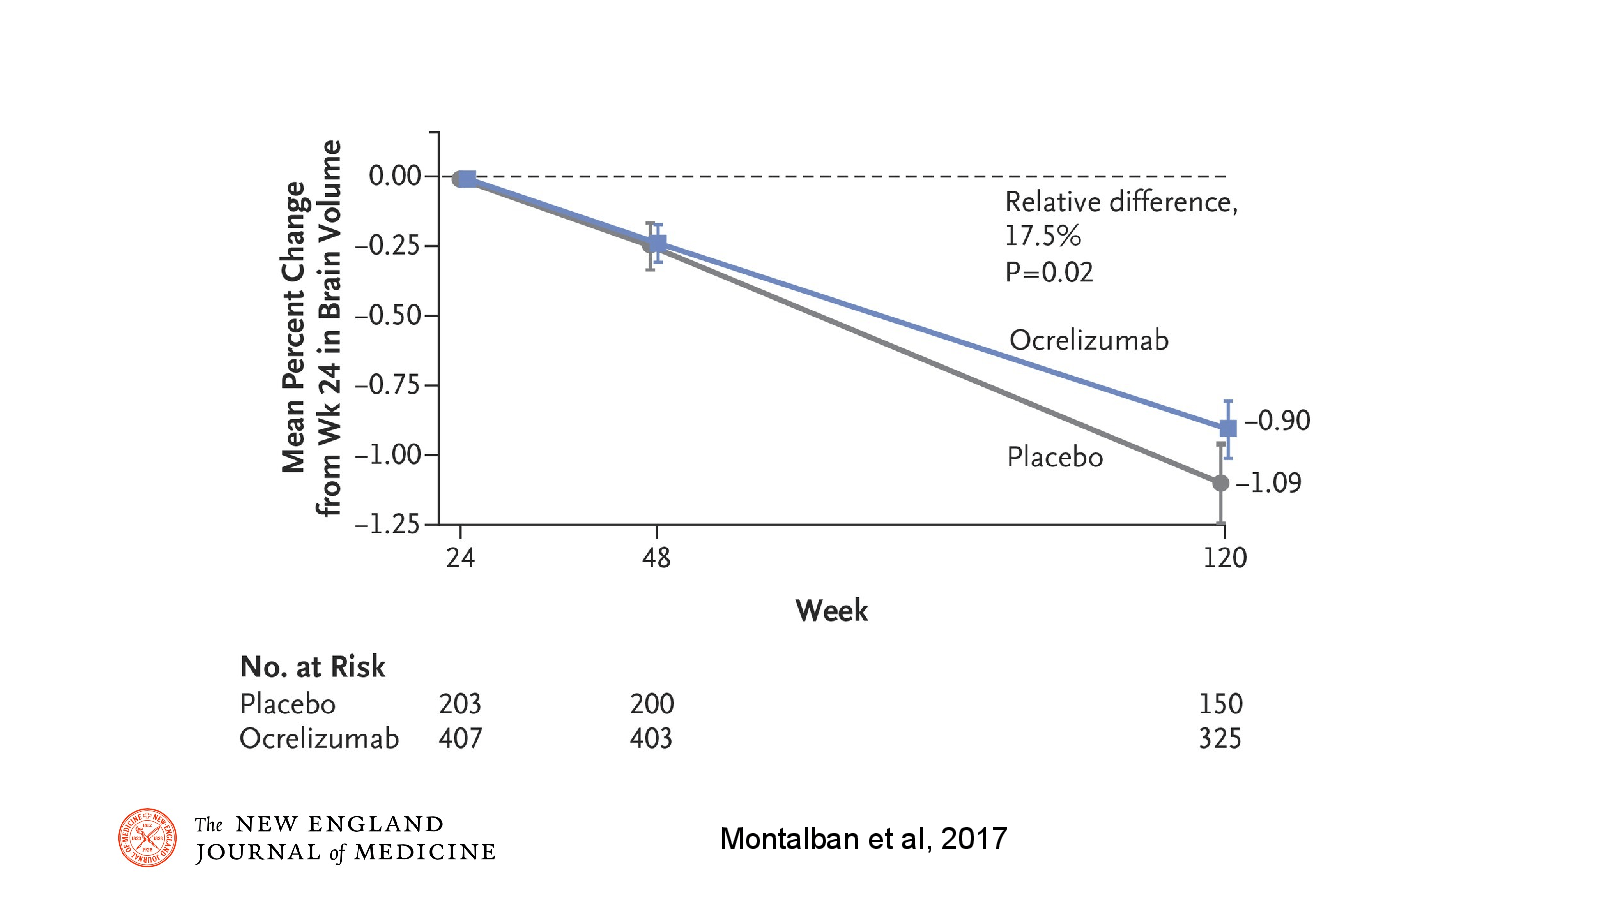
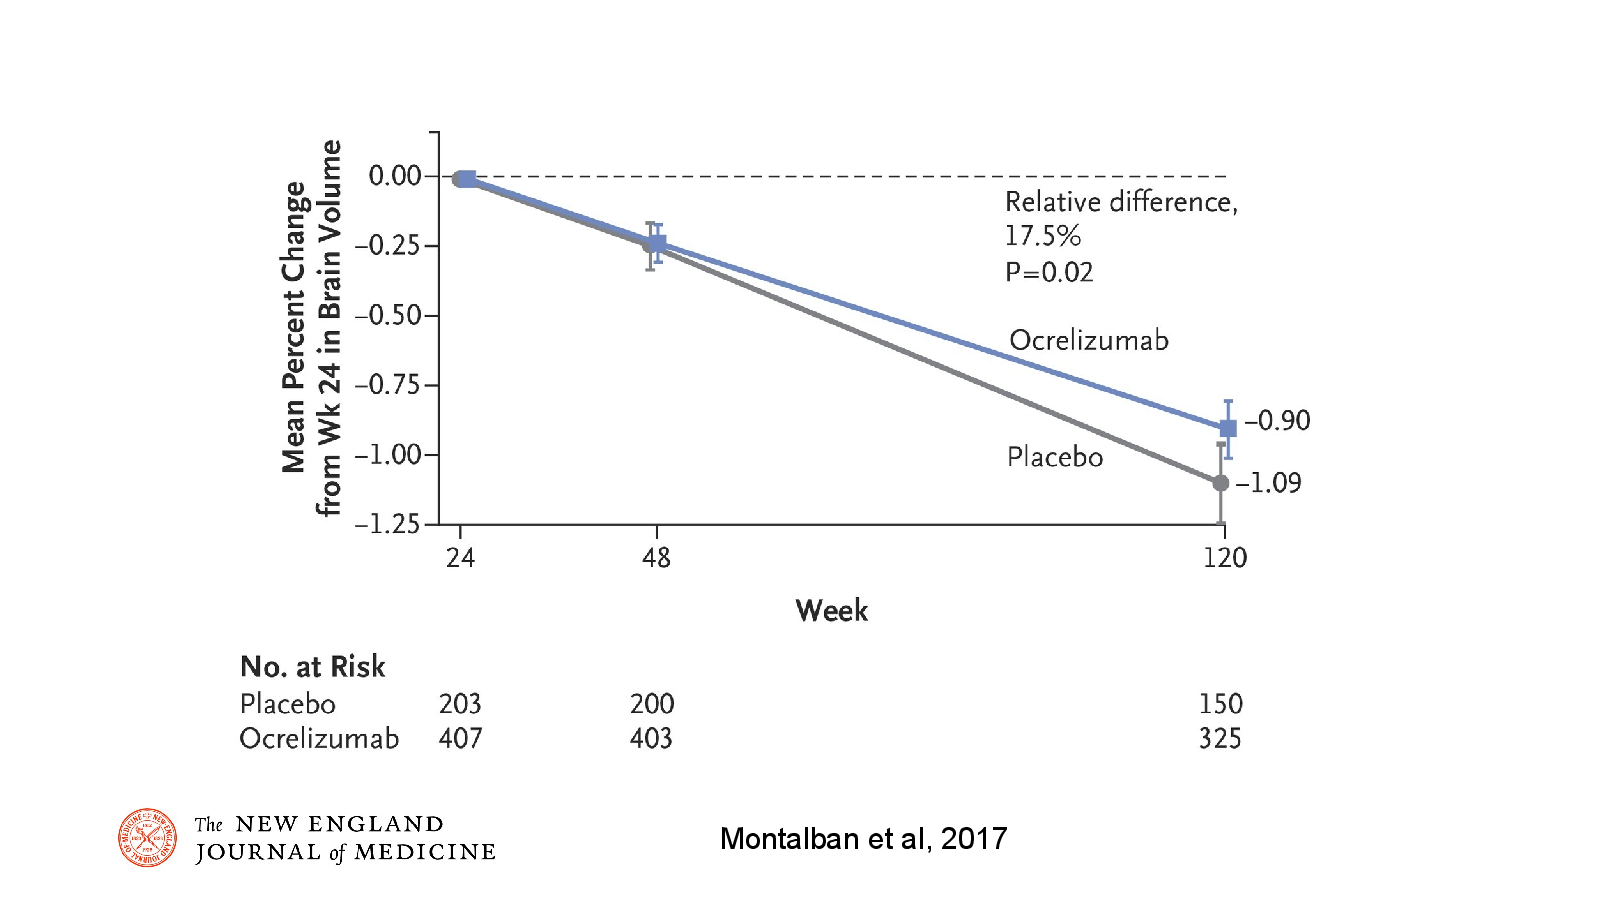
Montalban et al, 2017
Open full-size slide↗References
Slide 18
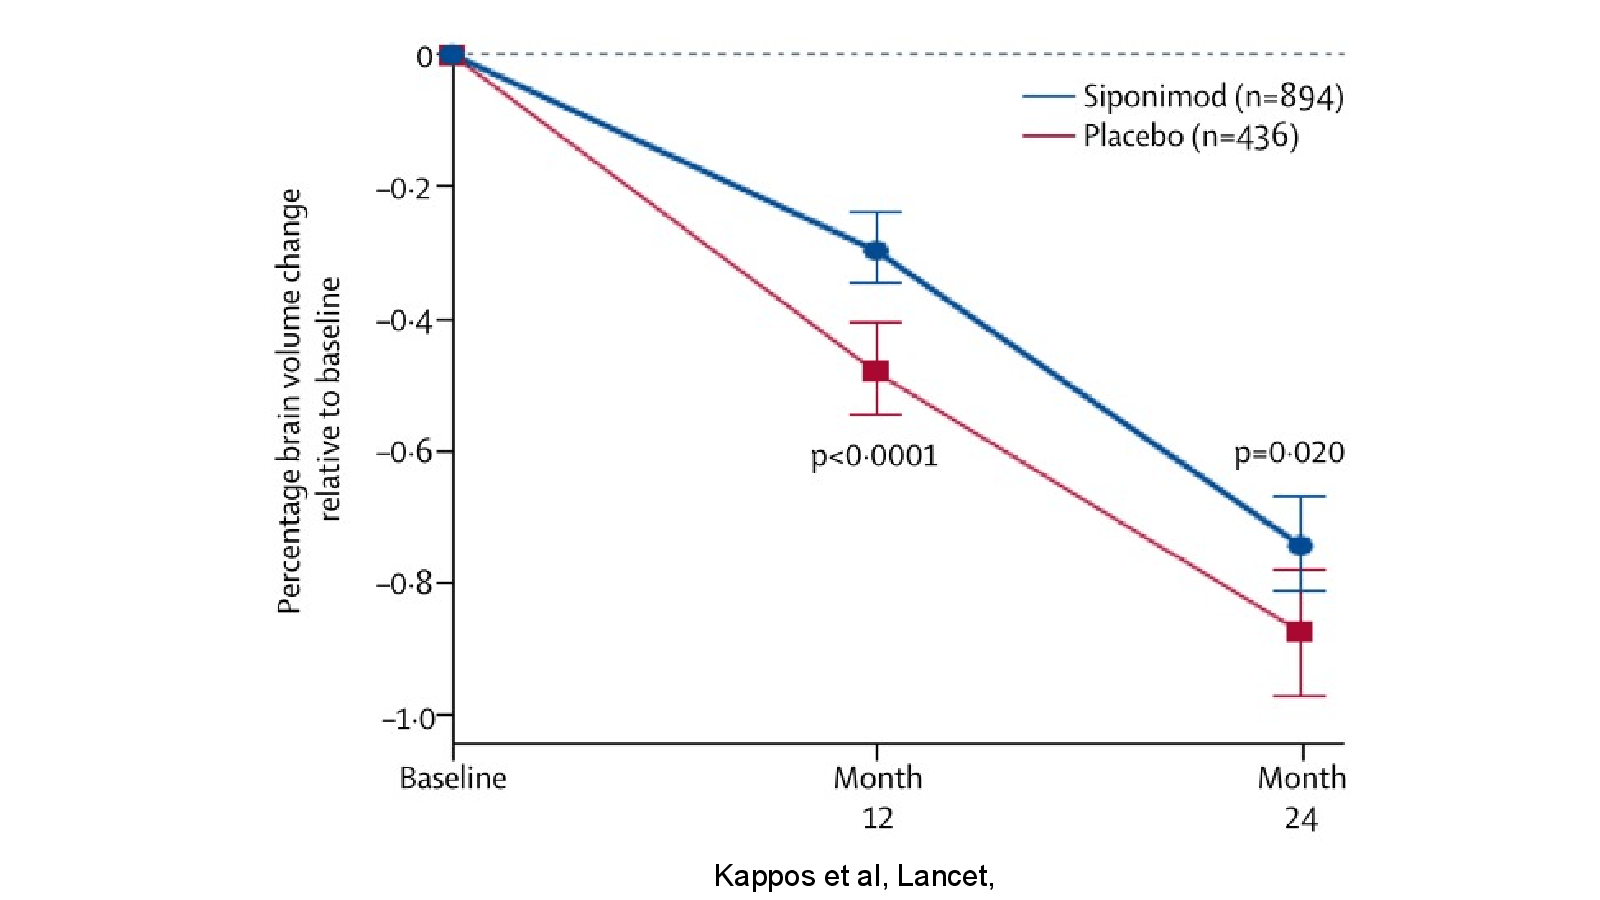
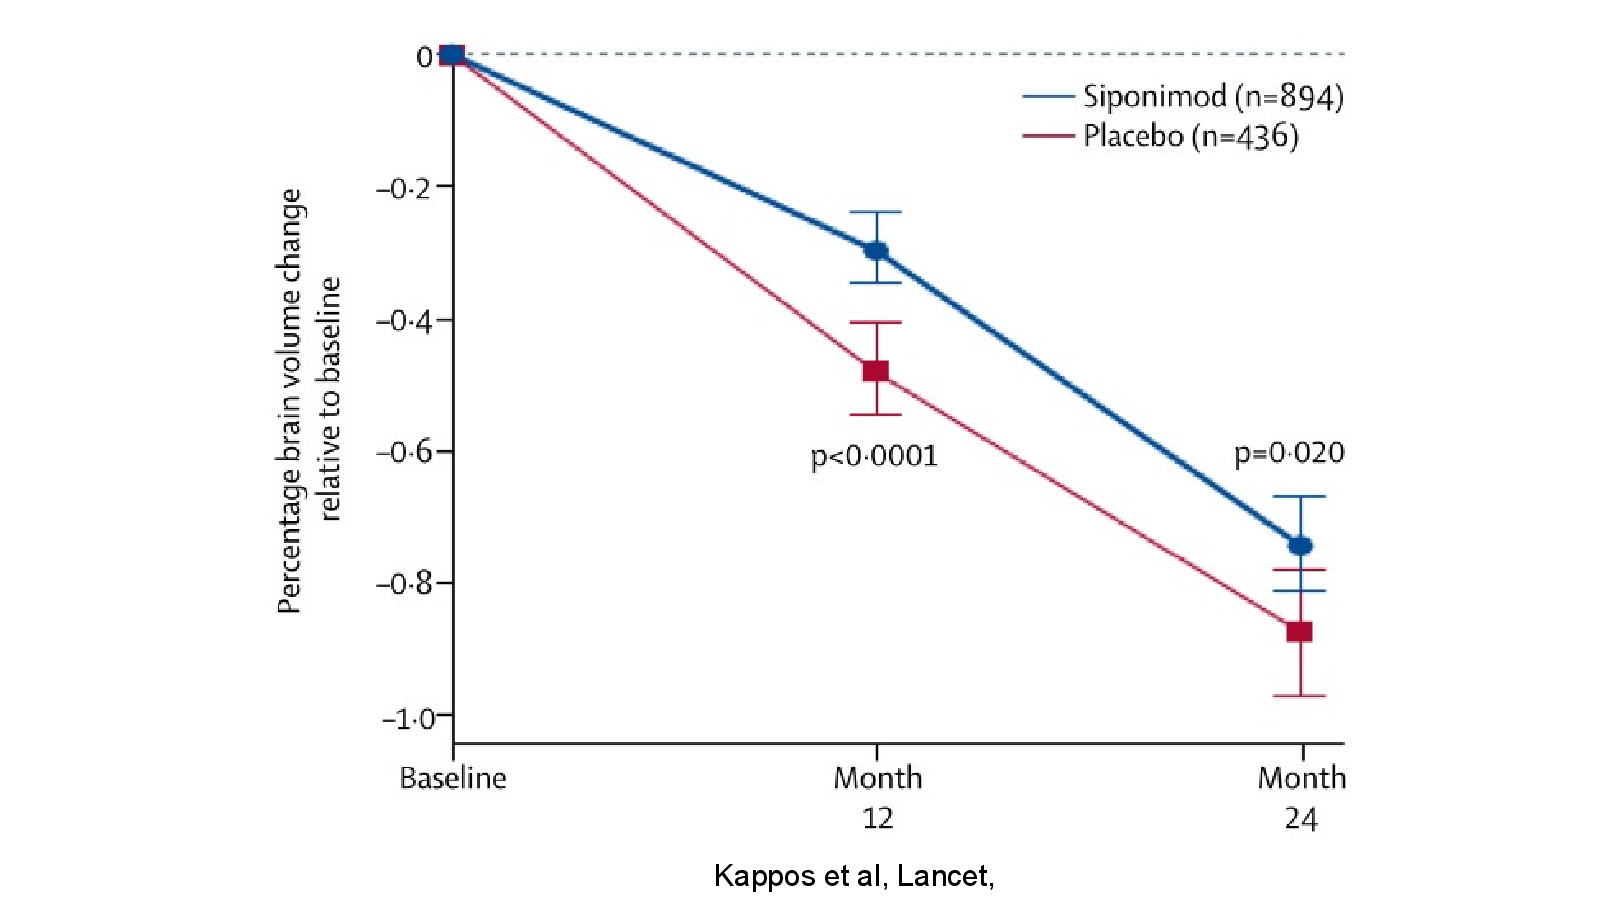
Kappos et al, Lancet, 2018
Open full-size slide↗References
Slide 19
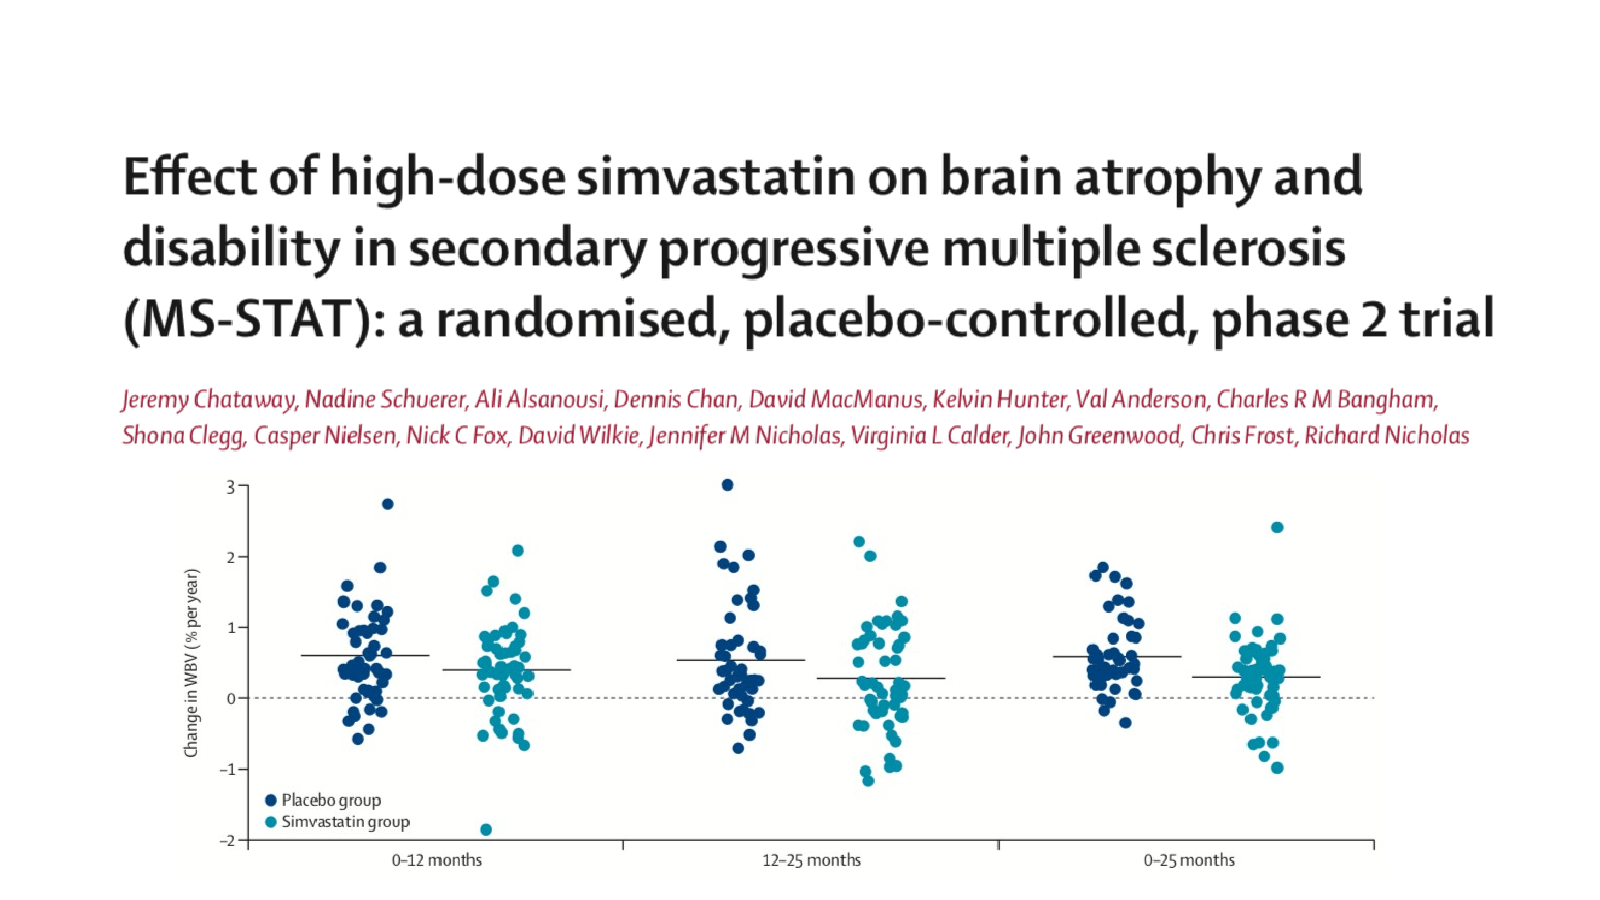
Slide 19
Open full-size slide↗Slide 20
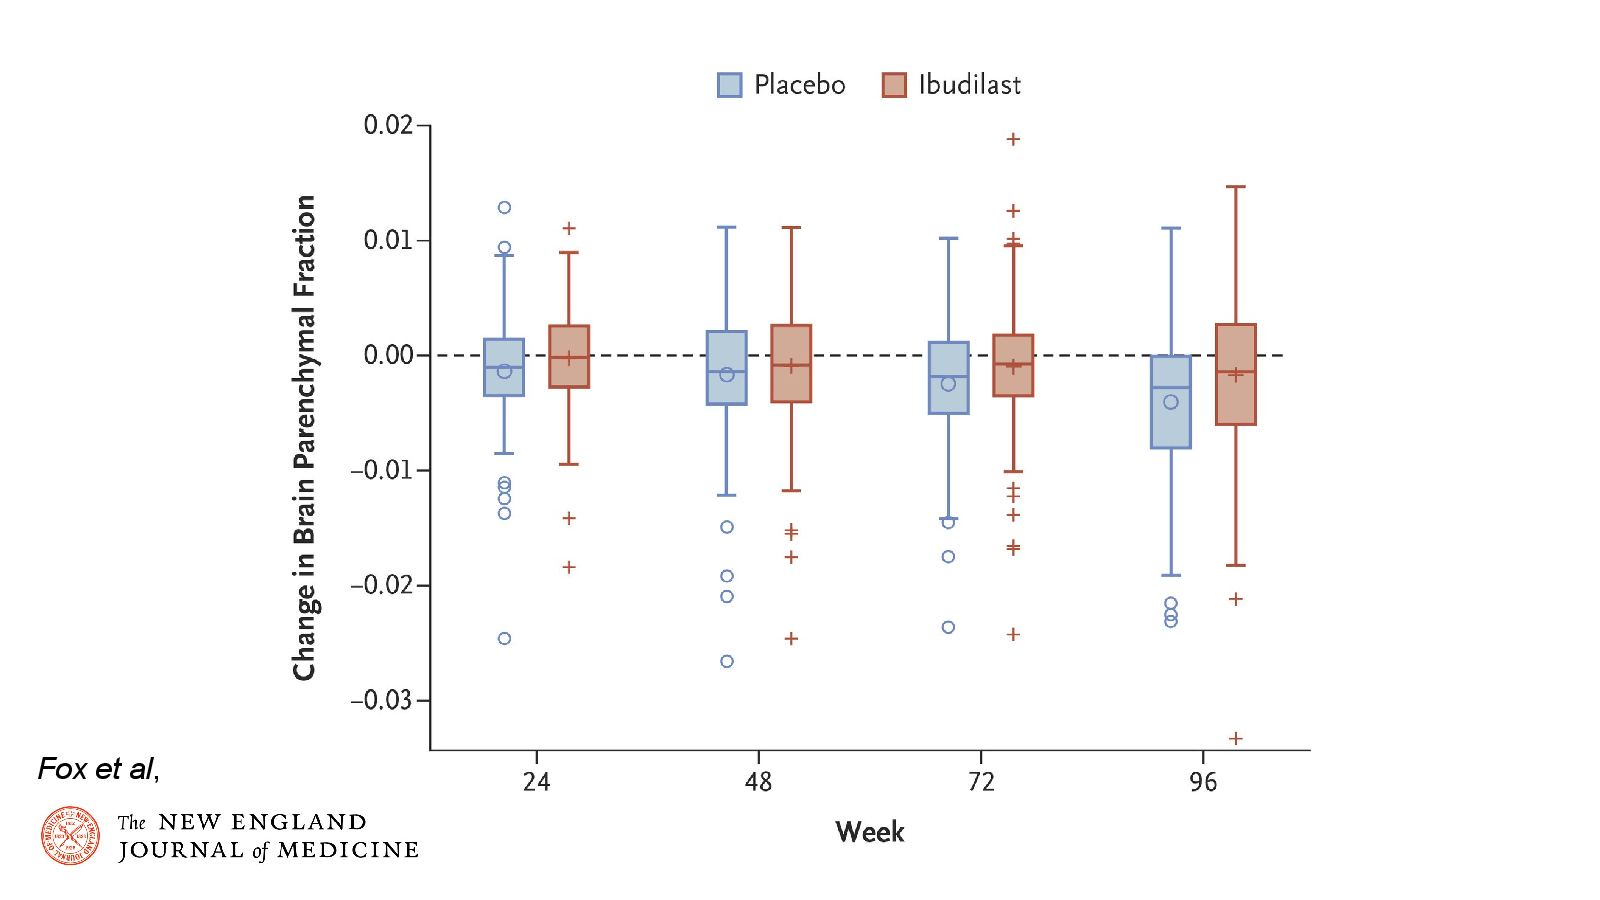
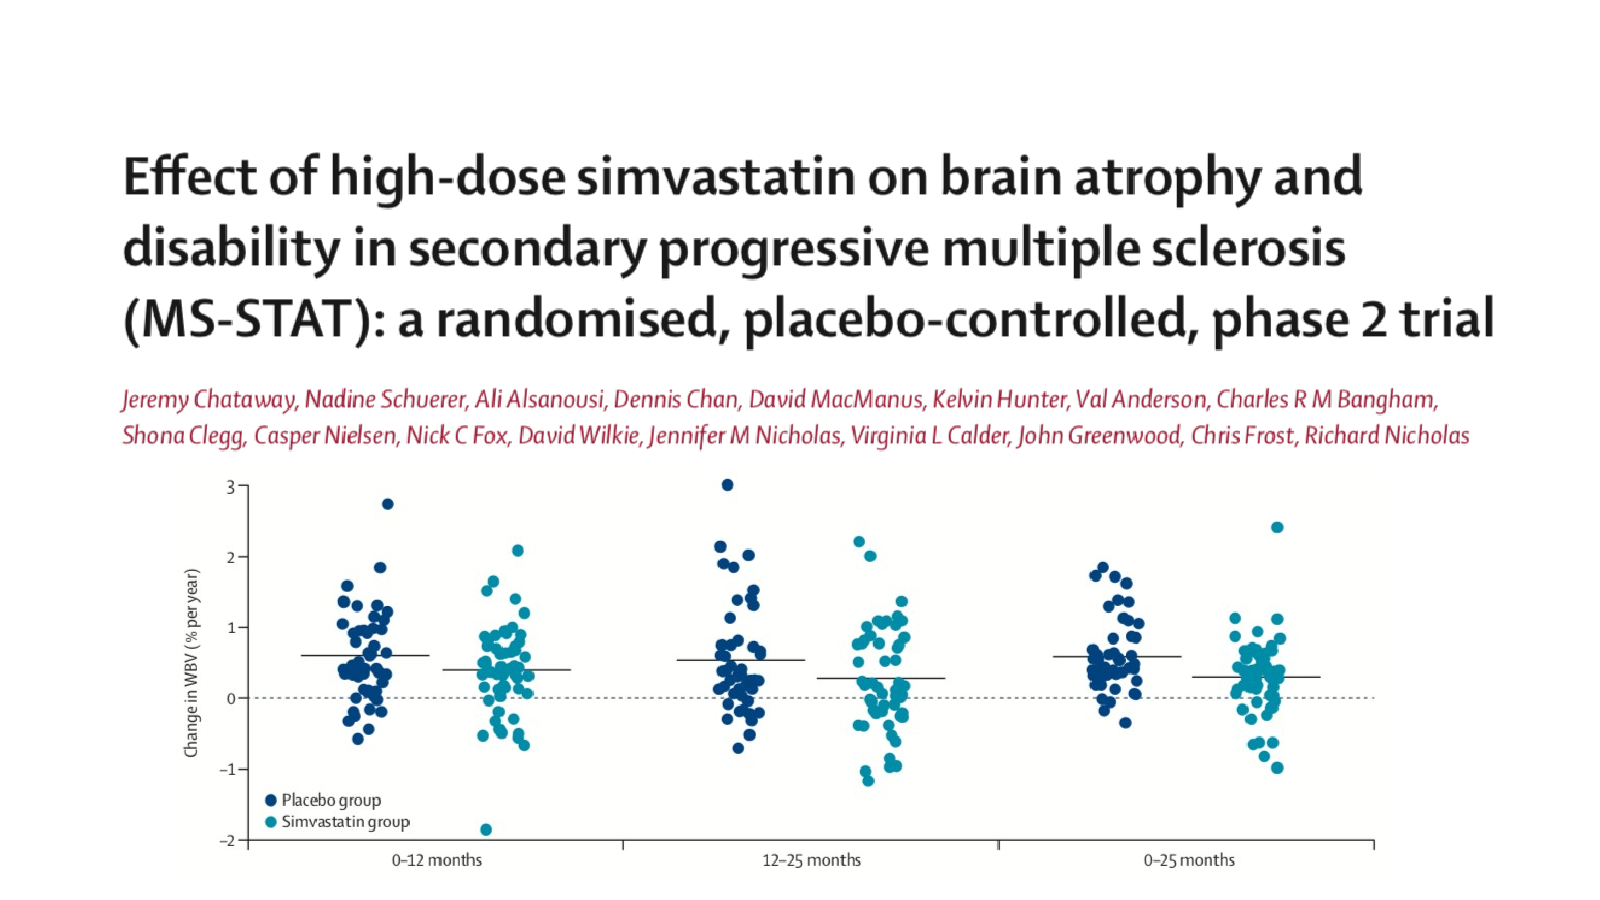
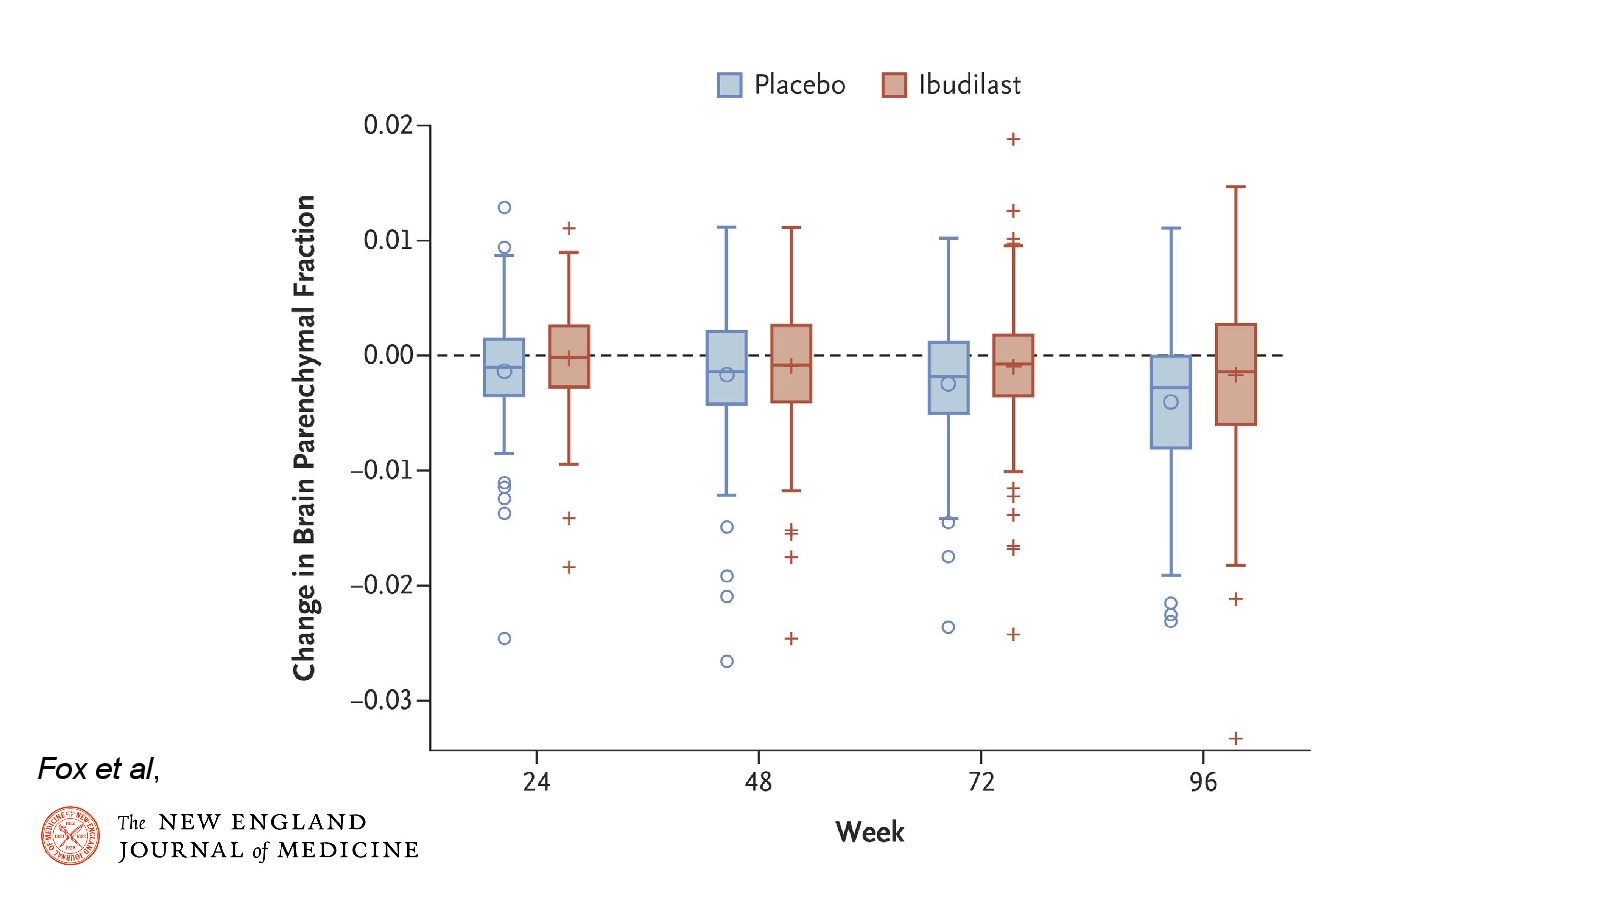
Fox et al, 2018,
Open full-size slide↗Slide 21
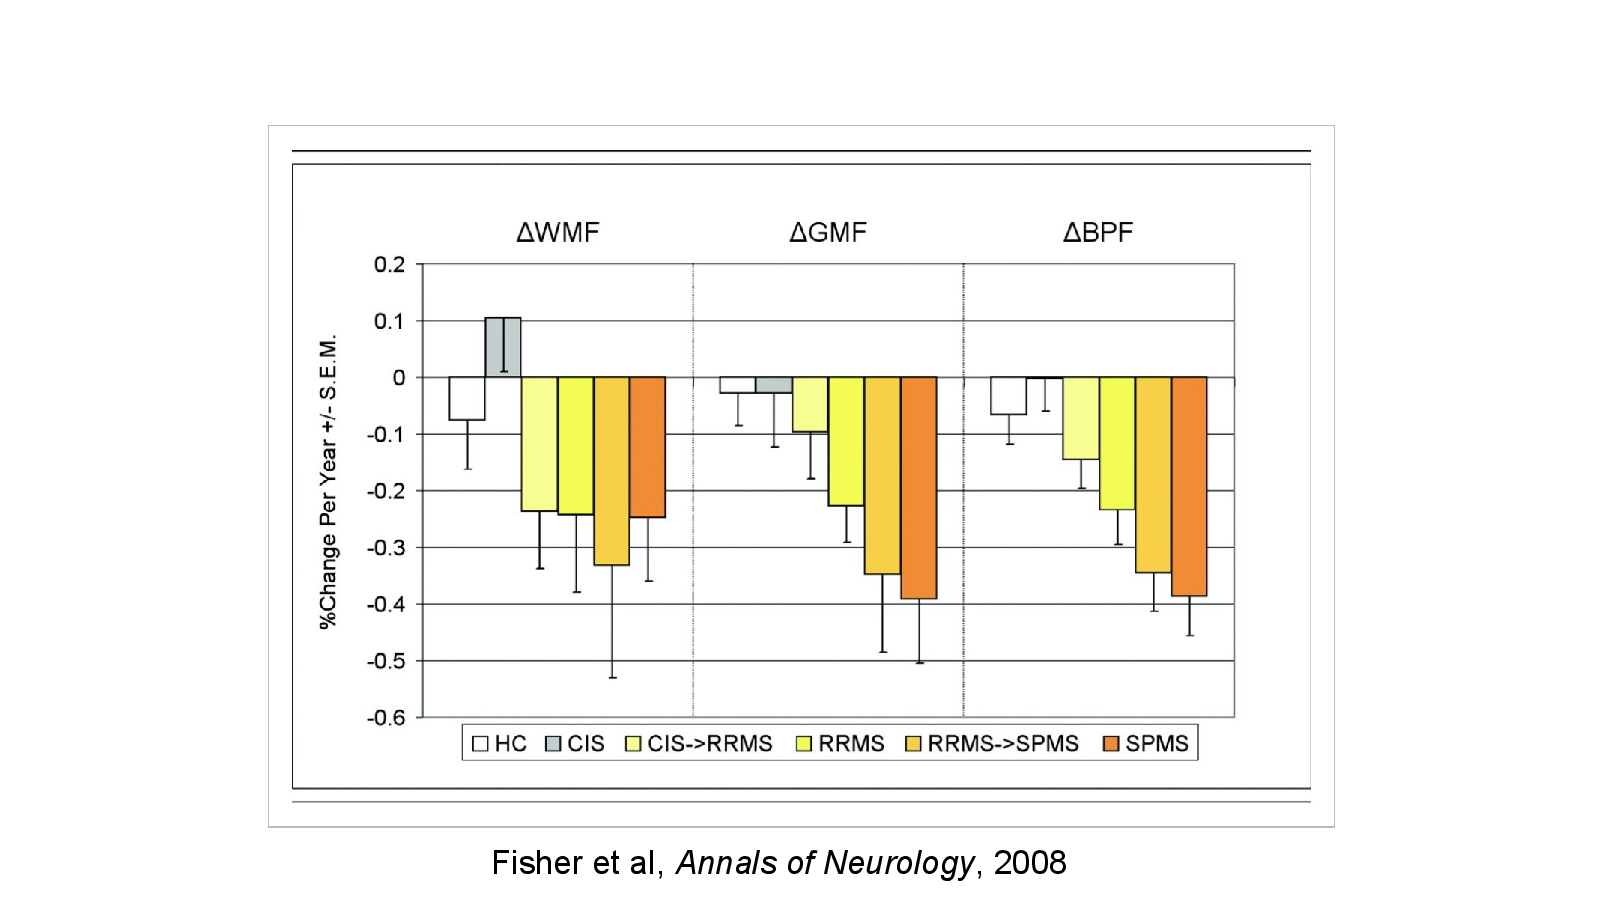
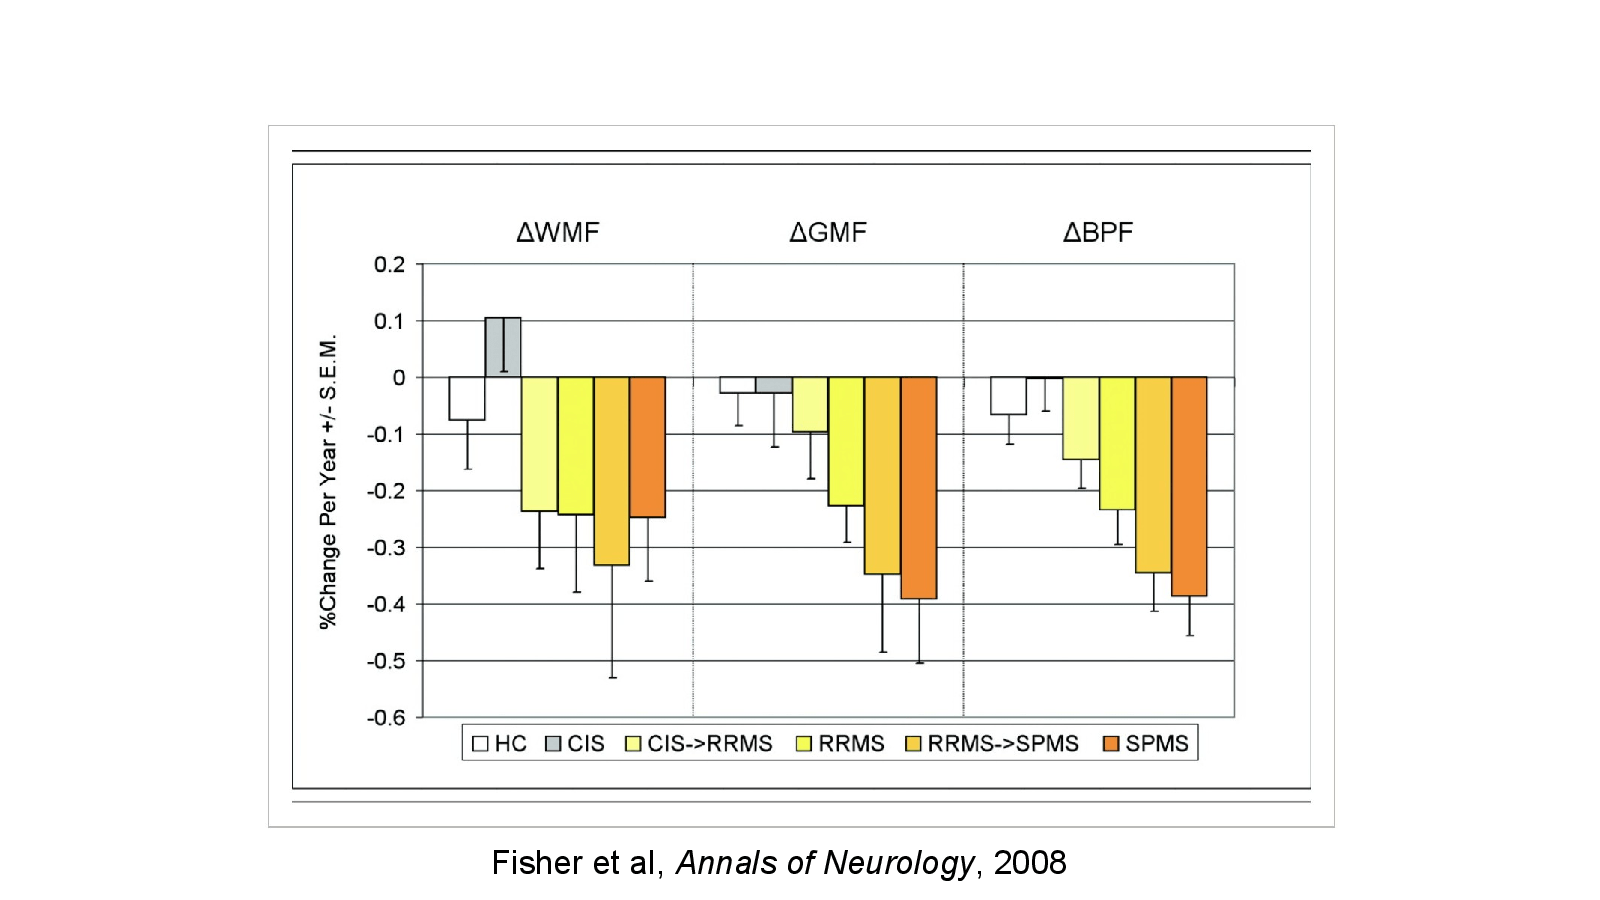
Fisher et al, Annals of Neurology, 2008
Open full-size slide↗References
Slide 22
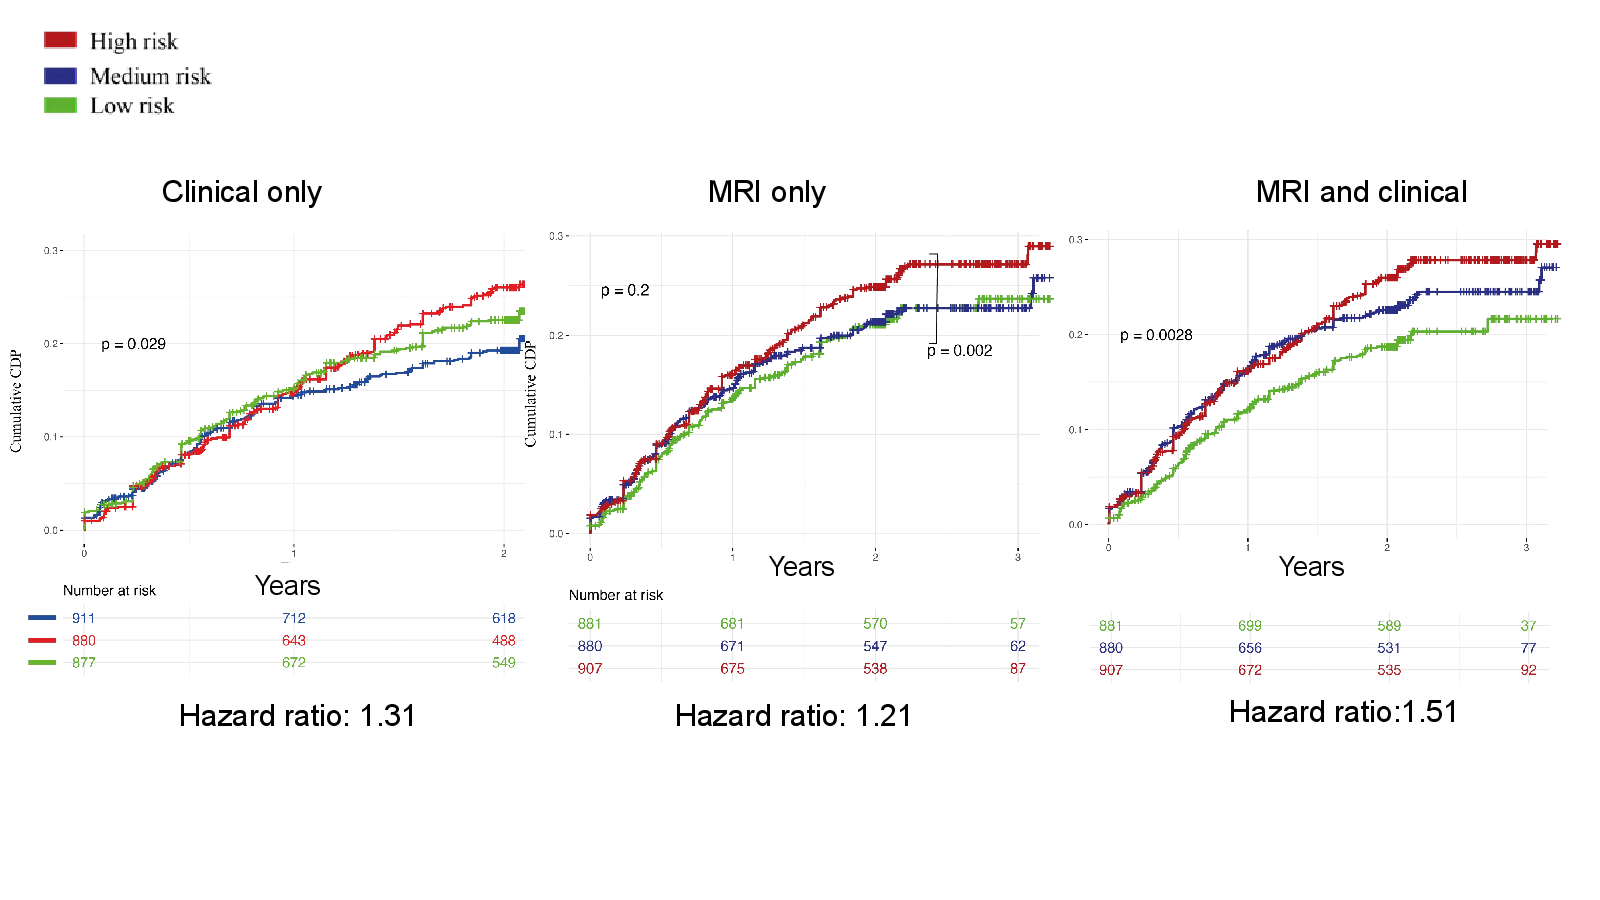
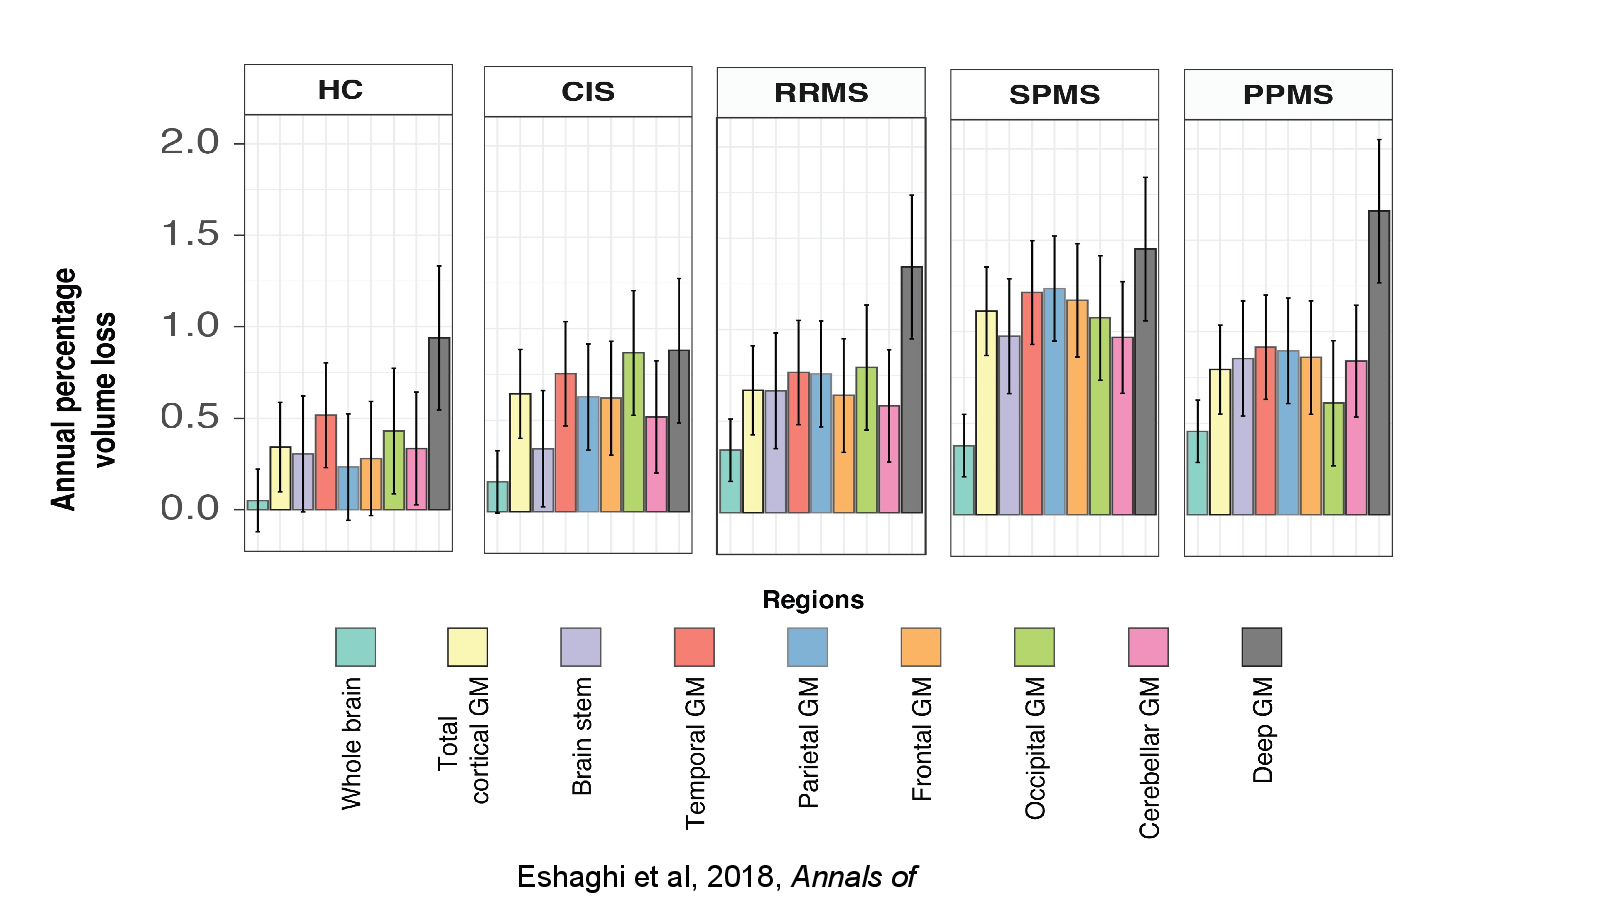
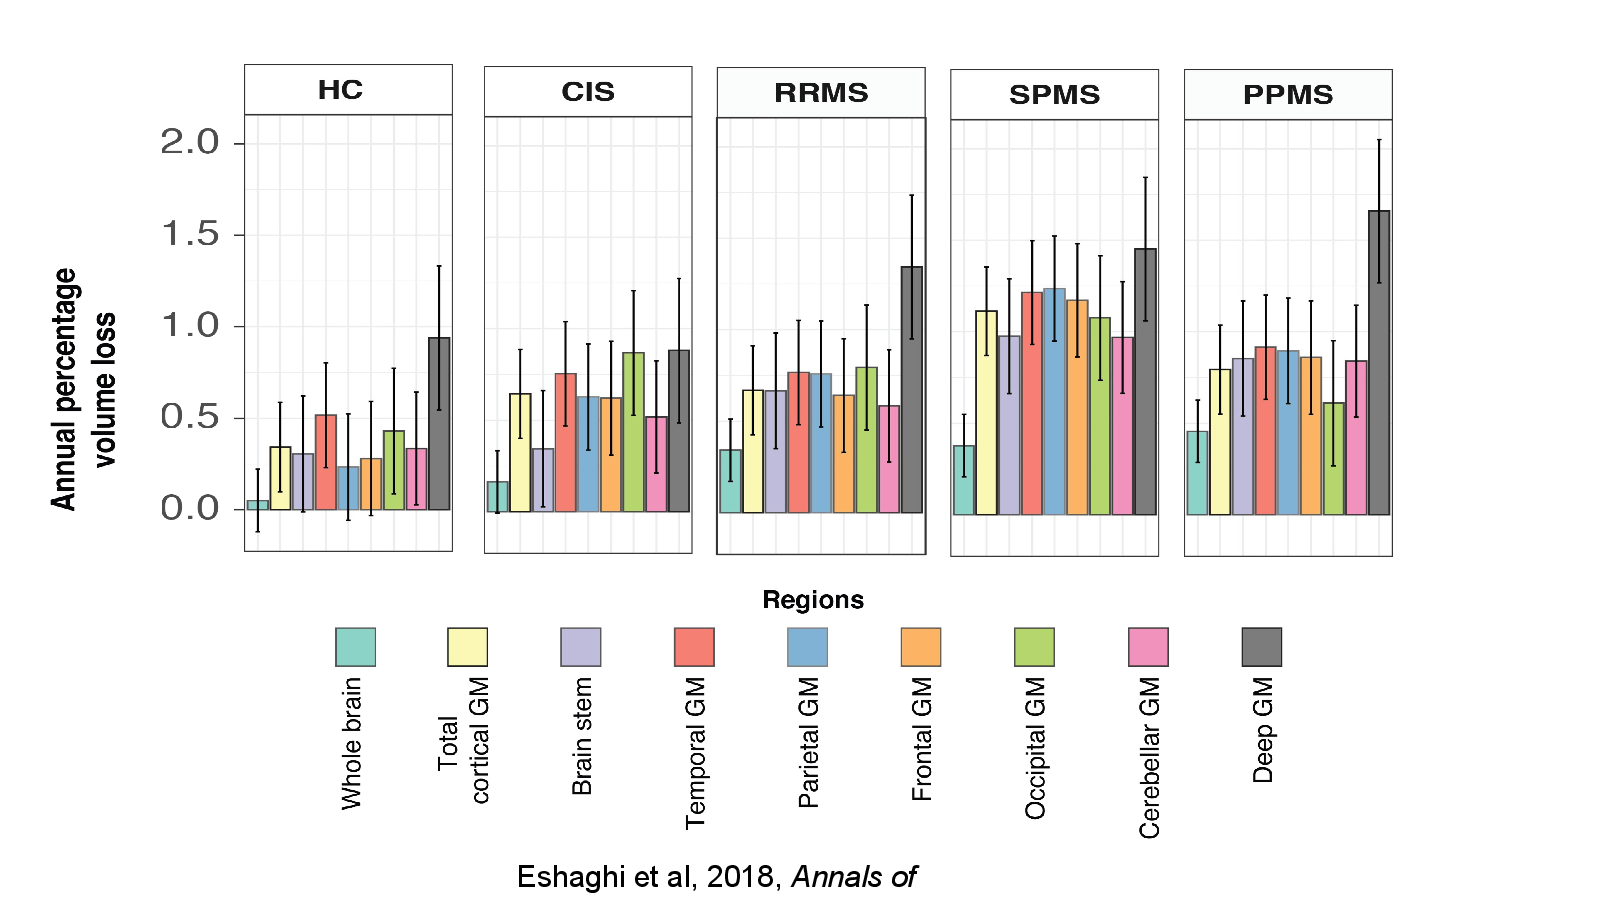
Eshaghi et al, 2018, Annals of Neurology
Open full-size slide↗References
Slide 23
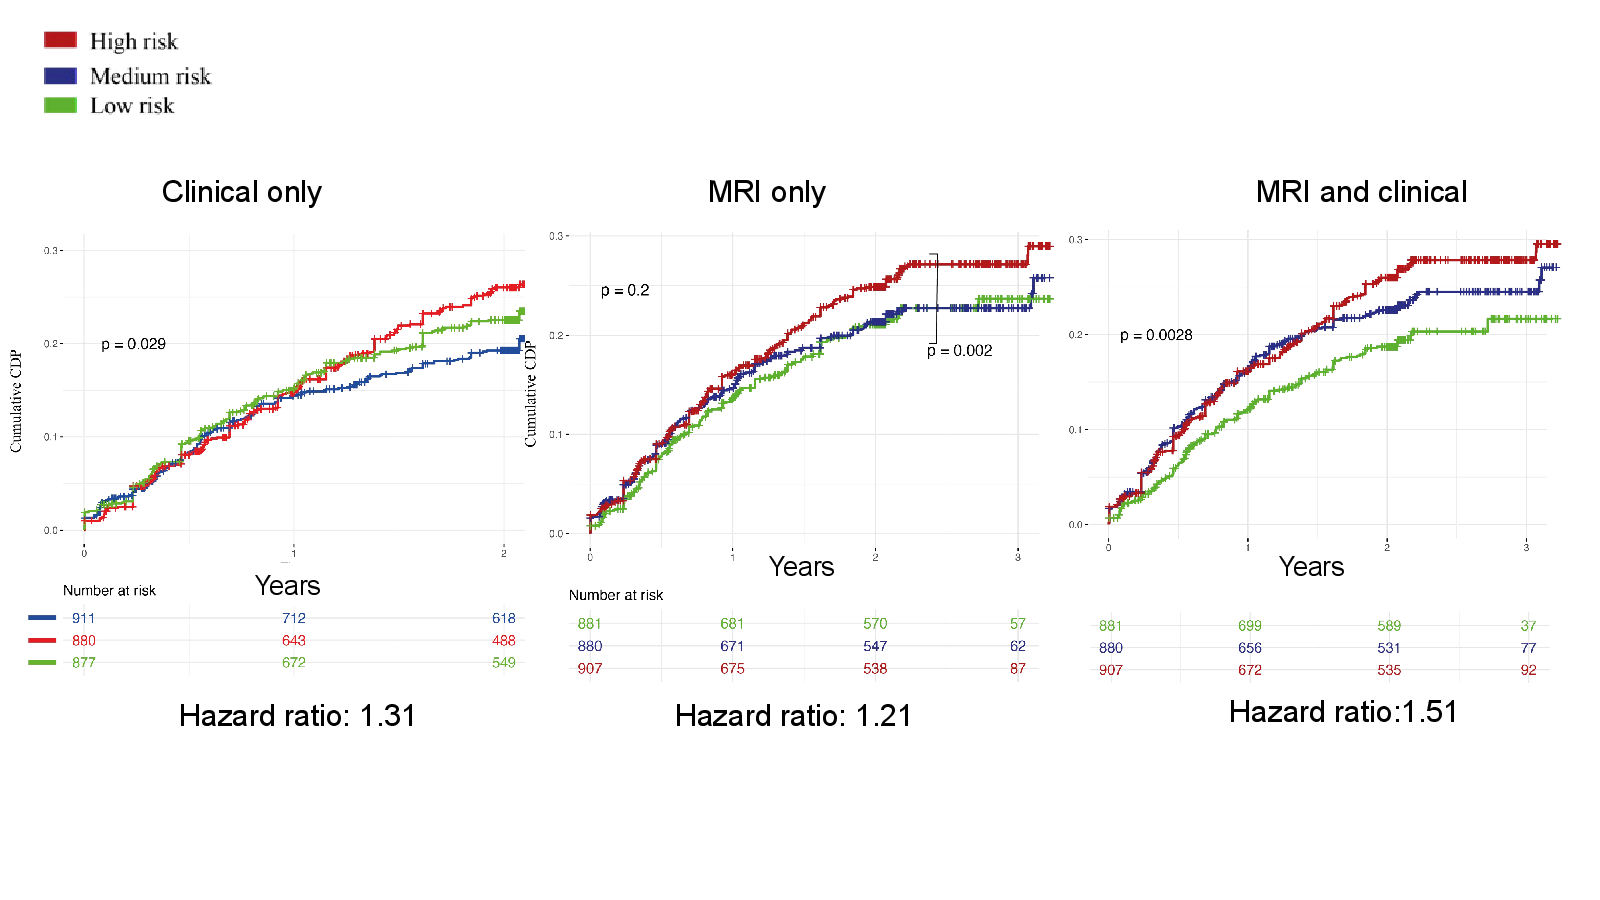
MRI and clinical
Open full-size slide↗Clinical only
MRI only
Years
Hazard ratio:1.51
Hazard ratio: 1.31
Hazard ratio: 1.21
Slide 24
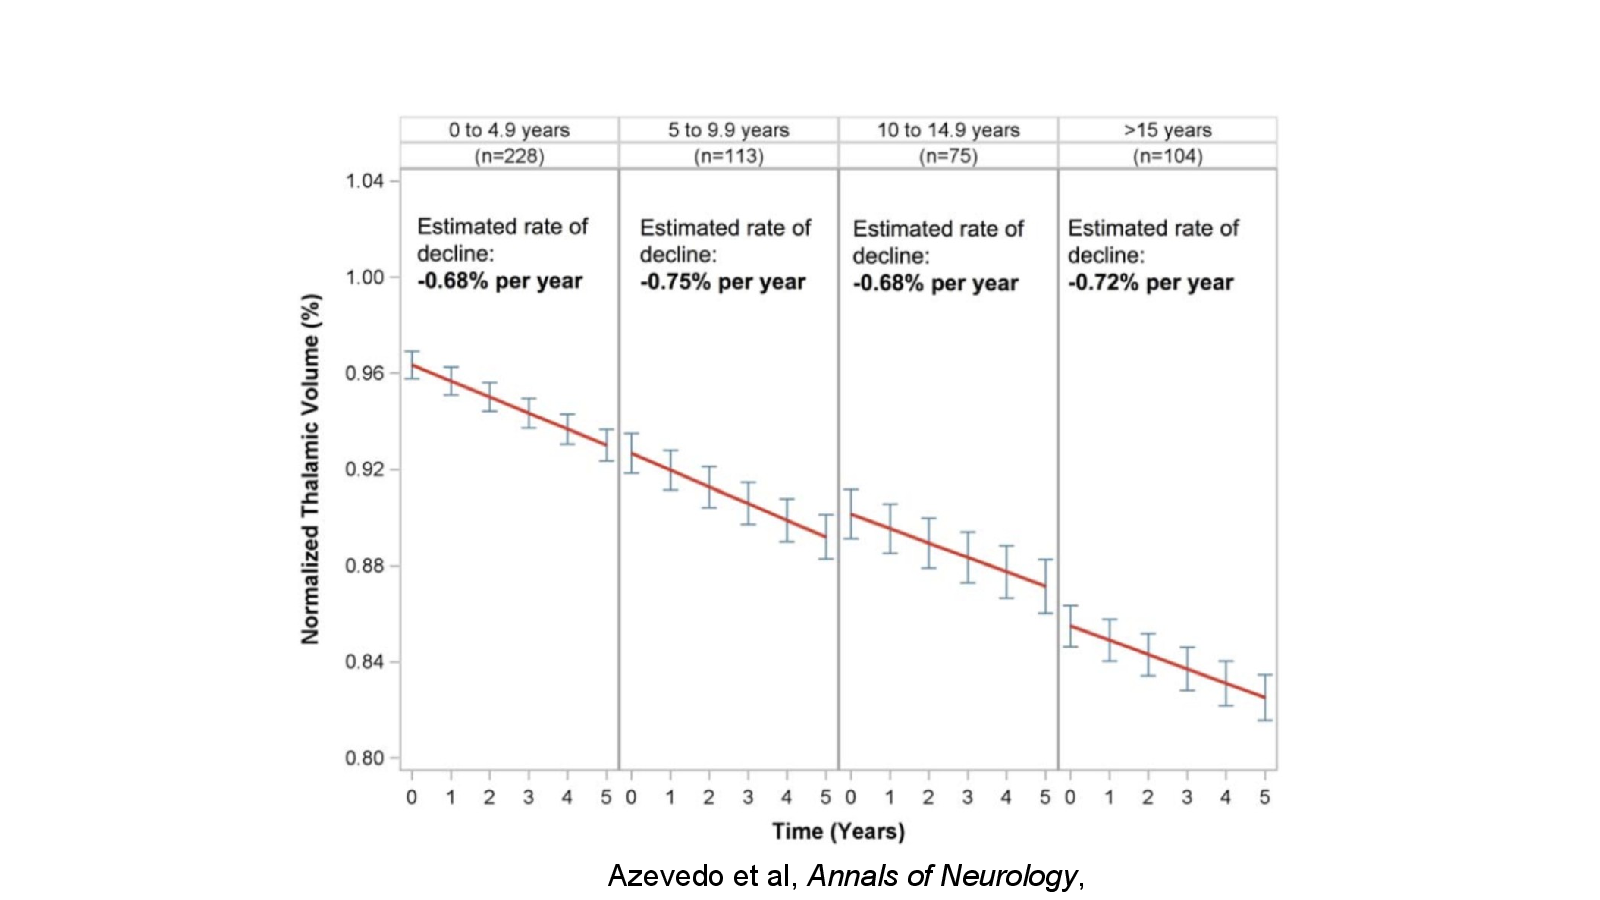
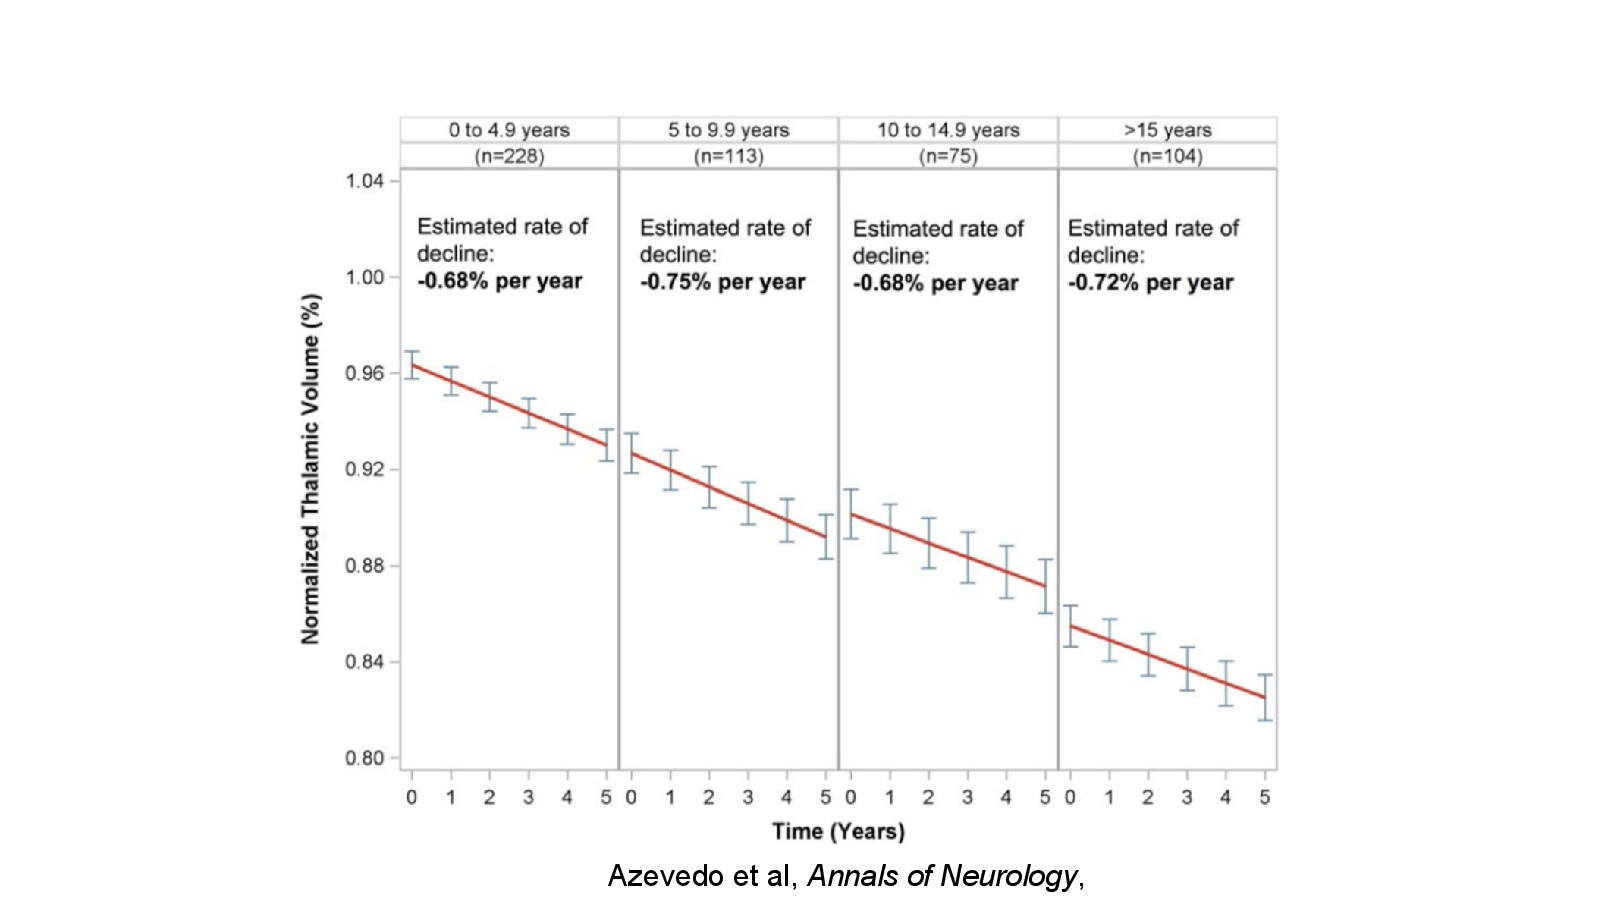
Azevedo et al, Annals of Neurology, 2018
Open full-size slide↗References
Slide 25
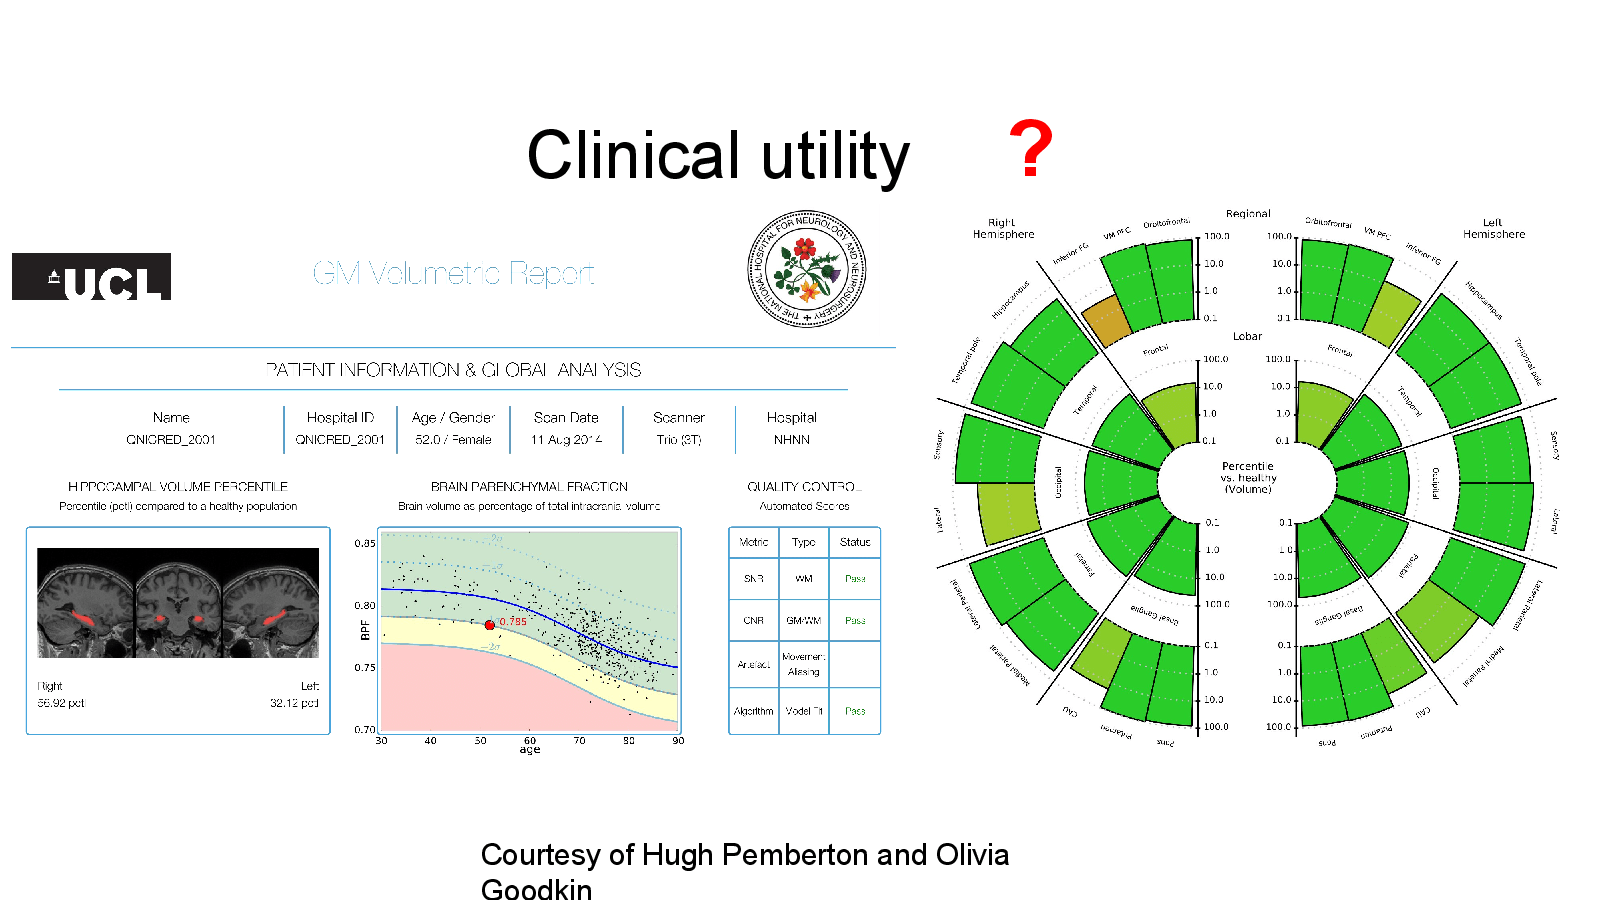
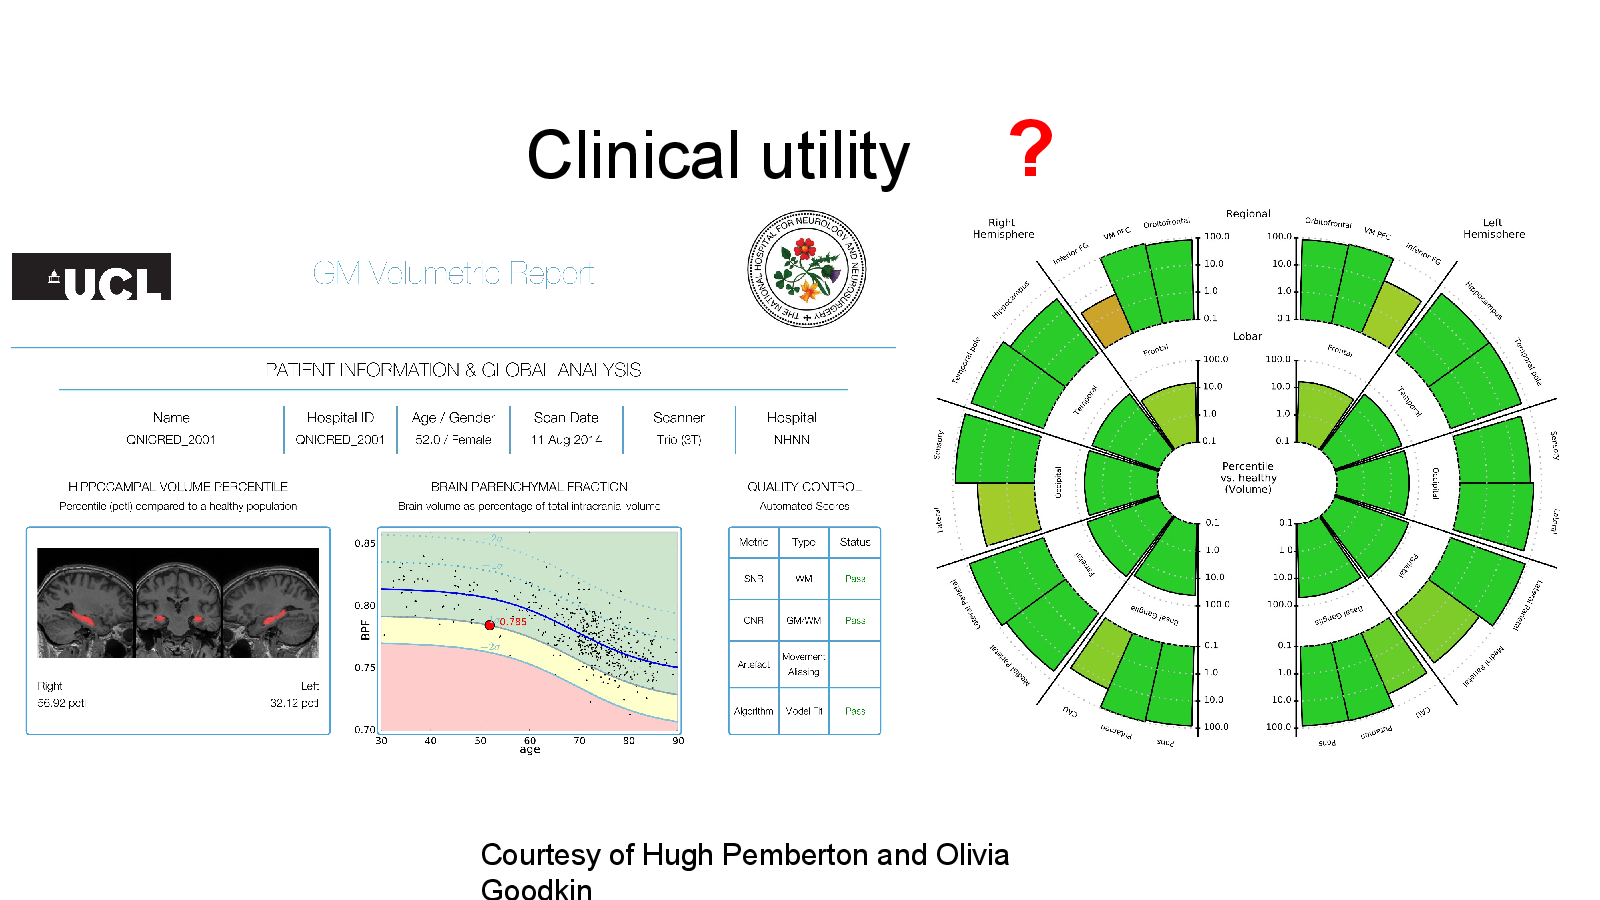
Clinical utility ?
Open full-size slide↗Courtesy of Hugh Pemberton and Olivia Goodkin
Slide 26
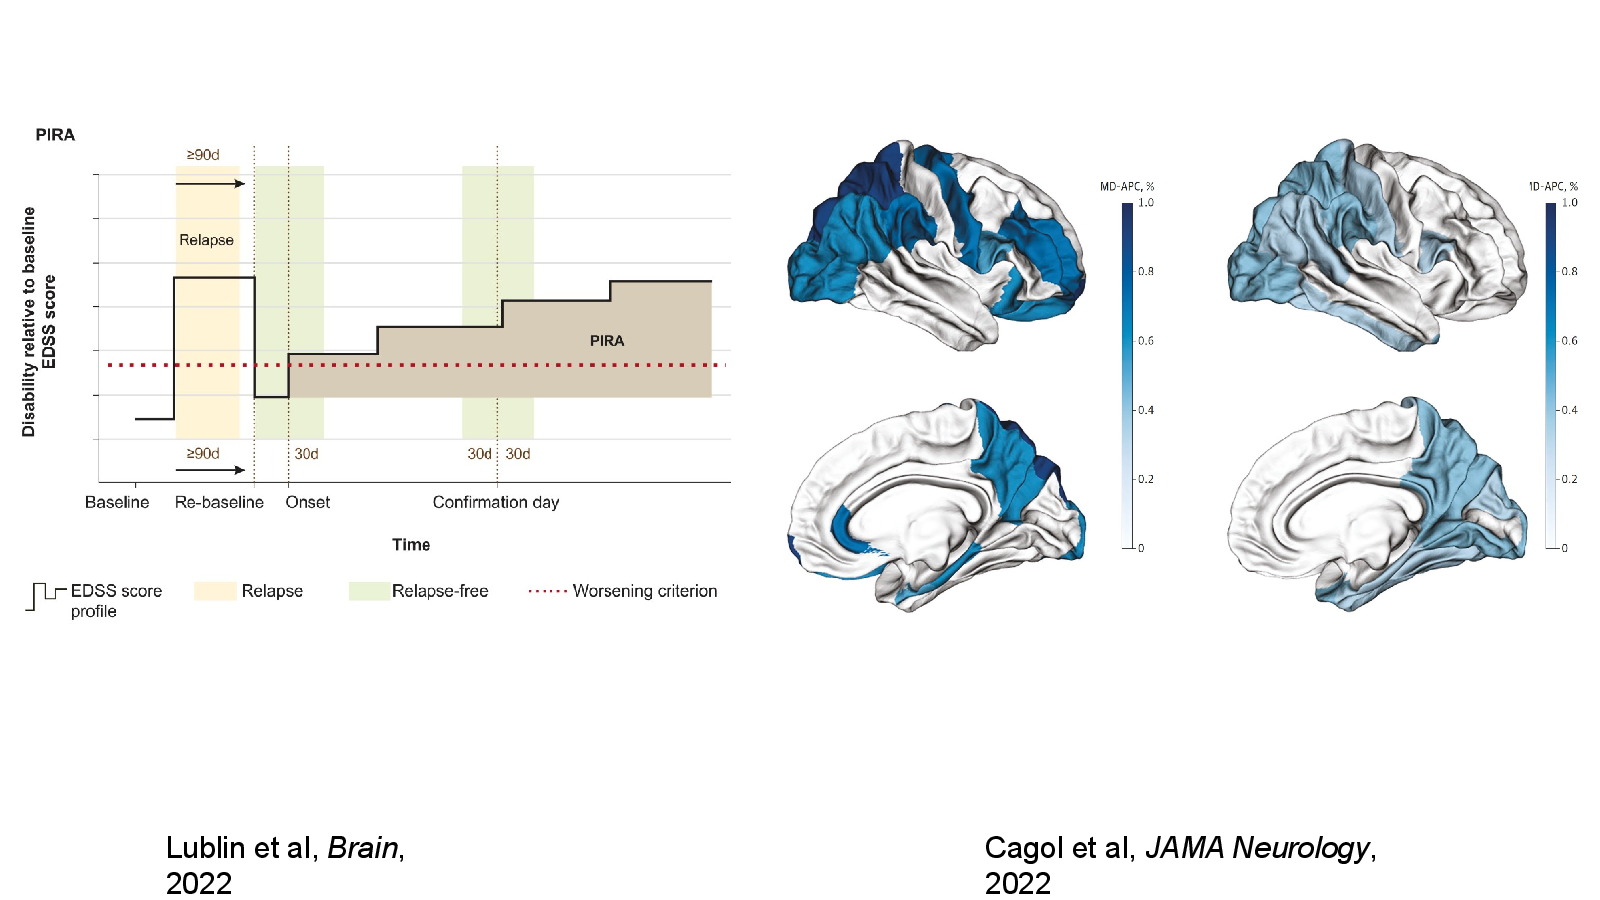
Cagol et al, JAMA Neurology, 2022
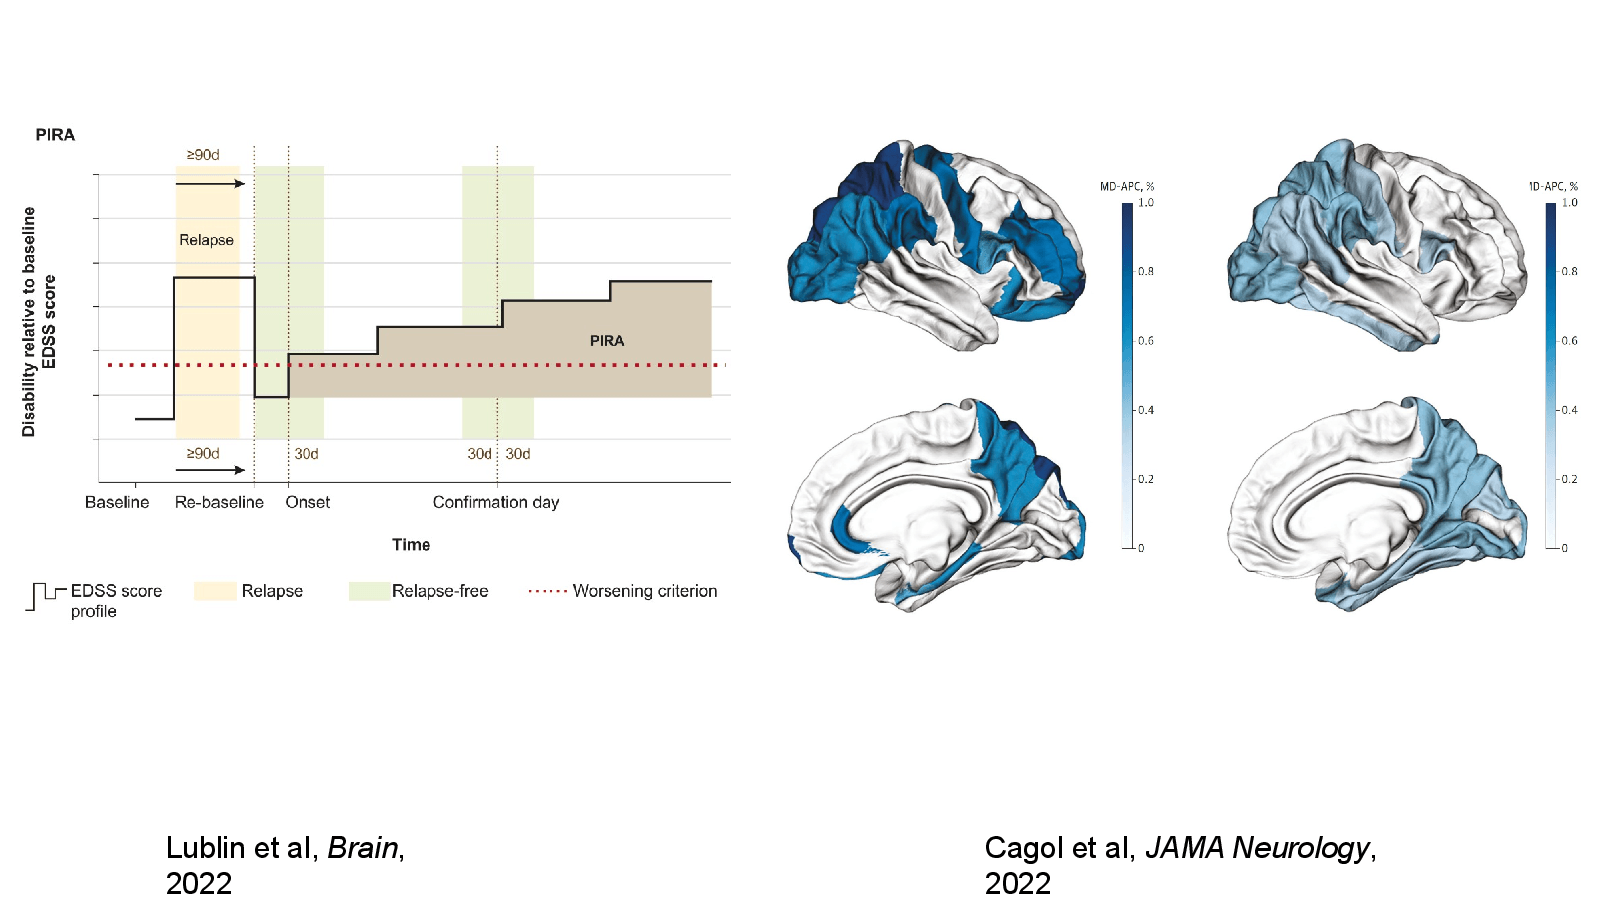
Open full-size slide↗Lublin et al, Brain, 2022
Speaker notes+
The effect size, expressed as mean difference in annual percentage cortical thickness change (MD-APC), is graphically displayed in different shades of blue for each of the Desikan-Killiany atlas25 regions presenting significant differences between groups after correction for multiple comparisons.
References
Slide 27
Spinal cord
Open full-size slide↗Slide 28
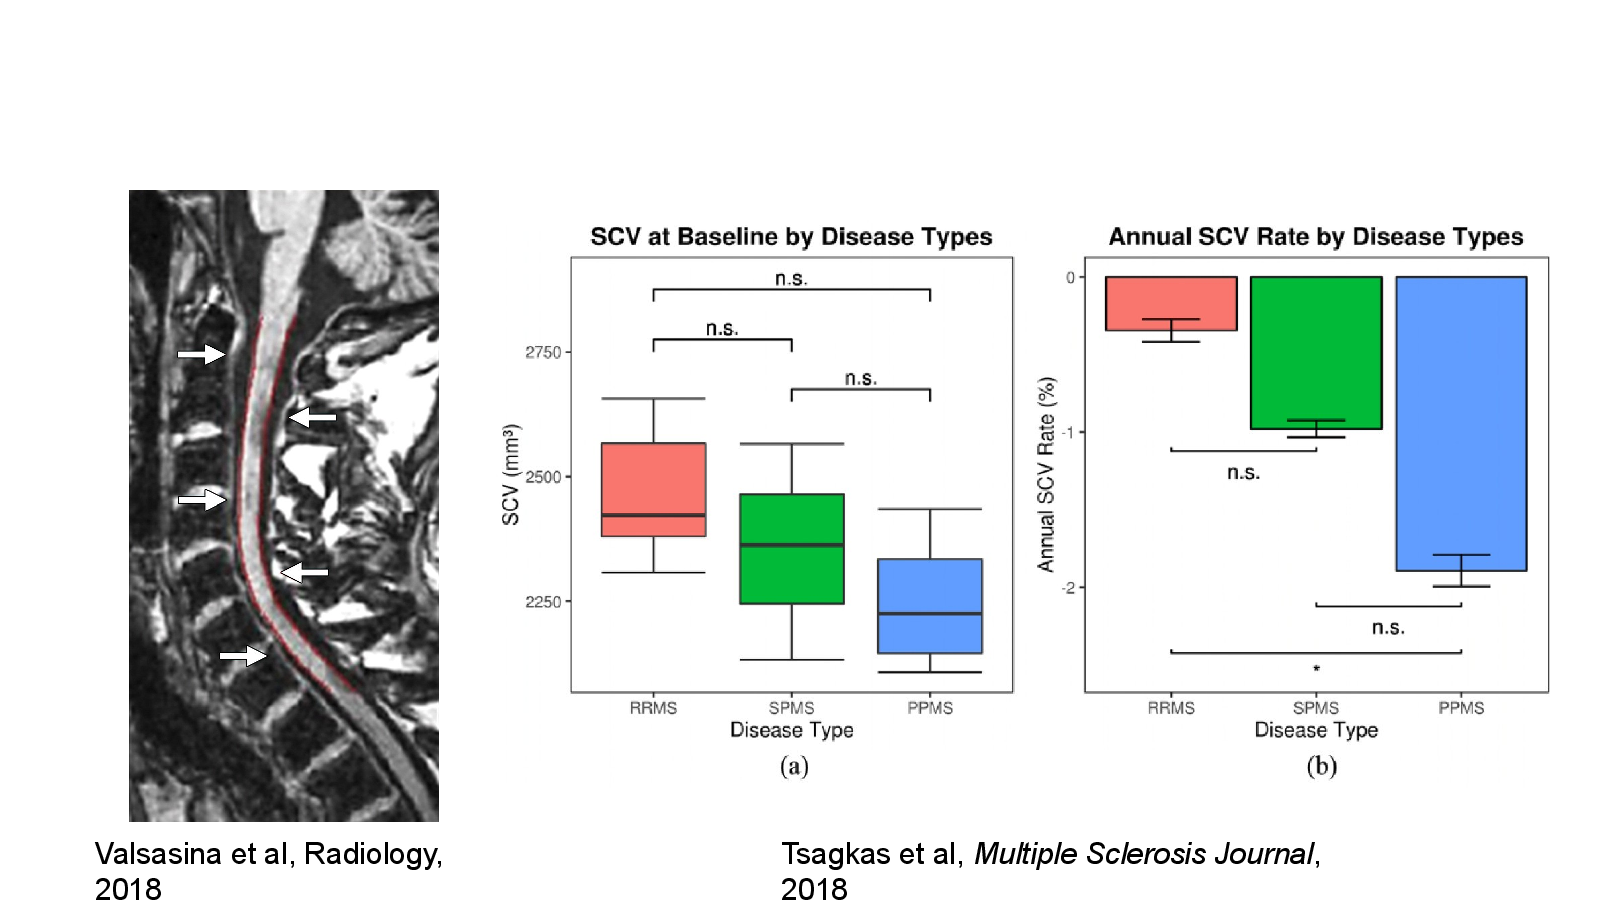
Tsagkas et al, Multiple Sclerosis Journal, 2018
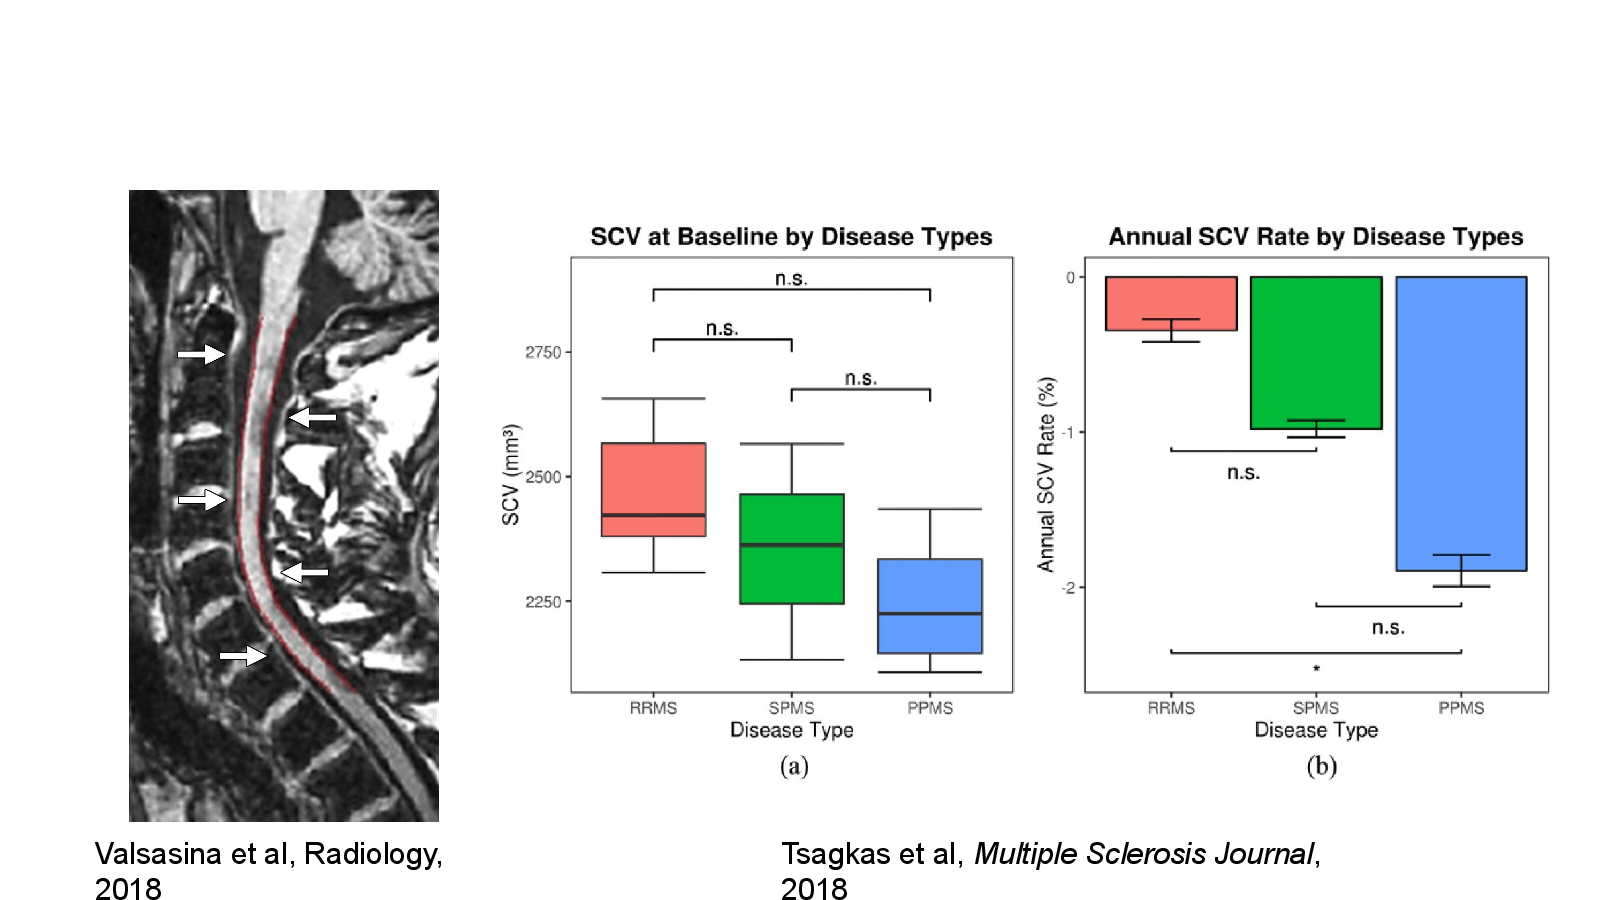
Open full-size slide↗Valsasina et al, Radiology, 2018
Speaker notes+
Hypointense lesions at T1-weighted imaging were observed in the cervical spinal cord of the majority of patients with MS and more widespread in progressive than in relapsing MS phenotypes. Both T1-weighted hypointense cord lesions and atrophy correlated with patient clinical disability
References
Slide 29
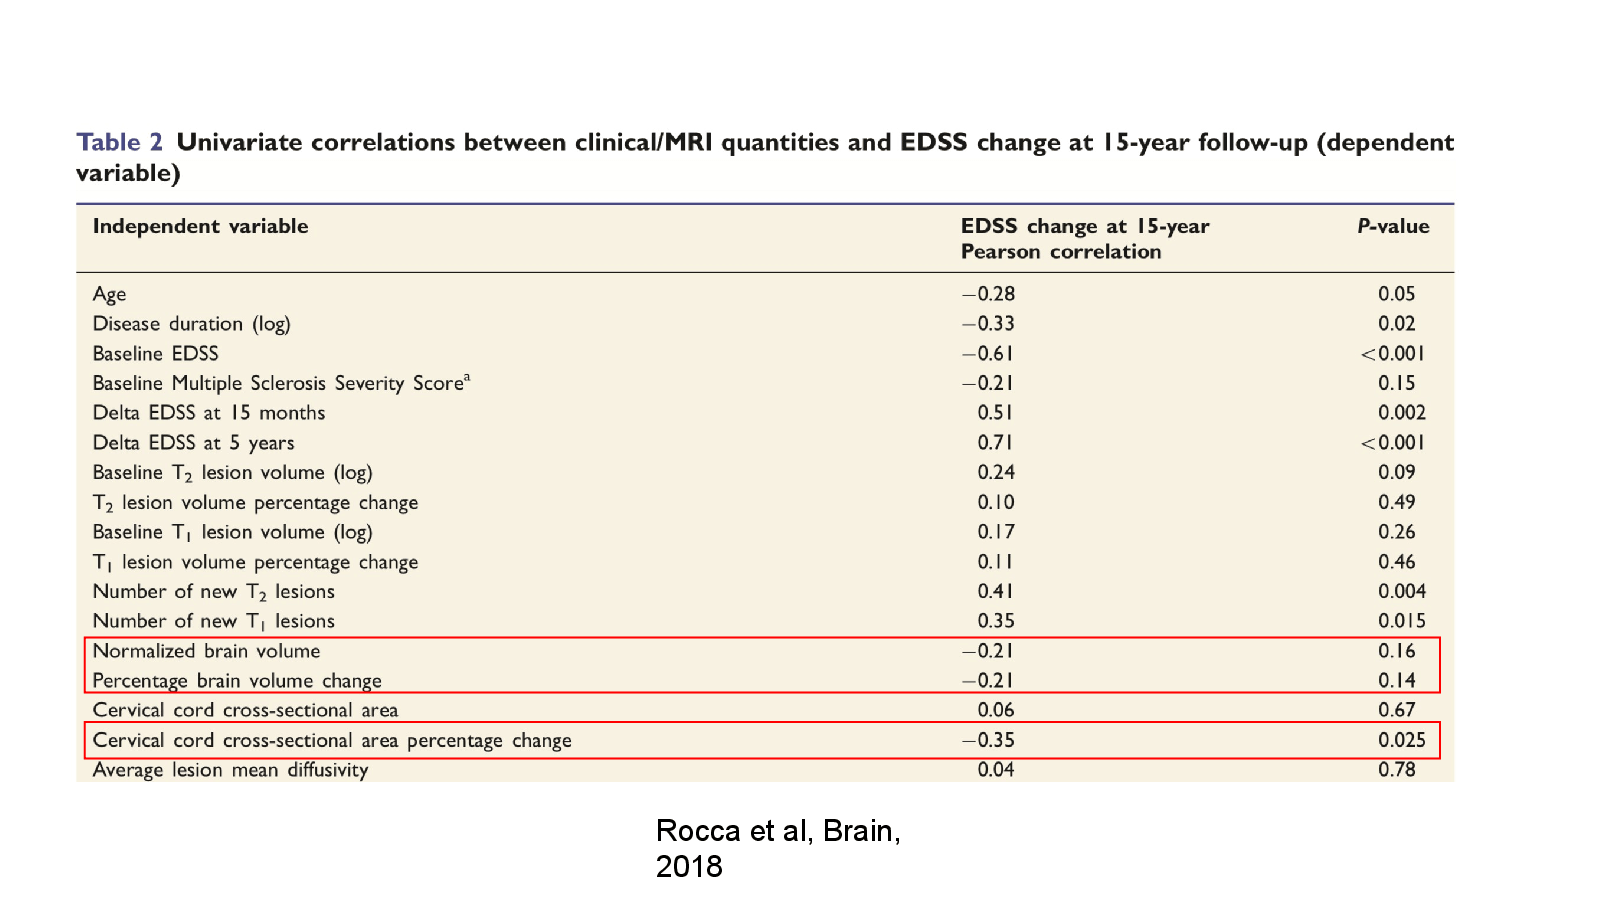
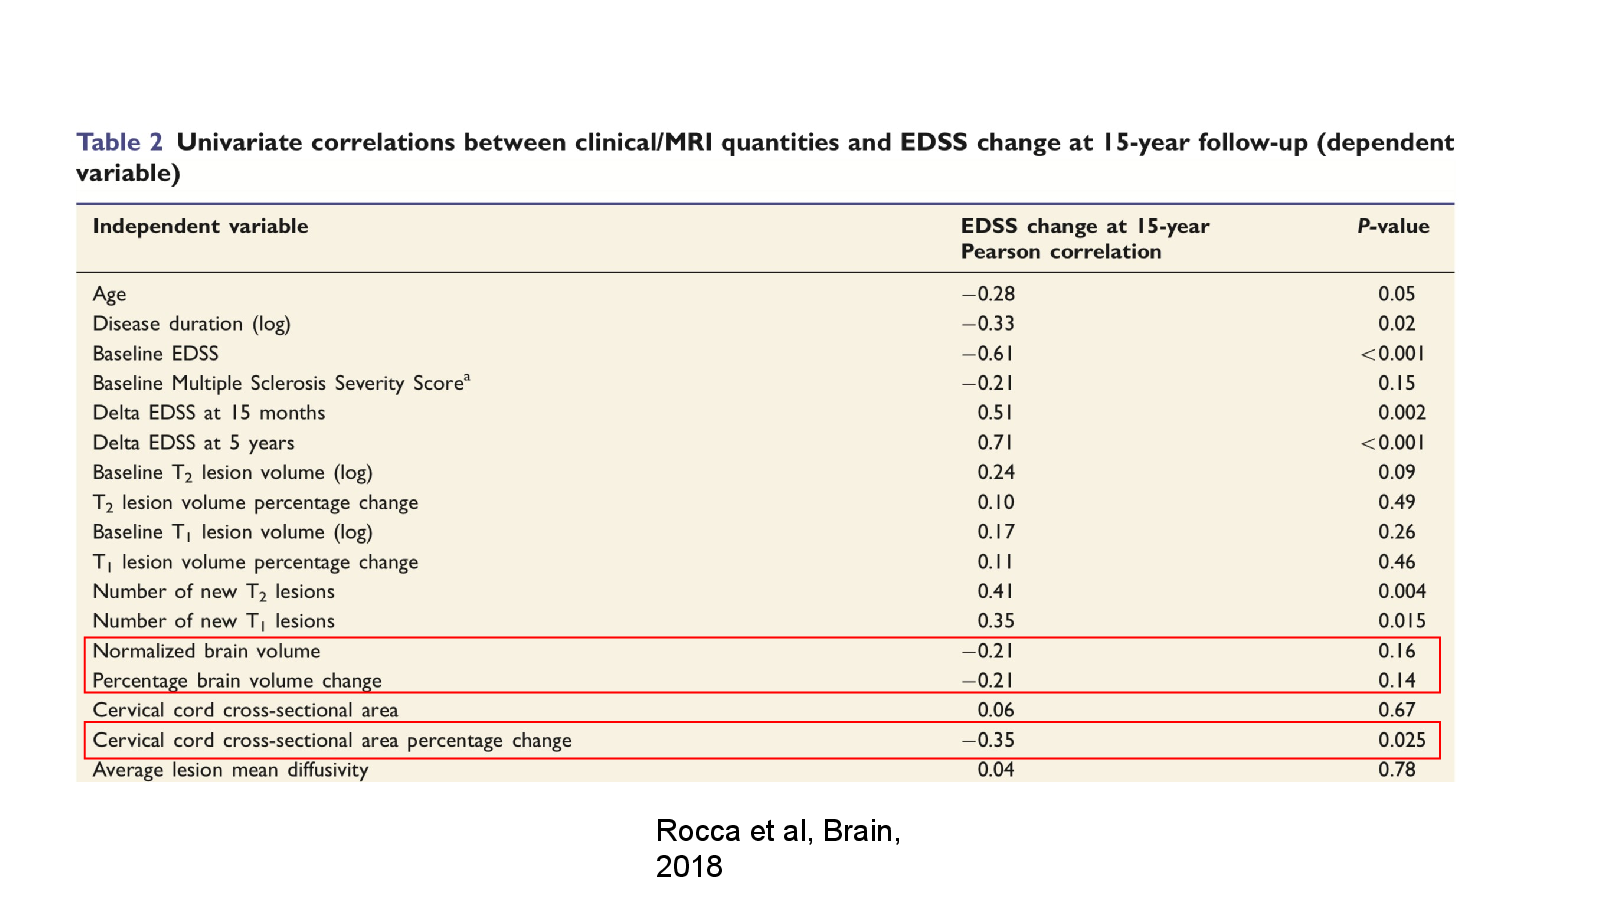
Rocca et al, Brain, 2018
Open full-size slide↗References
Slide 30
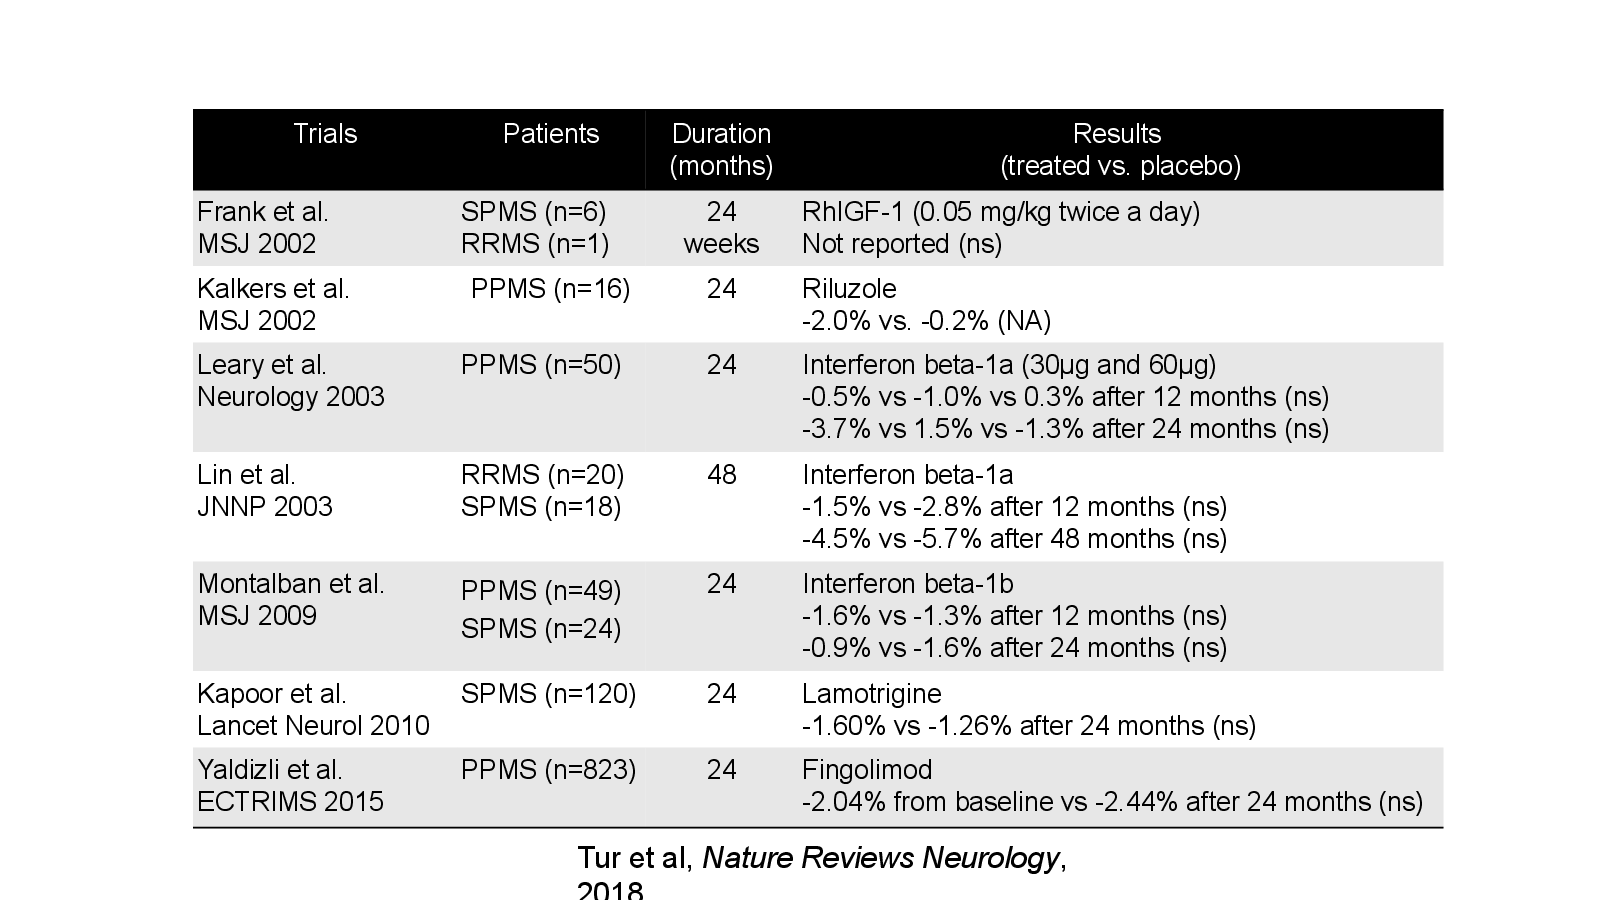
Tur et al, Nature Reviews Neurology, 2018
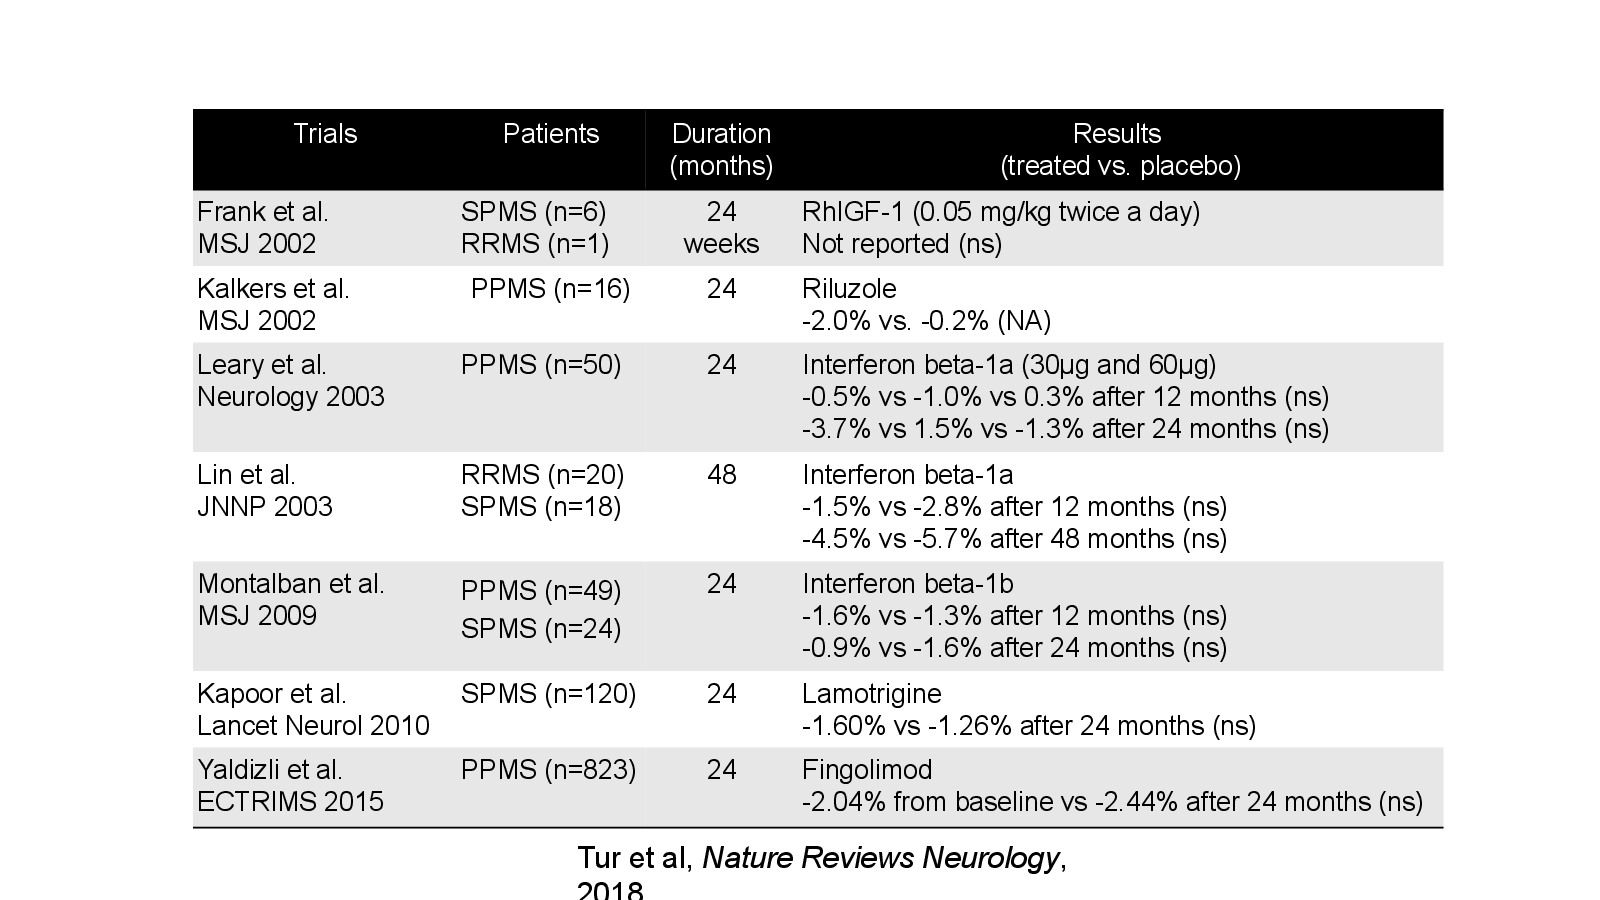
Open full-size slide↗- Trials — Patients — Duration / (months) — Results / (treated vs. placebo)
- Frank et al. / MSJ 2002 — SPMS (n=6) RRMS (n=1) — 24 / weeks — RhIGF-1 (0.05 mg/kg twice a day) / Not reported (ns)
- Kalkers et al. / MSJ 2002 — PPMS (n=16) — 24 — Riluzole / -2.0% vs. -0.2% (NA)
- Leary et al. / Neurology 2003 — PPMS (n=50) — 24 — Interferon beta-1a (30μg and 60μg) / -0.5% vs -1.0% vs 0.3% after 12 months (ns) / -3.7% vs 1.5% vs -1.3% after 24 months (ns)
- Lin et al. / JNNP 2003 — RRMS (n=20) / SPMS (n=18) — 48 — Interferon beta-1a / -1.5% vs -2.8% after 12 months (ns) / -4.5% vs -5.7% after 48 months (ns)
- Montalban et al. / MSJ 2009 — PPMS (n=49) SPMS (n=24) — 24 — Interferon beta-1b / -1.6% vs -1.3% after 12 months (ns) / -0.9% vs -1.6% after 24 months (ns)
- Kapoor et al. / Lancet Neurol 2010 — SPMS (n=120) — 24 — Lamotrigine / -1.60% vs -1.26% after 24 months (ns)
- Yaldizli et al. / ECTRIMS 2015 — PPMS (n=823) — 24 — Fingolimod / -2.04% from baseline vs -2.44% after 24 months (ns)
References
- Tur et al, Nature Reviews Neurology, 2018 — PubMed
- Frank et al. / MSJ 2002 — SPMS (n=6) RRMS (n=1) — 24 / weeks — RhIGF-1 (0.05 mg/kg twice a day) / Not reported (ns) — PubMed search
- Kalkers et al. / MSJ 2002 — PPMS (n=16) — 24 — Riluzole / -2.0% vs. -0.2% (NA) — PubMed search
- Leary et al. / Neurology 2003 — PPMS (n=50) — 24 — Interferon beta-1a (30μg and 60μg) / -0.5% vs -1.0% vs 0.3% after 12 months (ns) / -3.7% vs 1.5% vs -1.3% after 24 months (ns) — PubMed search
- Lin et al. / JNNP 2003 — RRMS (n=20) / SPMS (n=18) — 48 — Interferon beta-1a / -1.5% vs -2.8% after 12 months (ns) / -4.5% vs -5.7% after 48 months (ns) — PubMed search
- Montalban et al. / MSJ 2009 — PPMS (n=49) SPMS (n=24) — 24 — Interferon beta-1b / -1.6% vs -1.3% after 12 months (ns) / -0.9% vs -1.6% after 24 months (ns) — PubMed search
- Kapoor et al. / Lancet Neurol 2010 — SPMS (n=120) — 24 — Lamotrigine / -1.60% vs -1.26% after 24 months (ns) — PubMed search
- Yaldizli et al. / ECTRIMS 2015 — PPMS (n=823) — 24 — Fingolimod / -2.04% from baseline vs -2.44% after 24 months (ns) — PubMed search
Slide 31
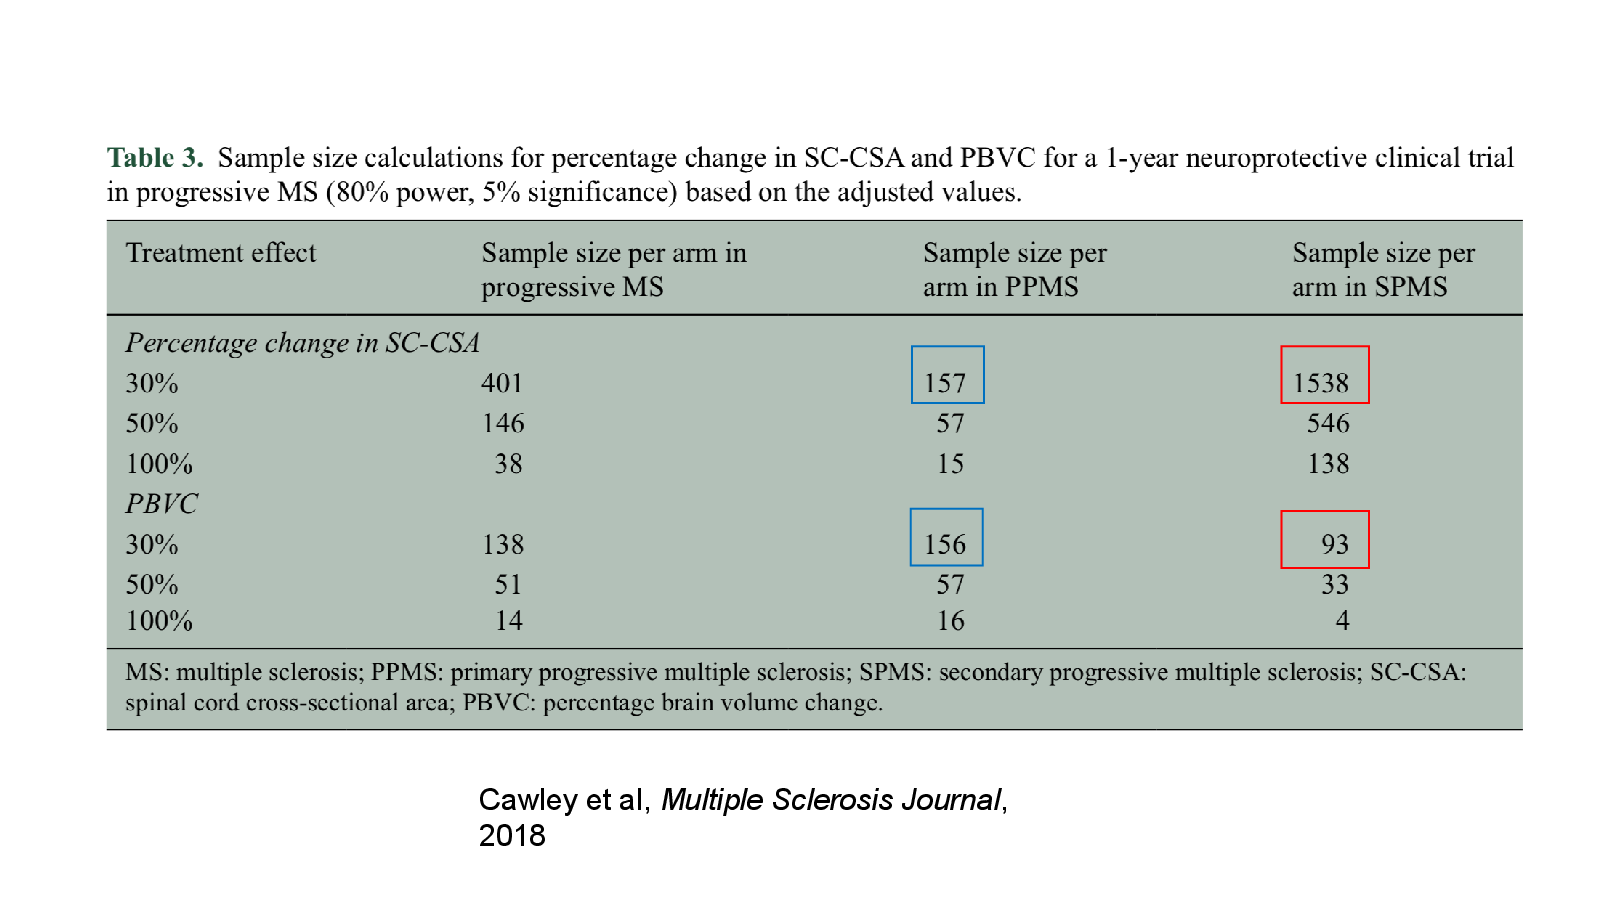
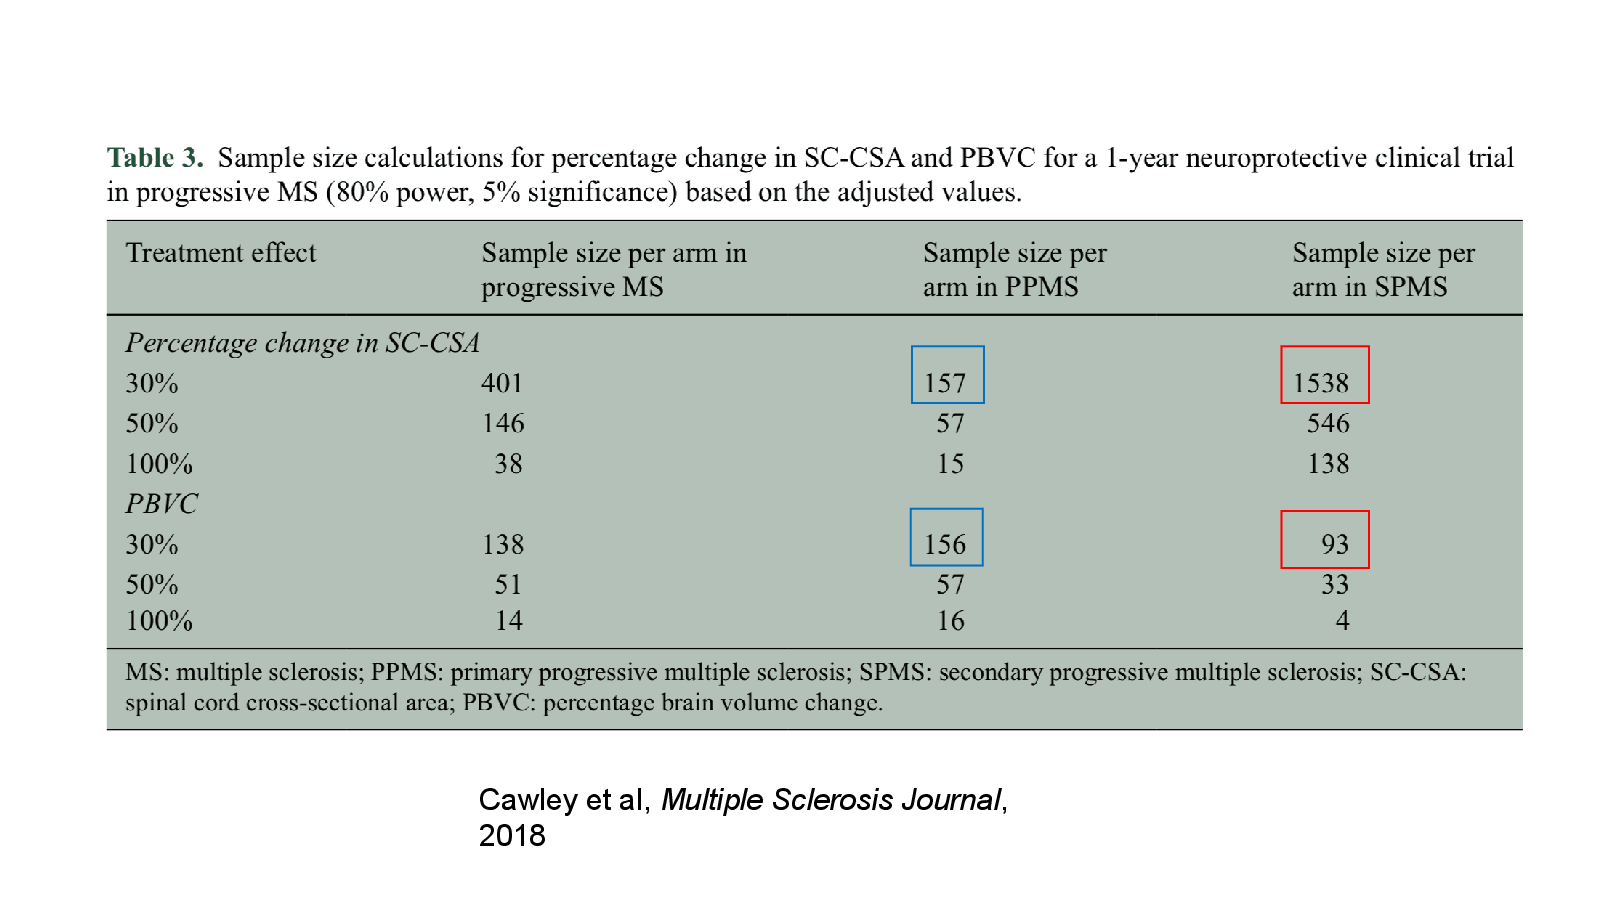
Cawley et al, Multiple Sclerosis Journal, 2018
Open full-size slide↗Speaker notes+
cord atrophy may not be a useful outcome measure in SPMS who have not showed a steady progression as the major cause of increasing disability in the preceding 2years history, have long disease duration and marked SC atrophy at study entry.
References
Slide 32
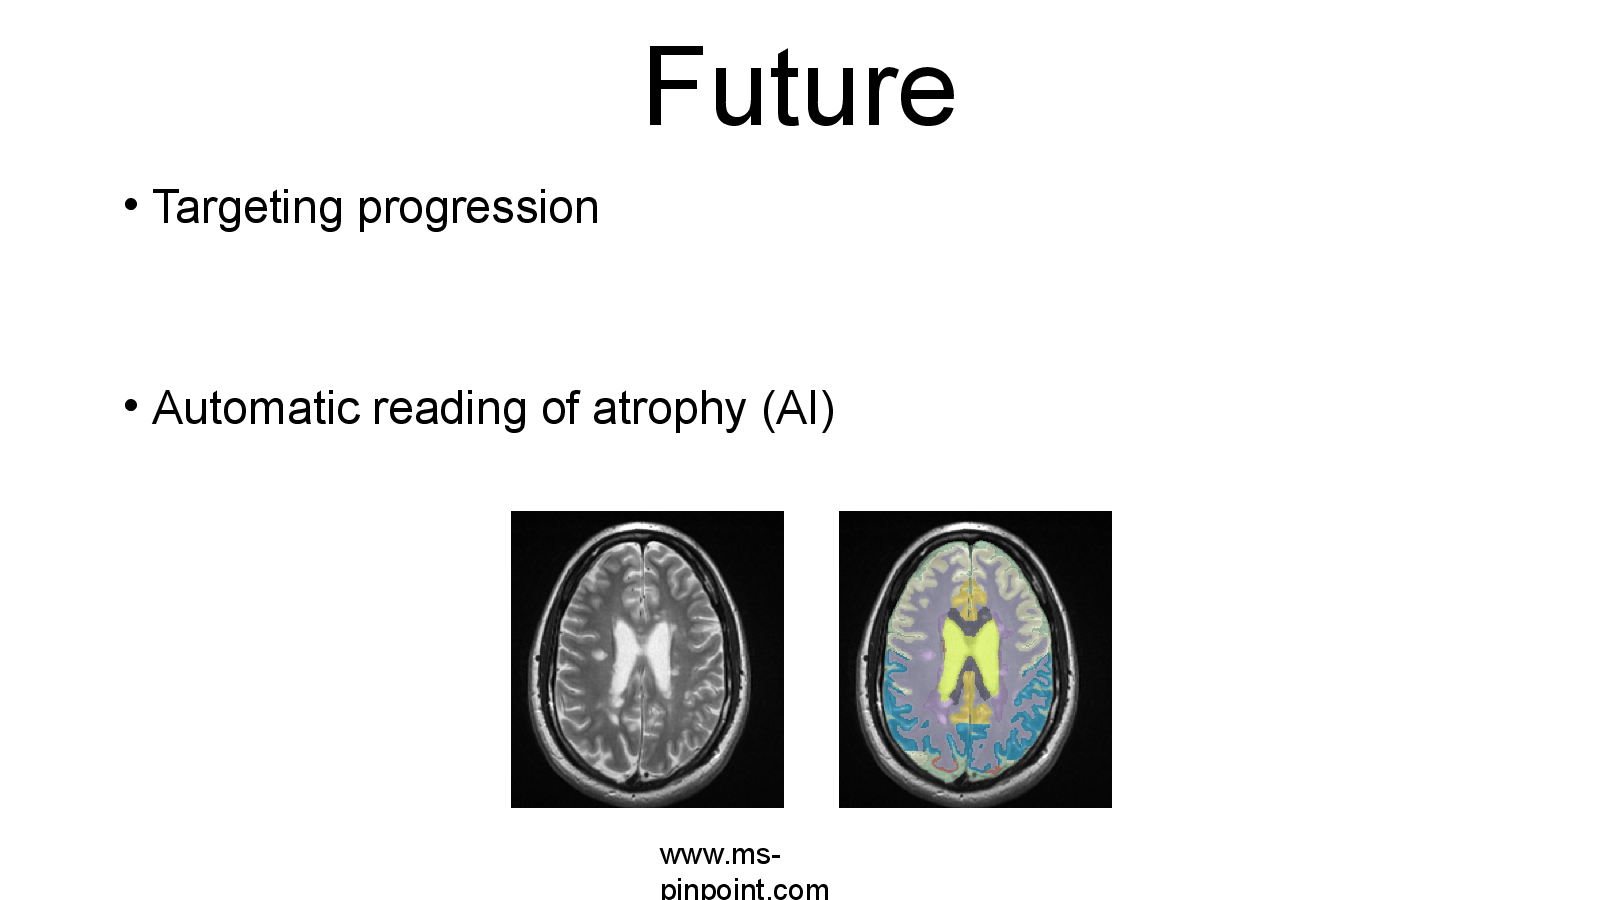
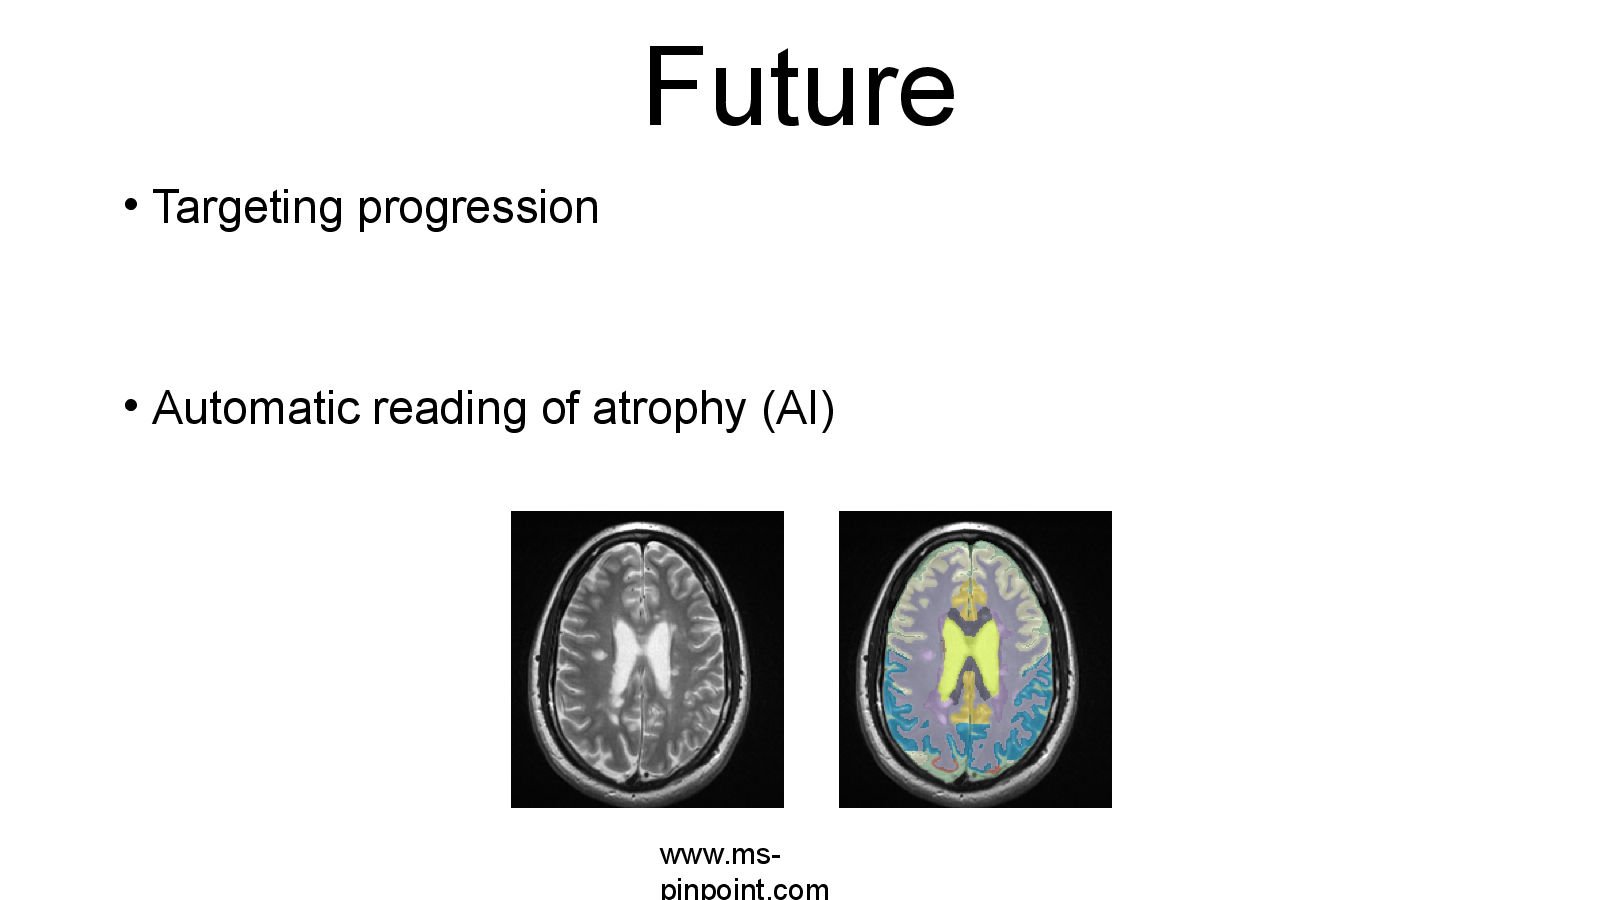
Future
Open full-size slide↗Targeting progression
Automatic reading of atrophy (AI)
www.ms-pinpoint.com
Slide 33
Conclusion
Open full-size slide↗Evolving concept of “progression”
Signs of progressive disease
Future
Slide 34
Slide 34
Open full-size slide↗Email: a.eshaghi@ucl.ac.uk
Slide 35
Slide 35
Open full-size slide↗