All talks & lectures

Debate ·

Is AI Ready to Be Used in Clinical Prediction in Neurology?
An EAN Science School lecture weighing clinical evidence for AI against questions of validation, bias and utility.

EAN Science School

A web sketch of the deck’s central idea
Delivered
Event
EAN Science School
Format
Debate
Source deck
27 slides

From the slides

Deck notes

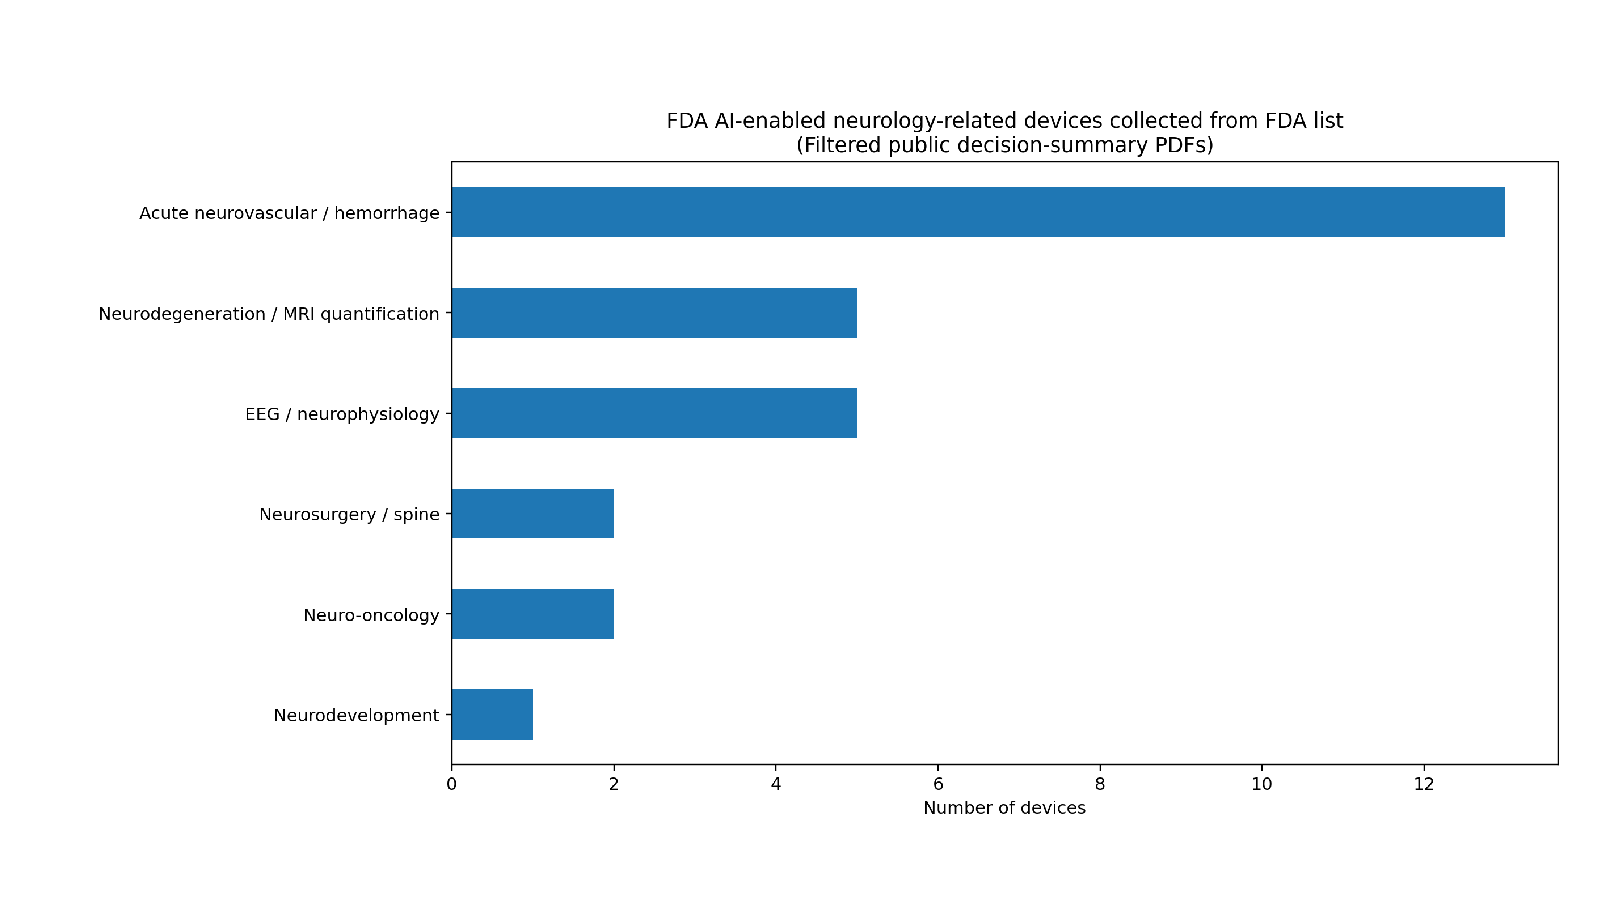
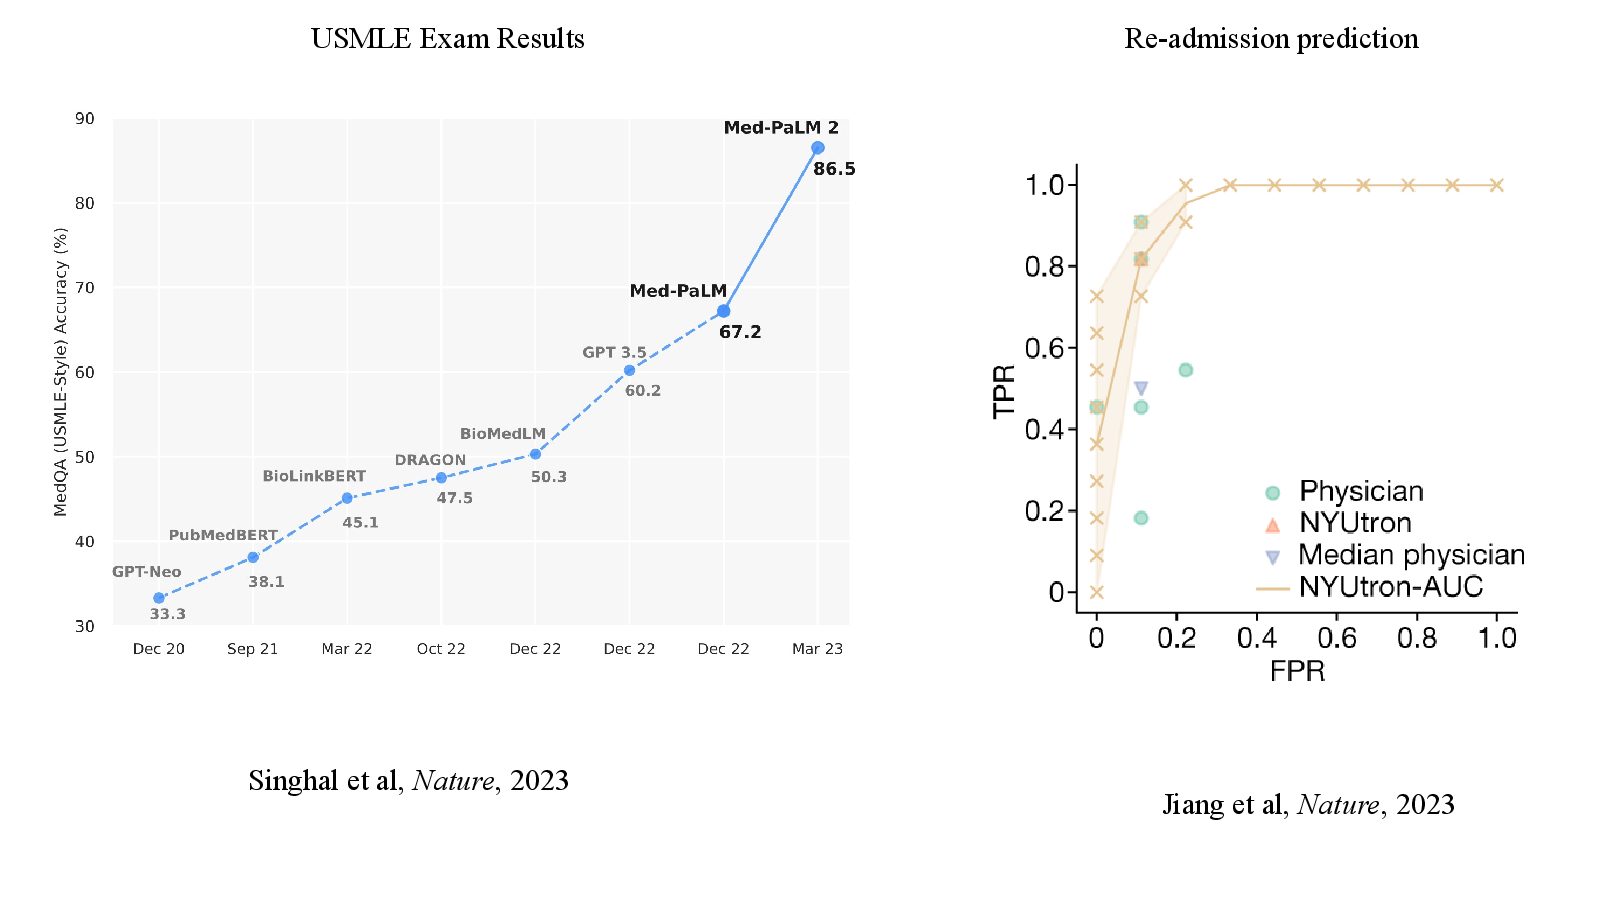
This lecture considered where clinical AI is useful now and what still limits prediction in neurology. Examples ranged from monitoring and prognosis to phenotyping, clinical text and fairness.

The question

Is the available evidence strong enough for AI predictions to influence neurological care?

Deck outline

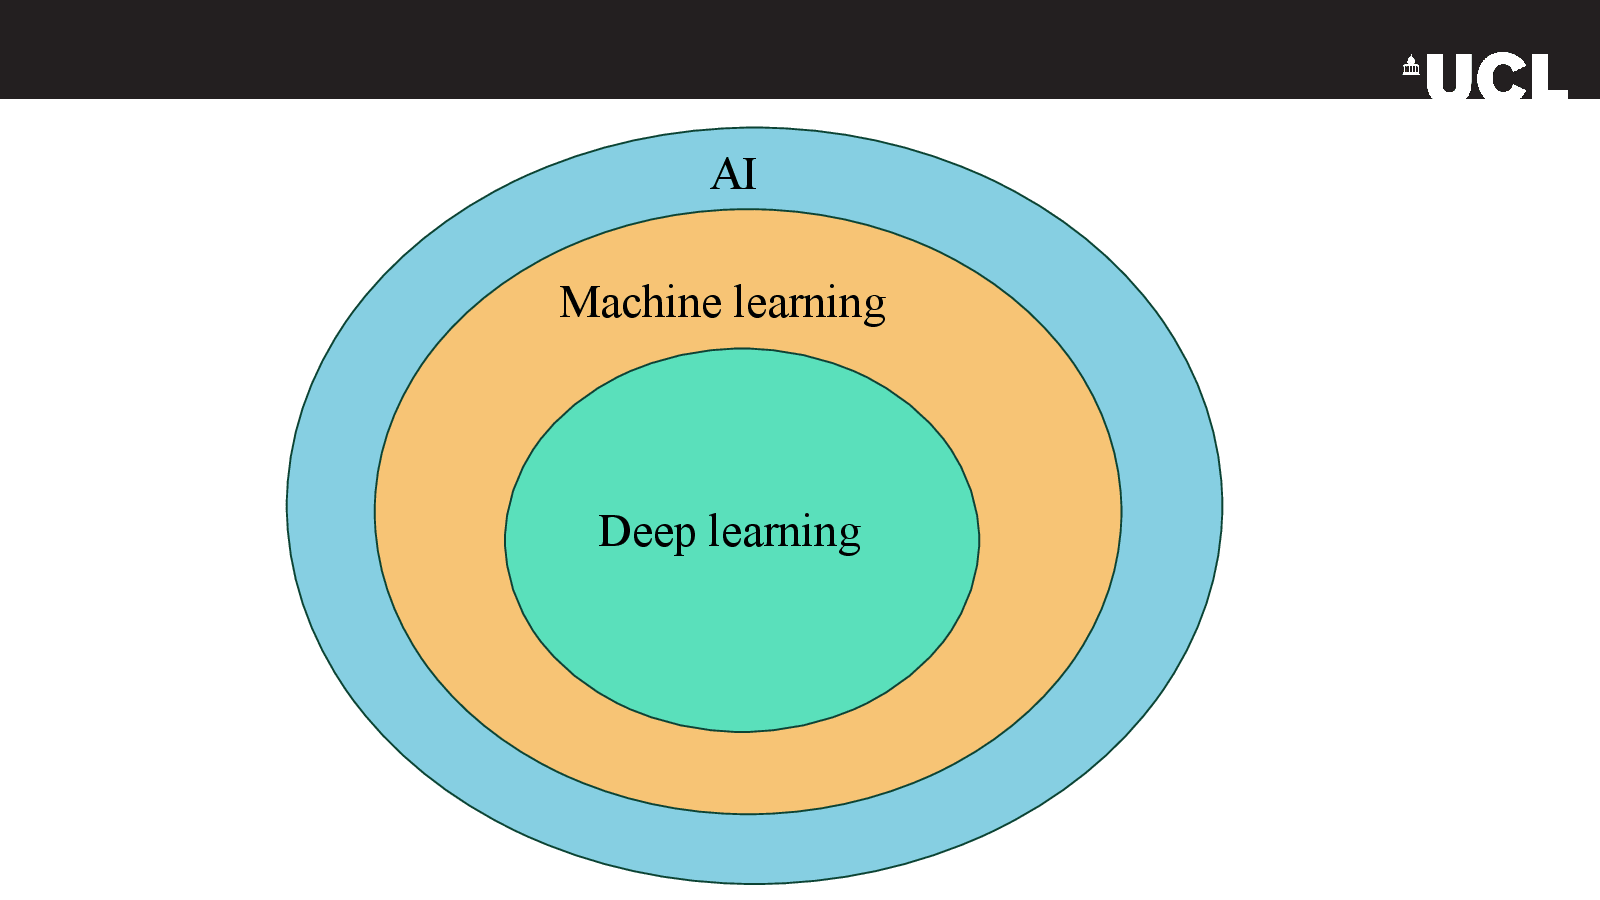
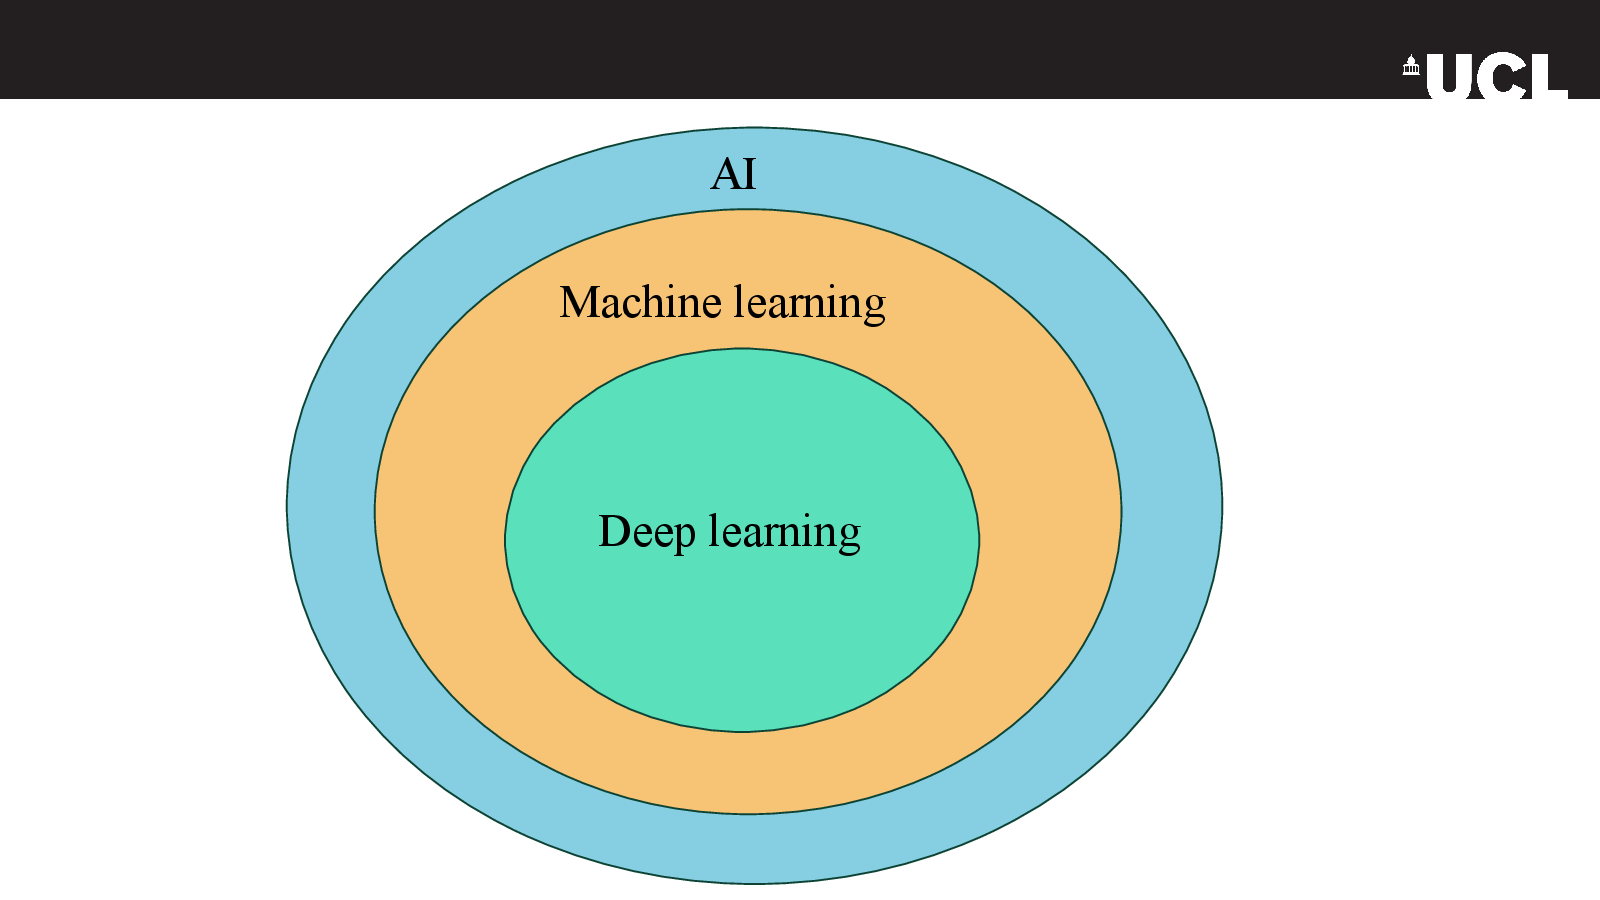
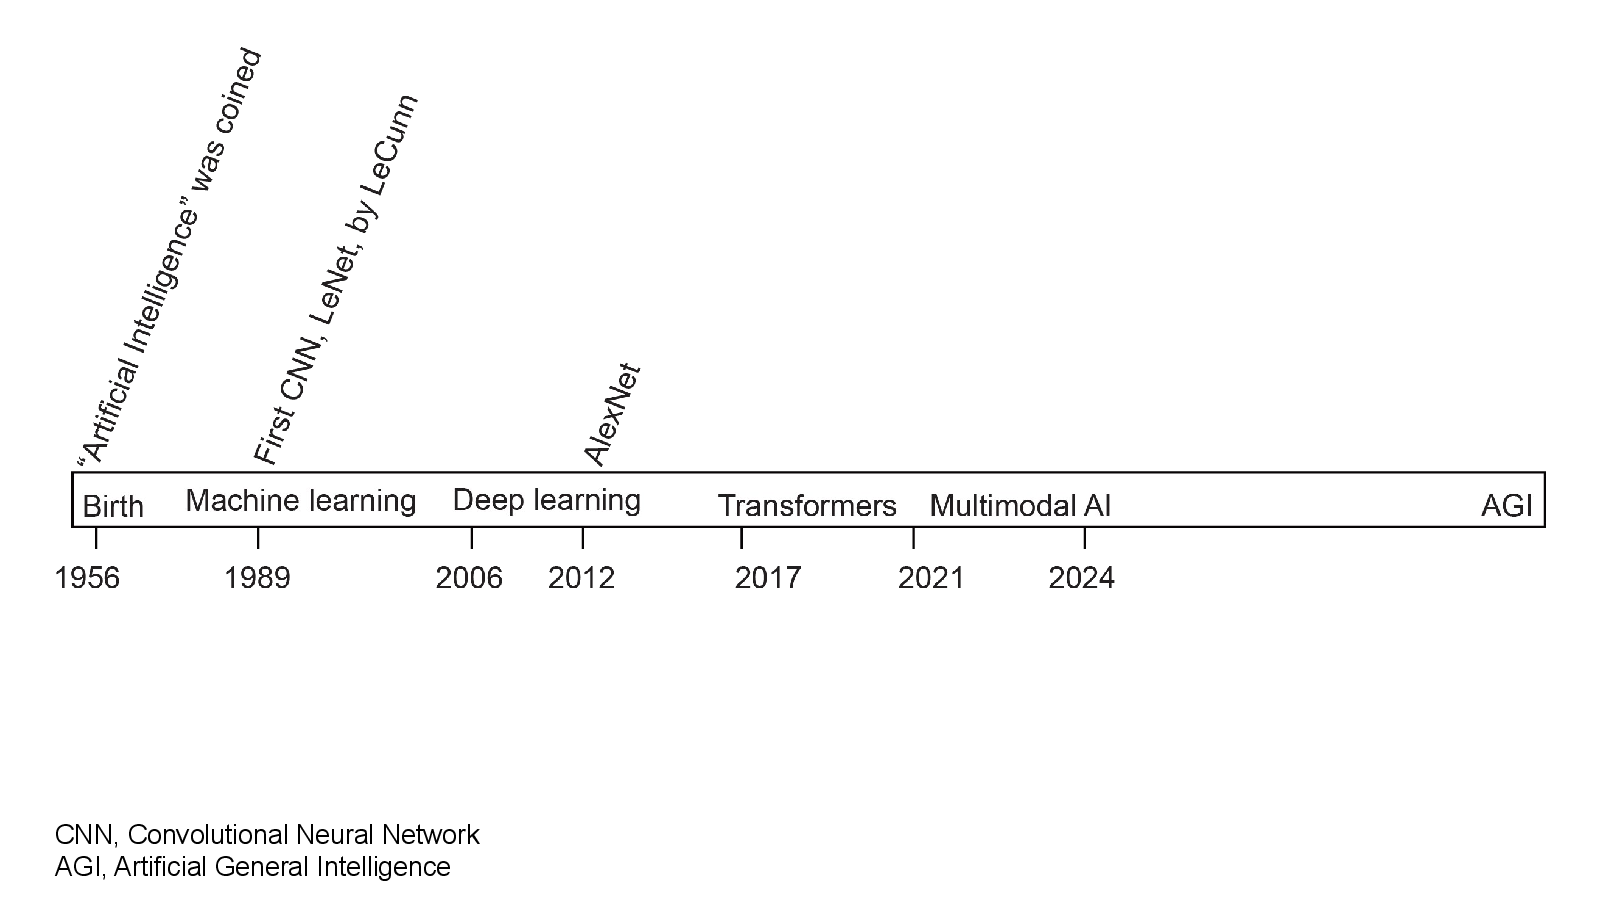
  • The relationship between AI, machine learning and deep learning
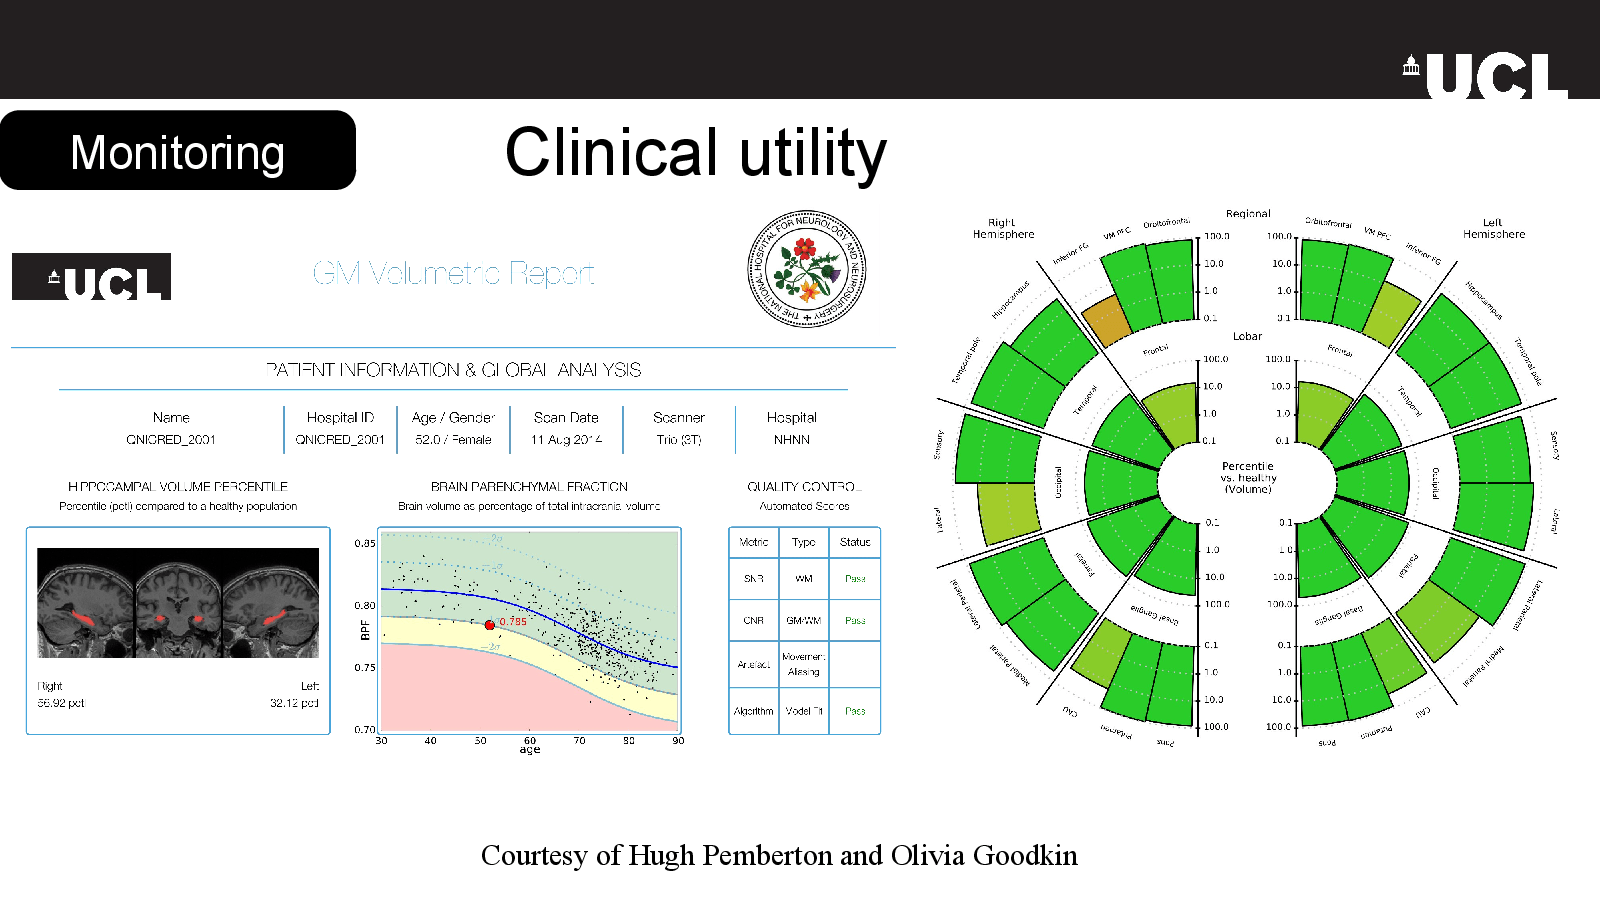
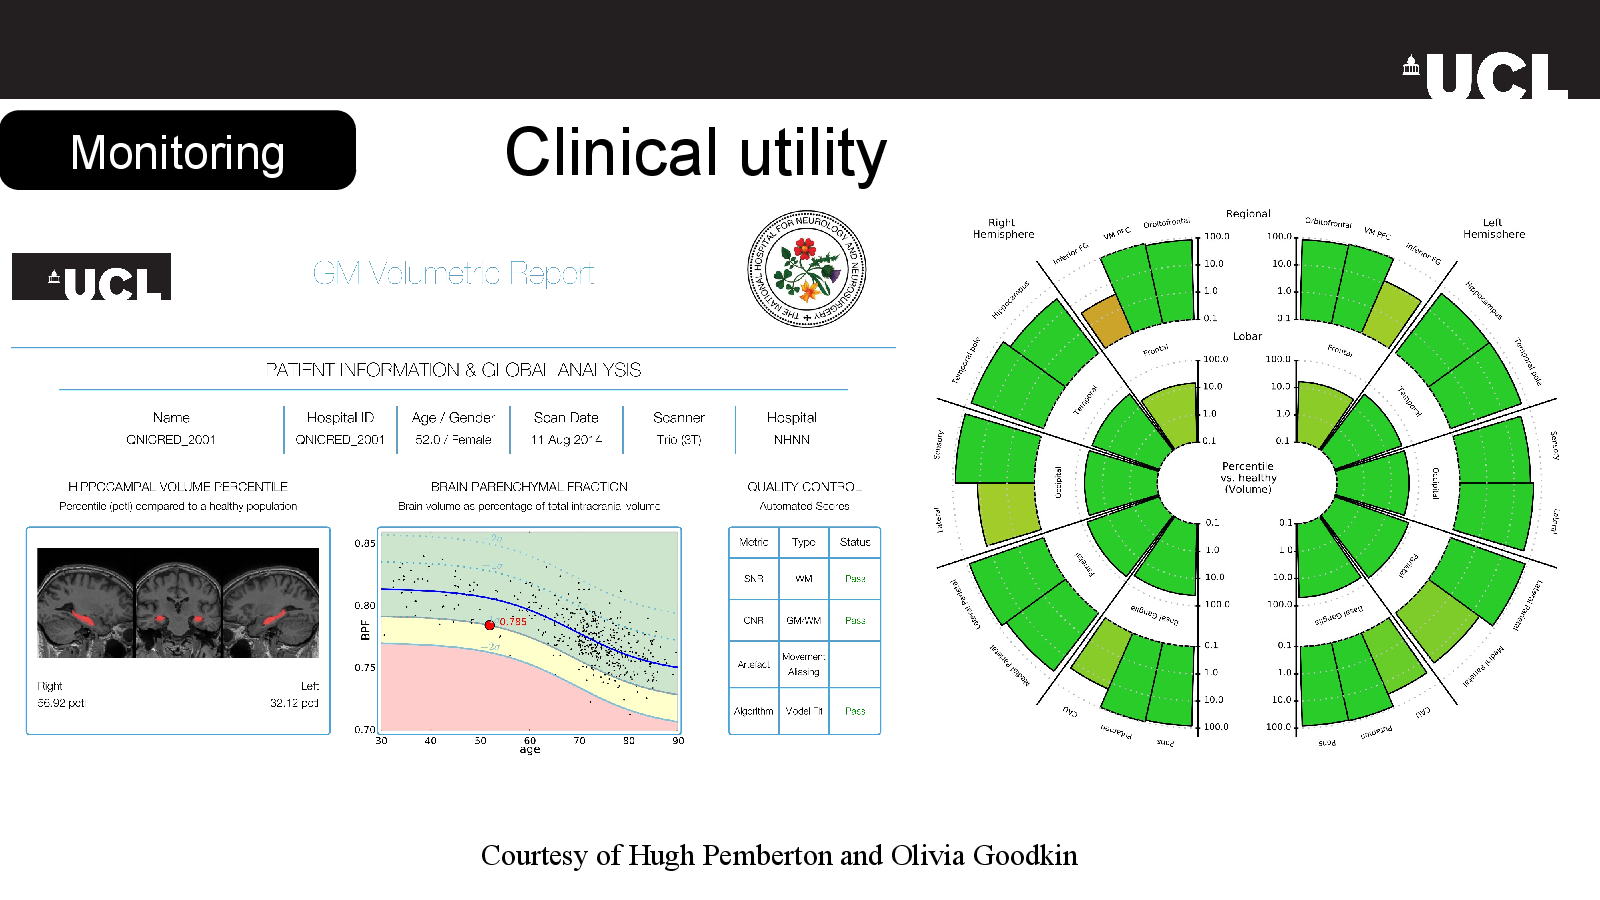
  • Evidence and maturity in neurological monitoring
  • Phenotyping, subtyping and prognosis
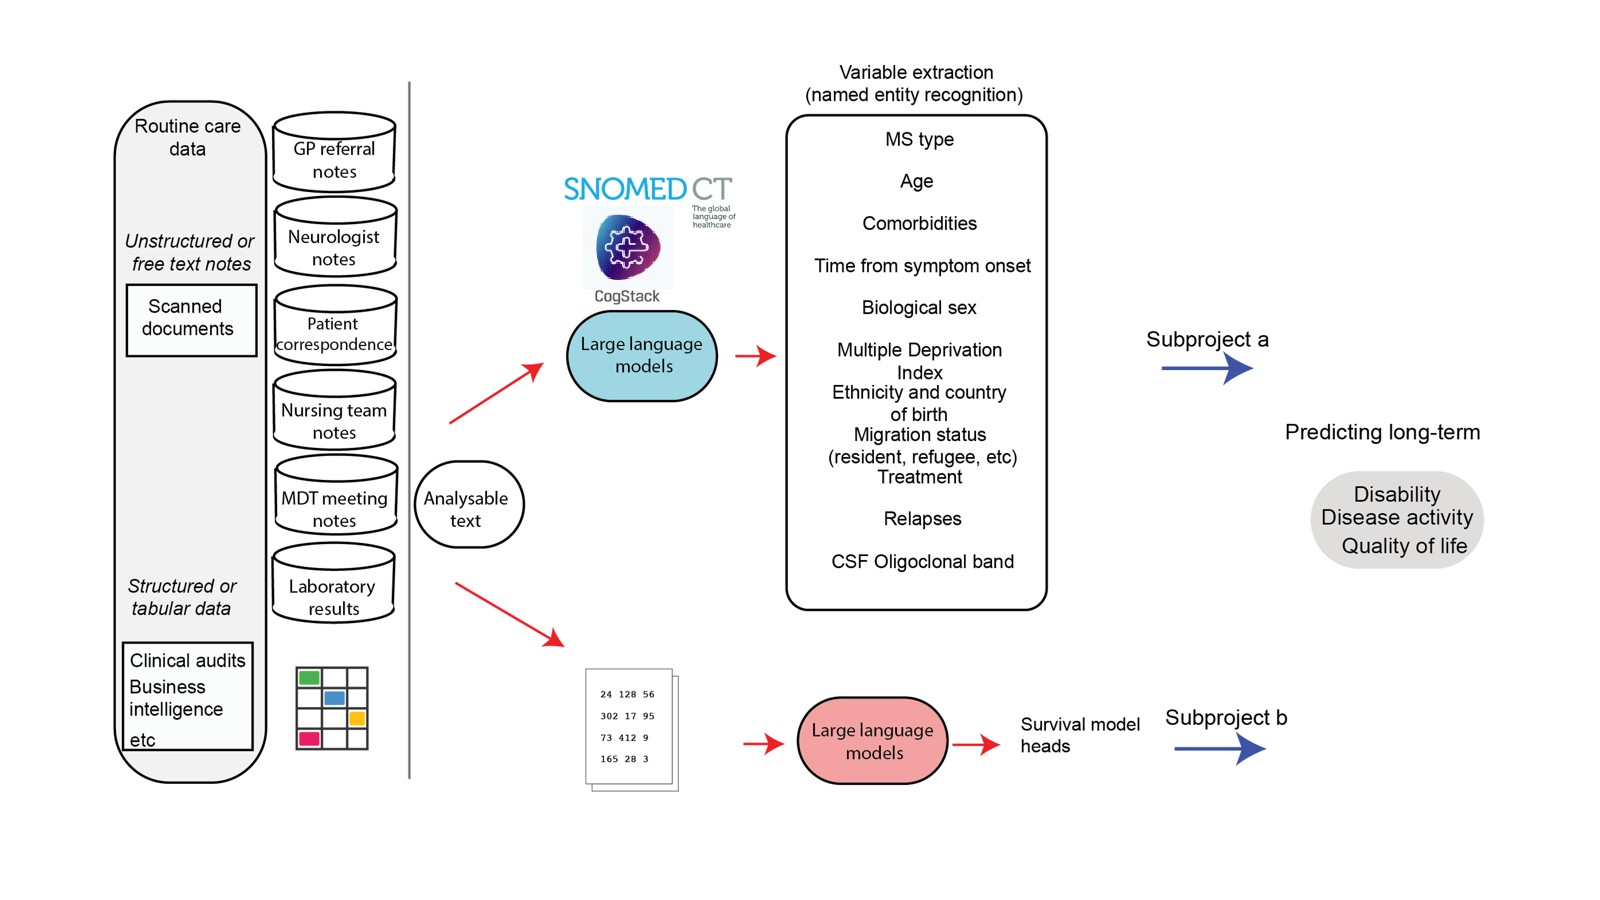
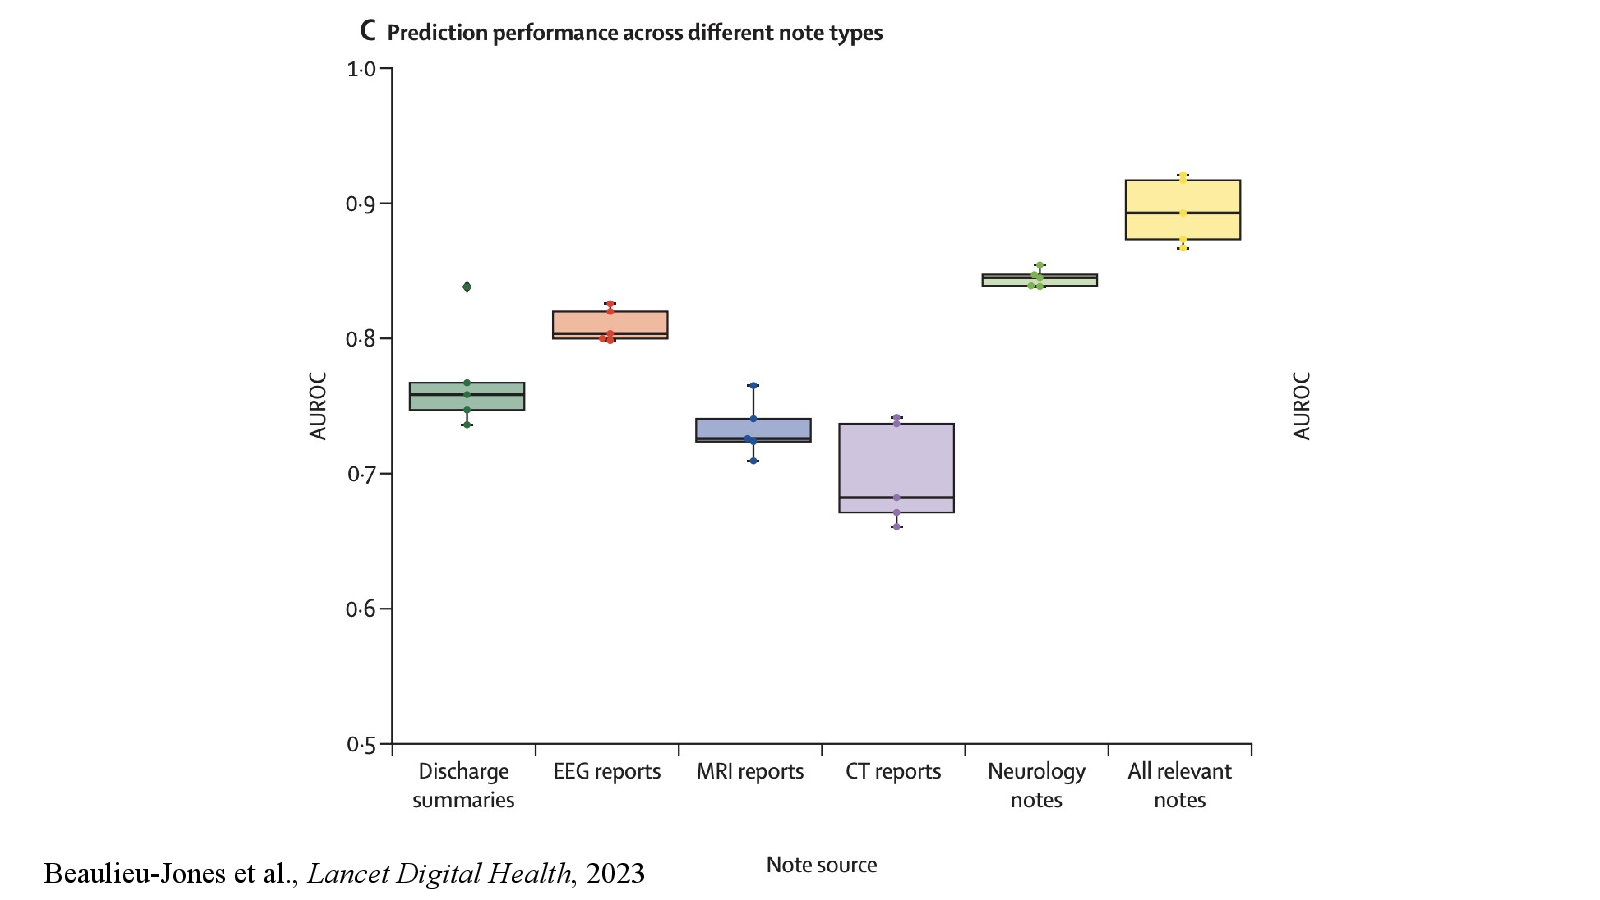
  • Learning from unstructured clinical records
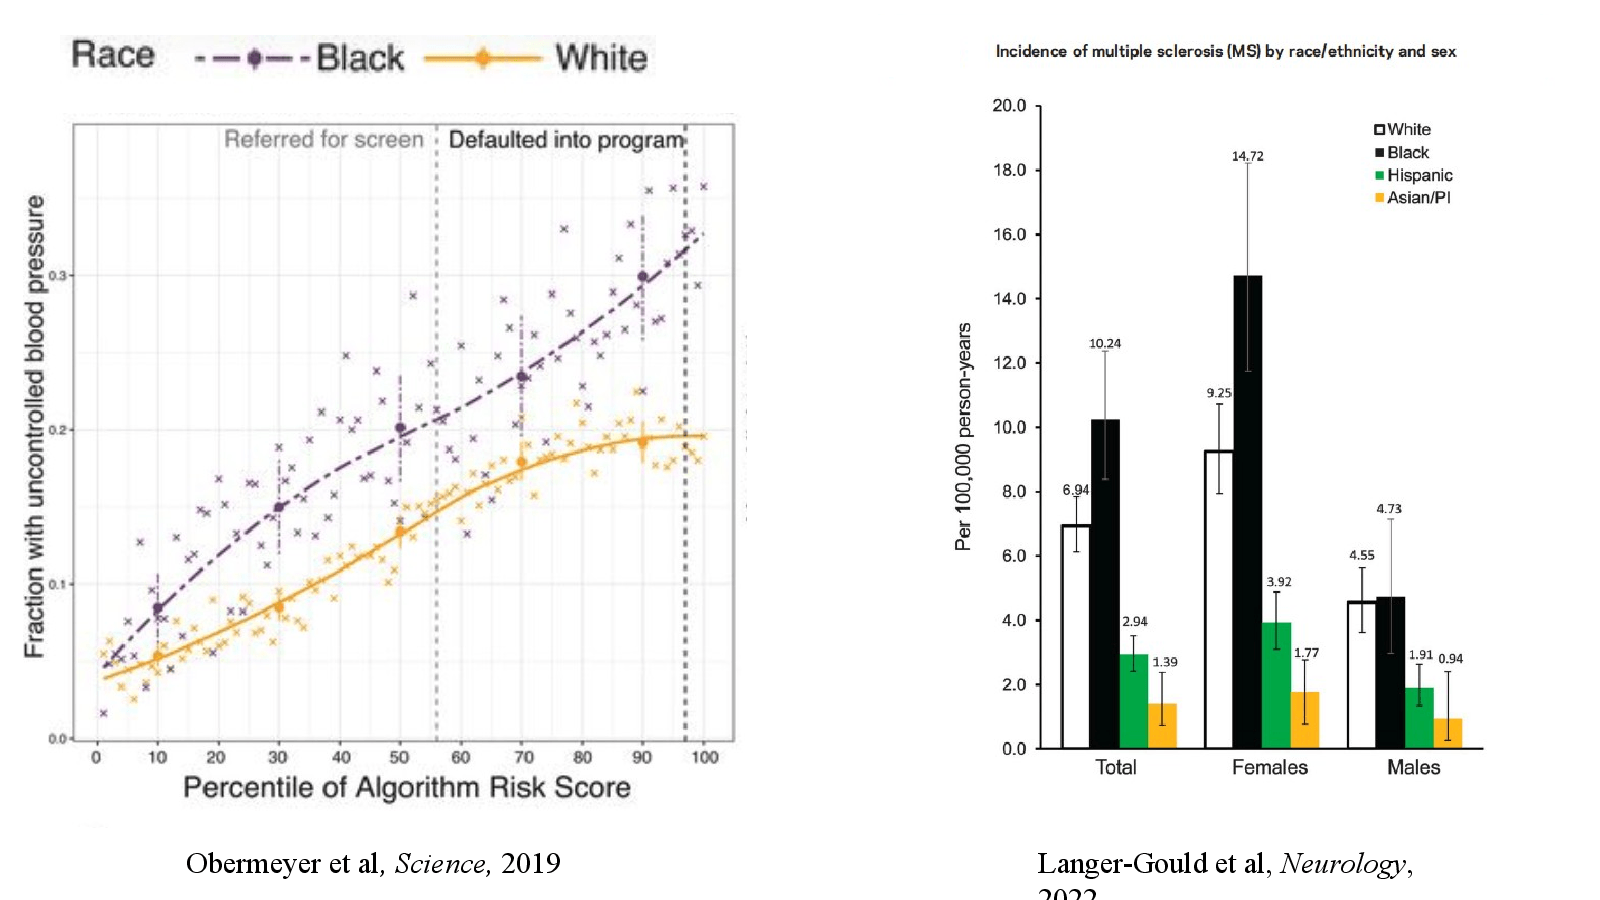
  • Bias, fairness and equity
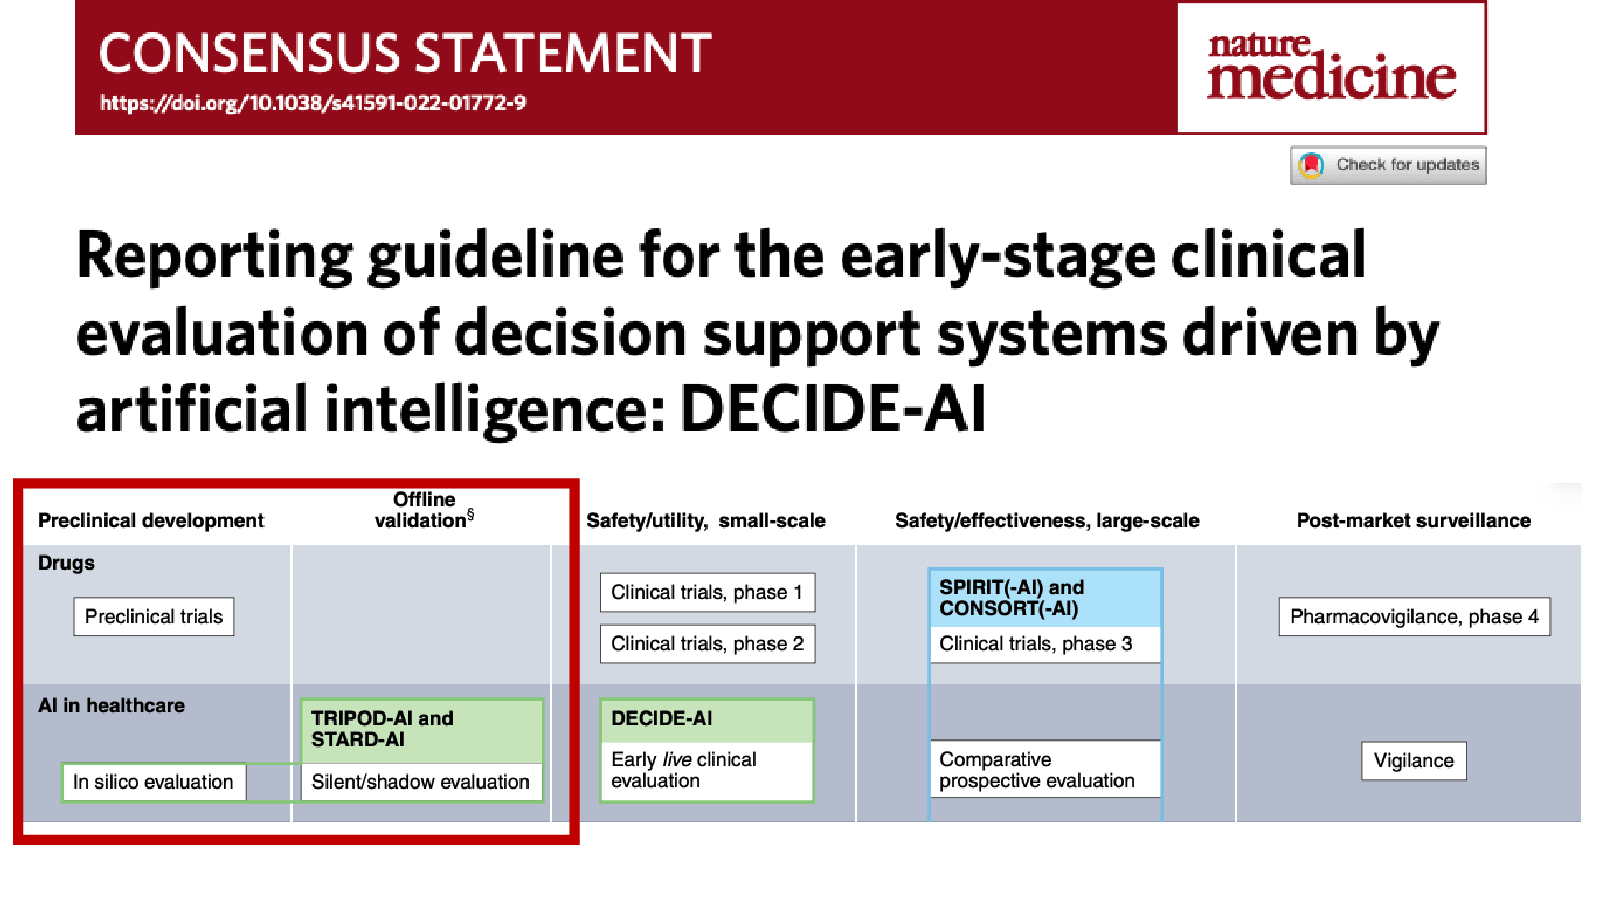
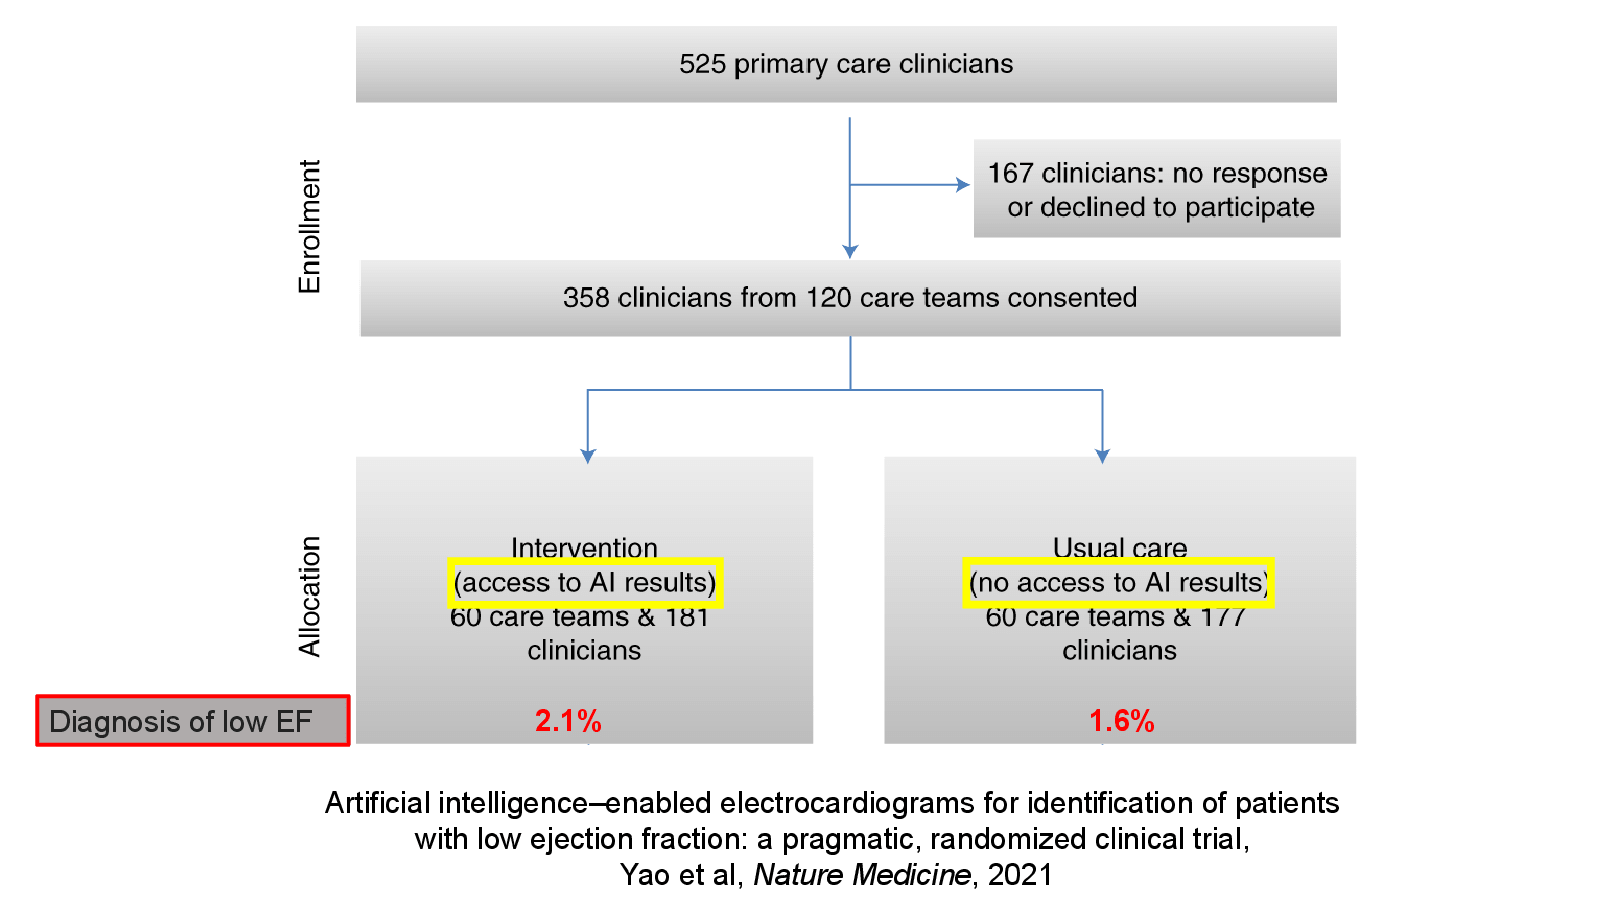
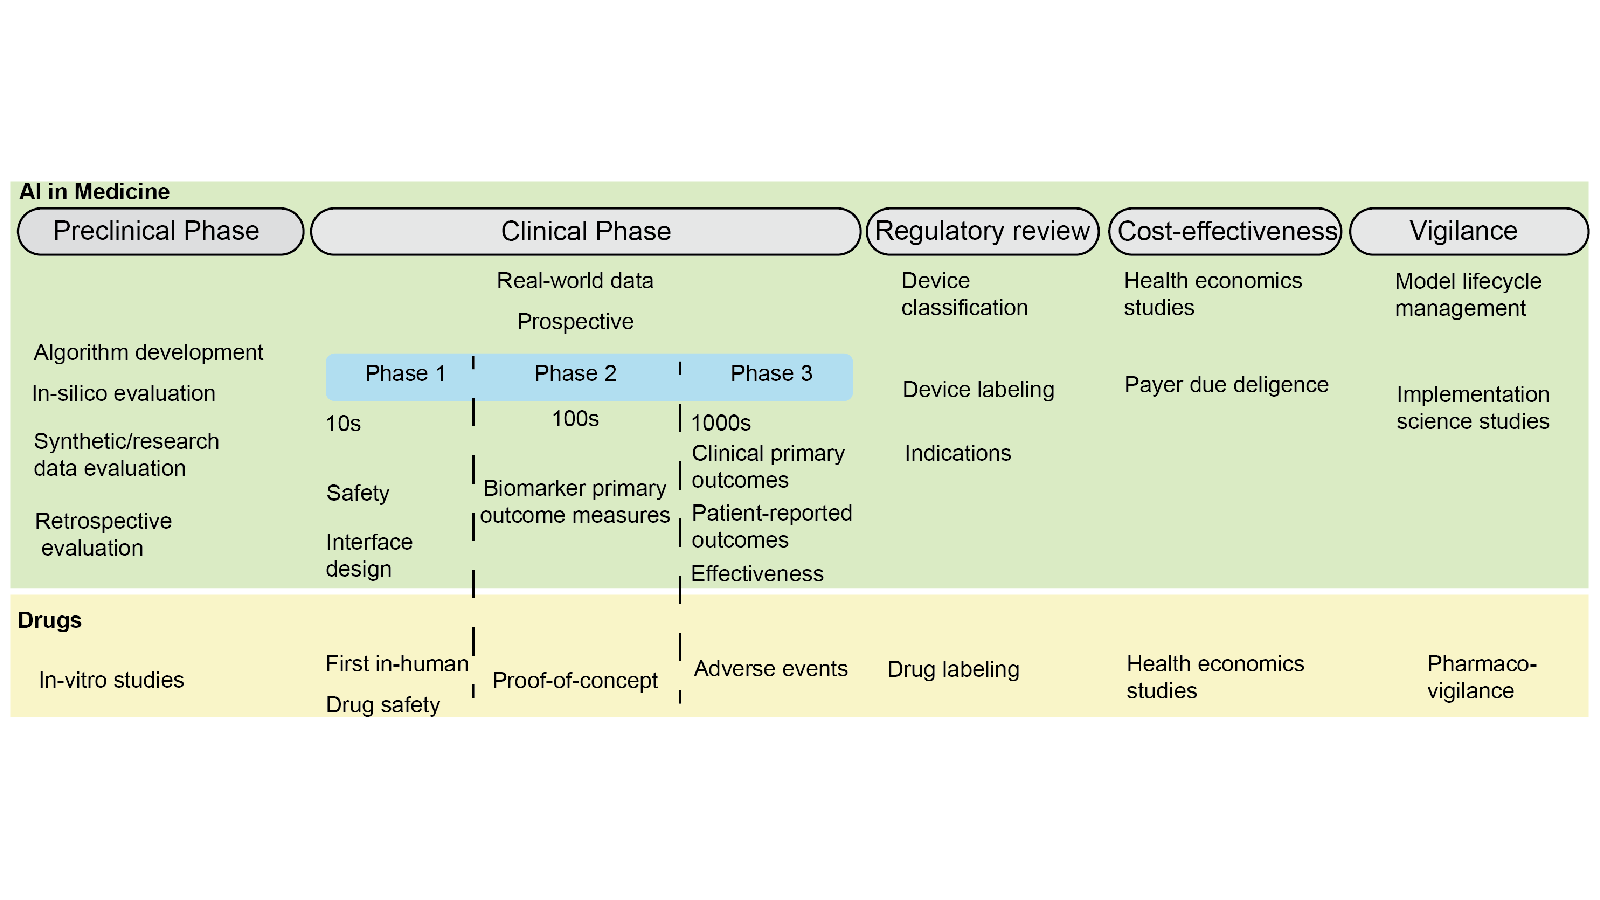
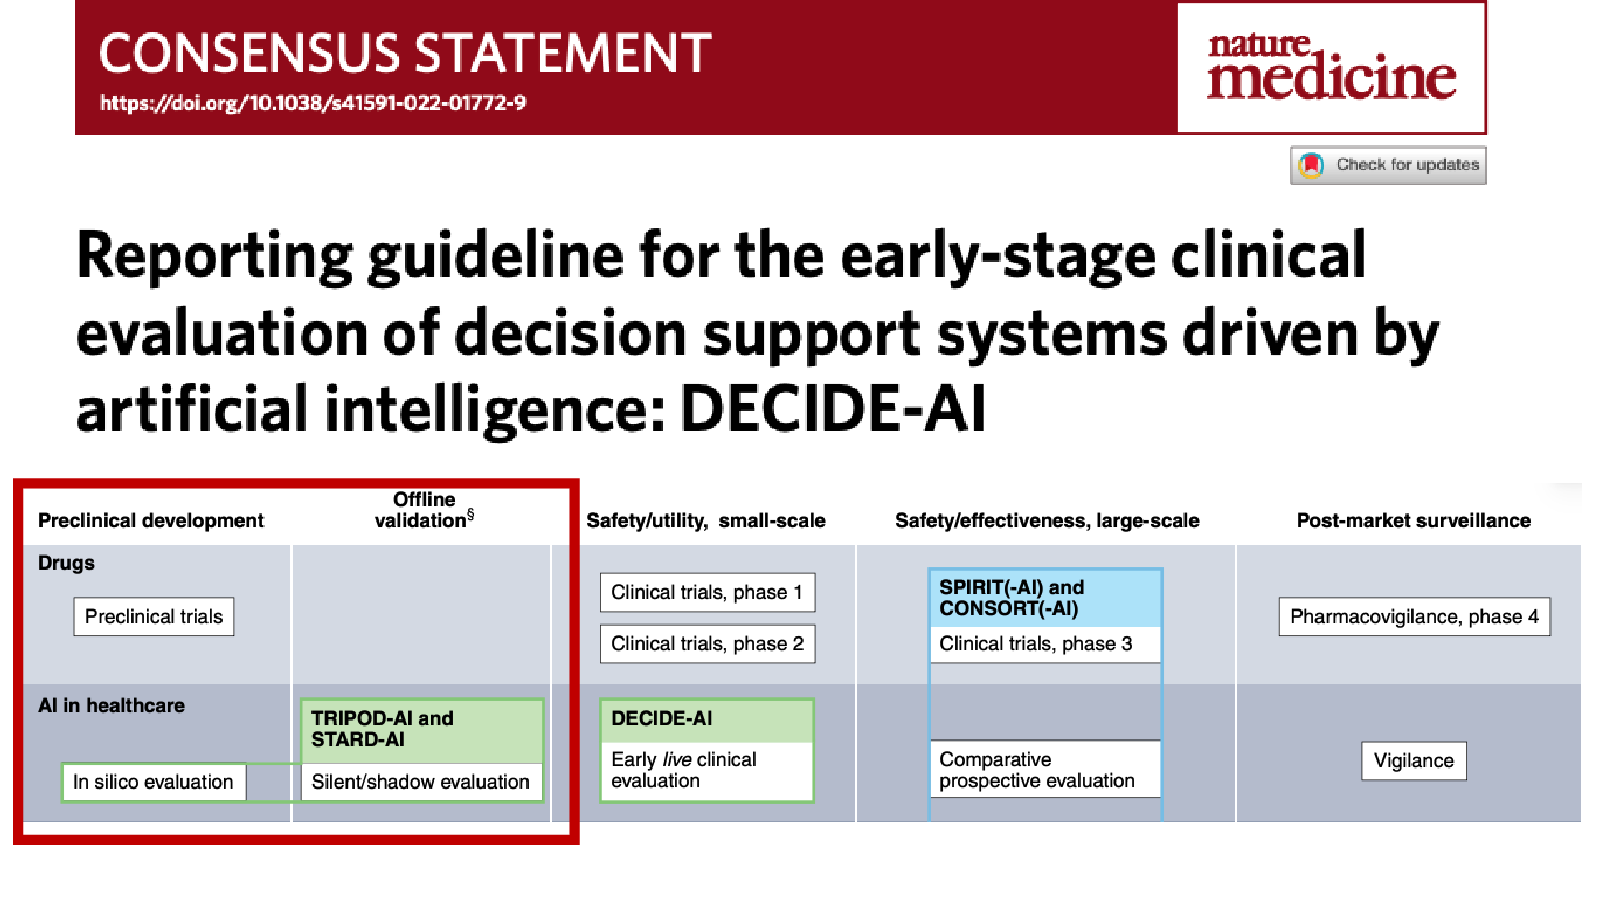
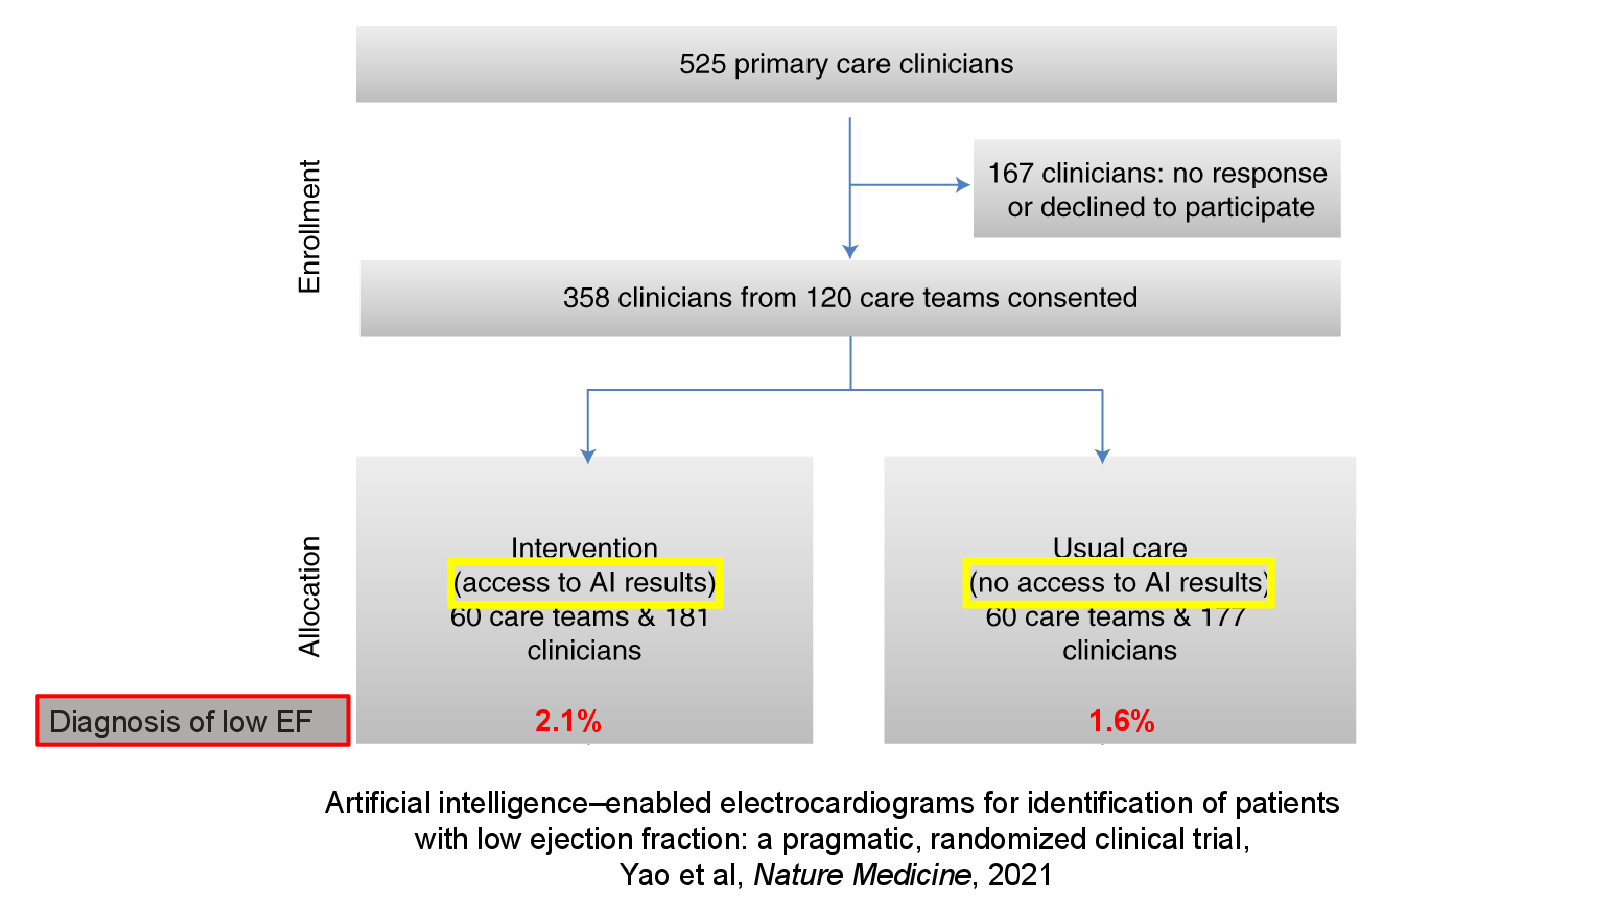
  • Clinical utility and the remaining route to deployment

Take-away

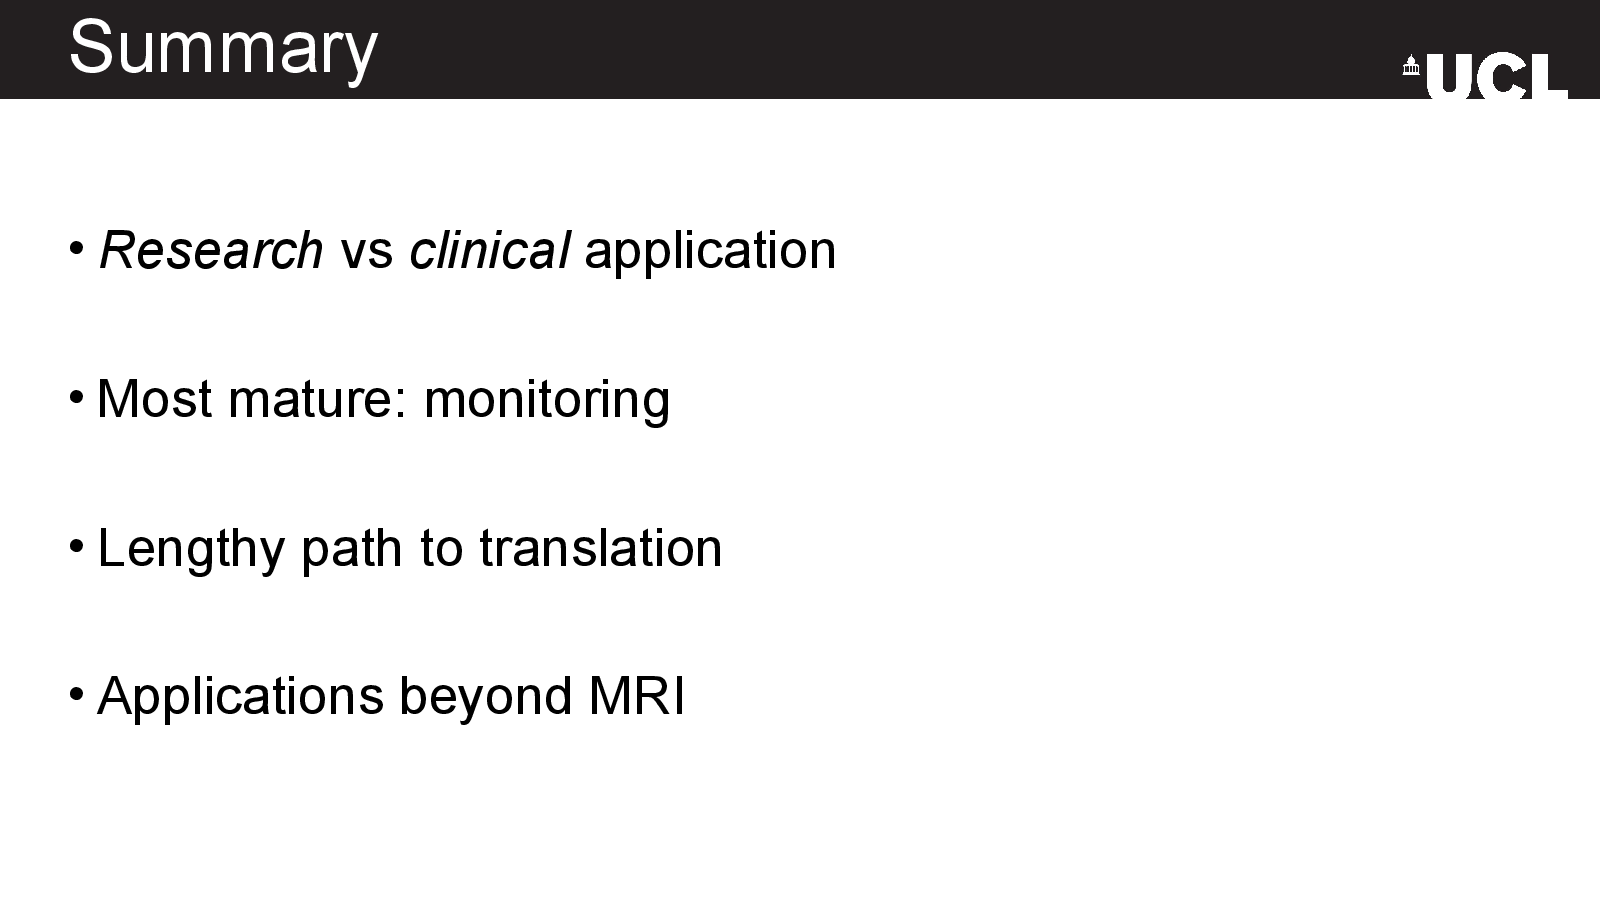
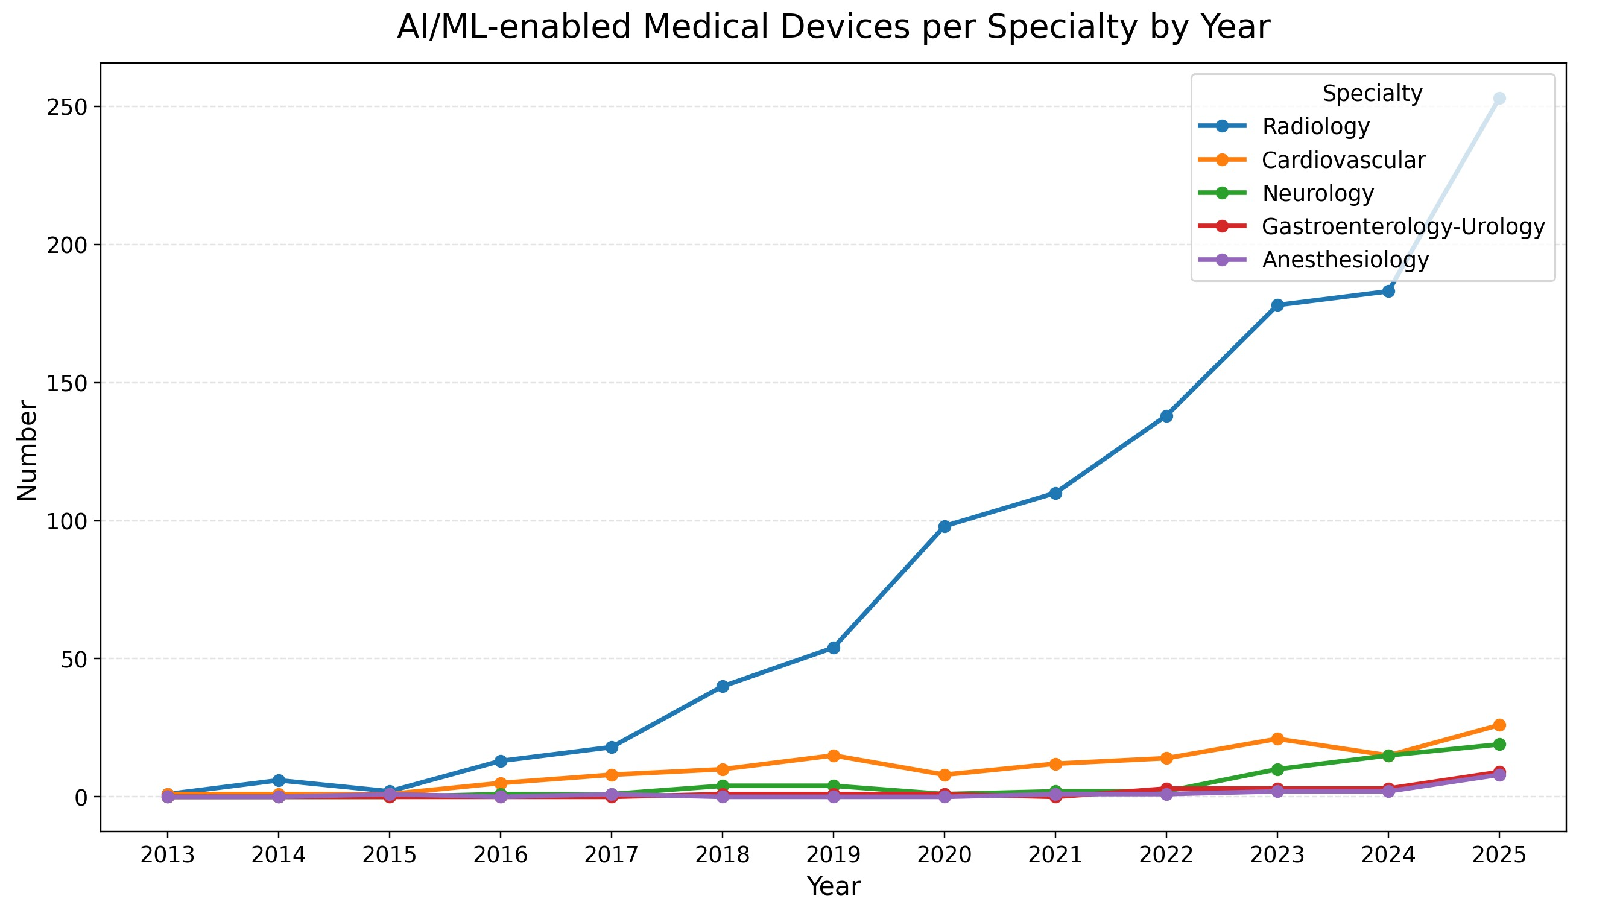
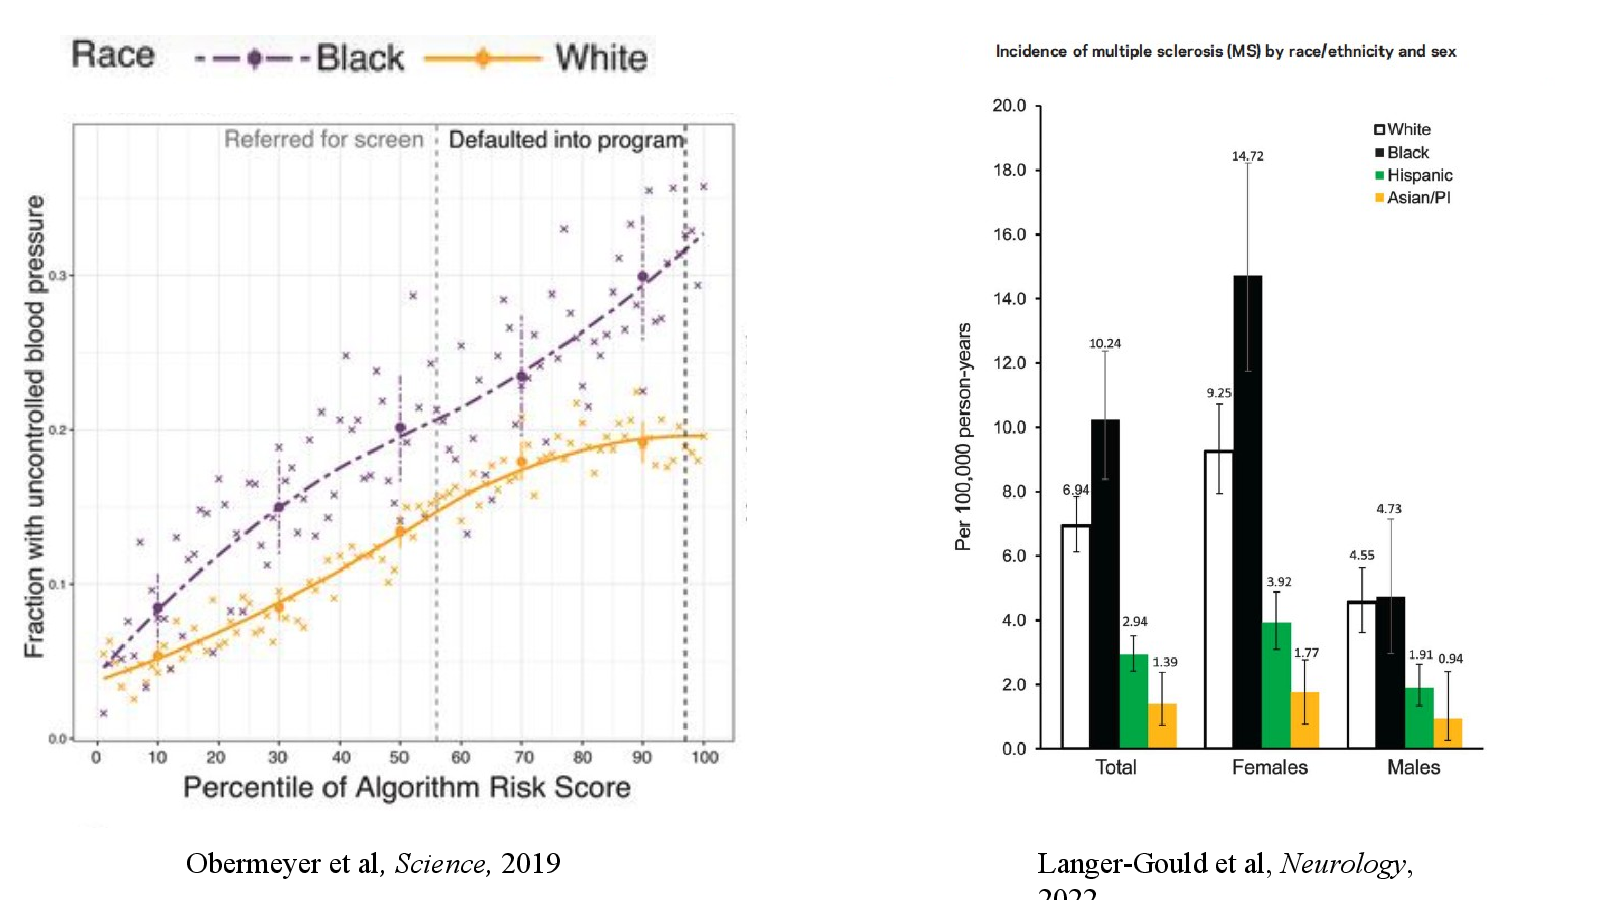
Monitoring is closest to routine use; broader prediction requires stronger validation, attention to bias and evidence that the result is clinically useful.

Original deck

Slide by slide

Read the 27-slide presentation in order, or use the index to jump.

  1. Slide 01

    Is AI Ready to Be Used in Clinical Prediction in Neurology?

    Slide 1: Is AI Ready to Be Used in Clinical Prediction in Neurology?Open full-size slide

    Arman Eshaghi, MD, PhD

    NIHR Advanced Fellow

    Queen Square Institute of Neurology

    University College London

    UK

  2. Slide 02

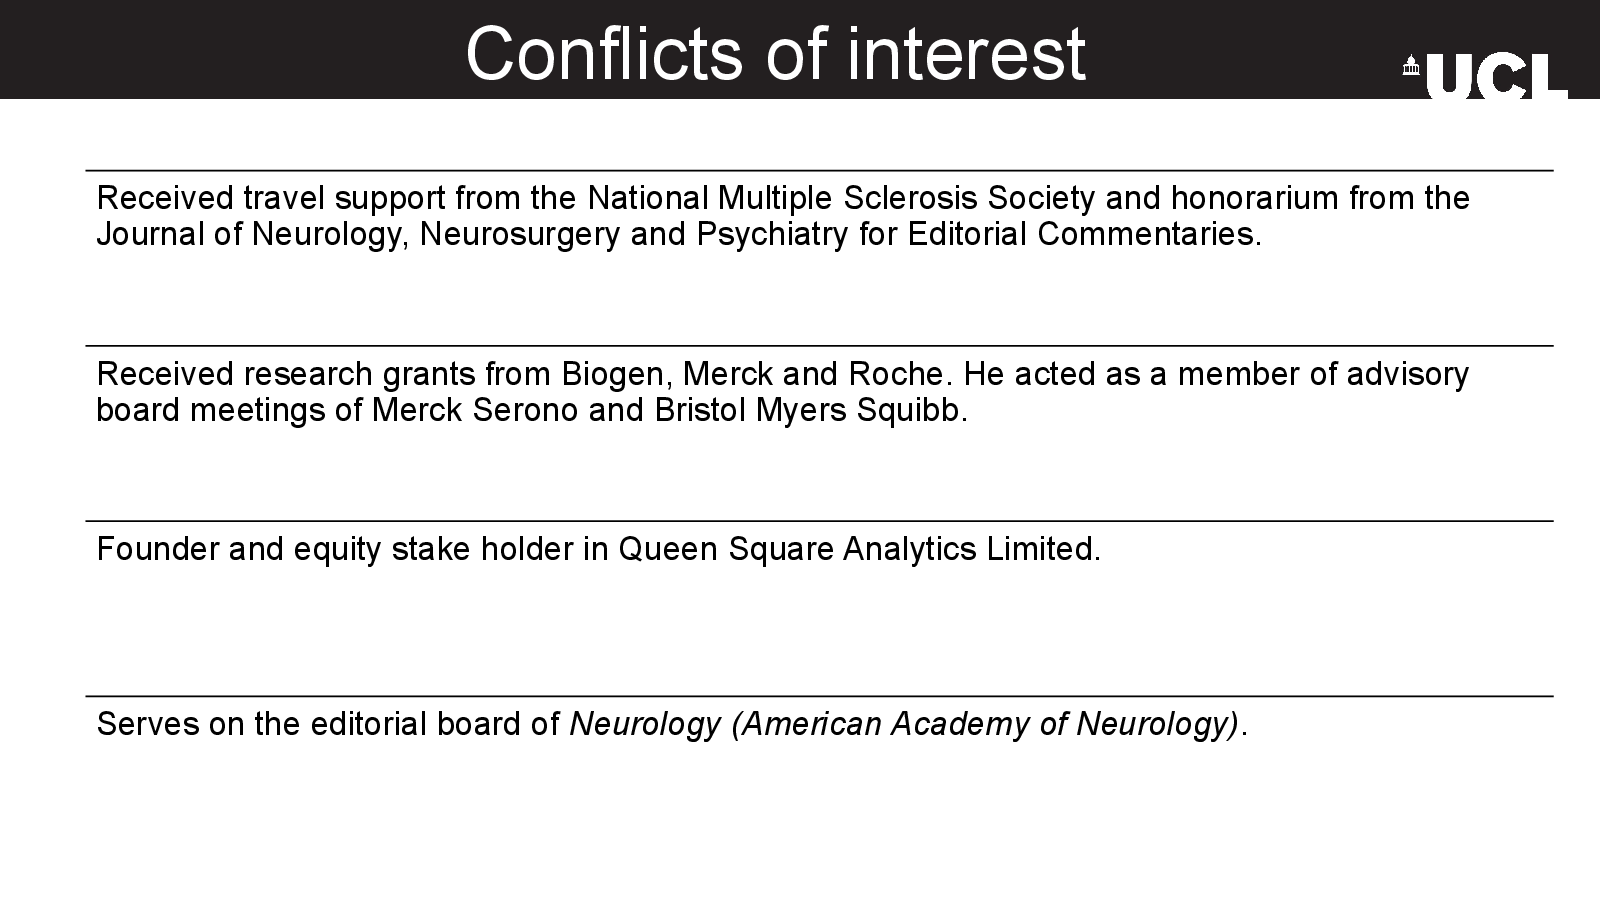
    Conflicts of interest

    Slide 2: Conflicts of interestOpen full-size slide
    • Received travel support from the National Multiple Sclerosis Society and honorarium from the Journal of Neurology, Neurosurgery and Psychiatry for Editorial Commentaries.
    • Received research grants from Biogen, Merck and Roche. He acted as a member of advisory board meetings of Merck Serono and Bristol Myers Squibb.
    • Founder and equity stake holder in Queen Square Analytics Limited.
    • Serves on the editorial board of Neurology (American Academy of Neurology).
  3. Slide 03

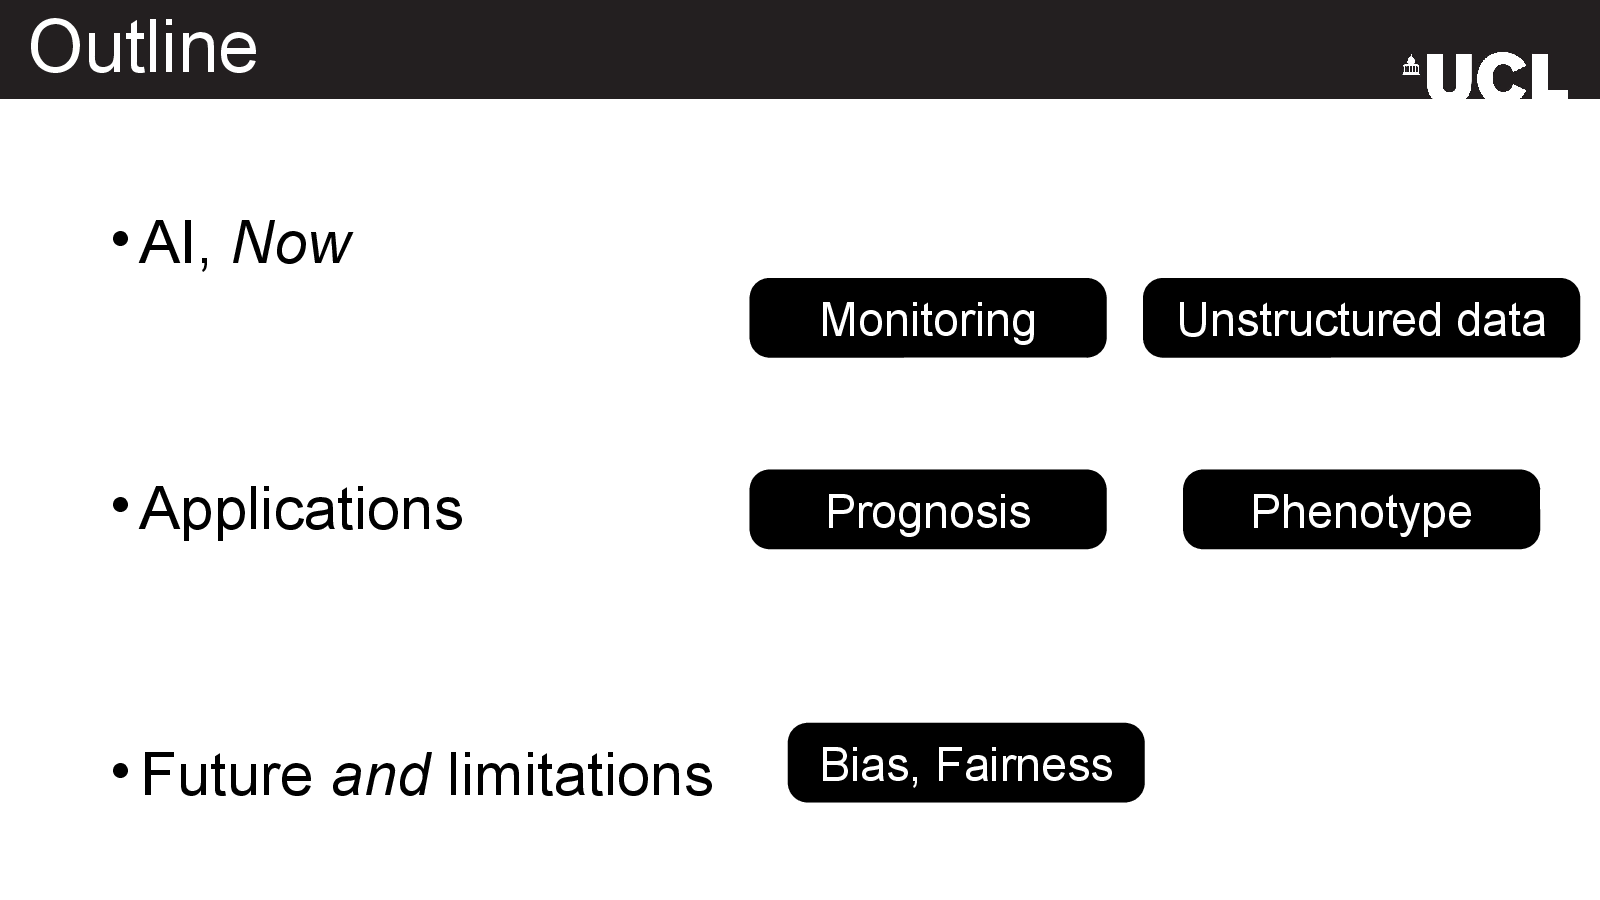
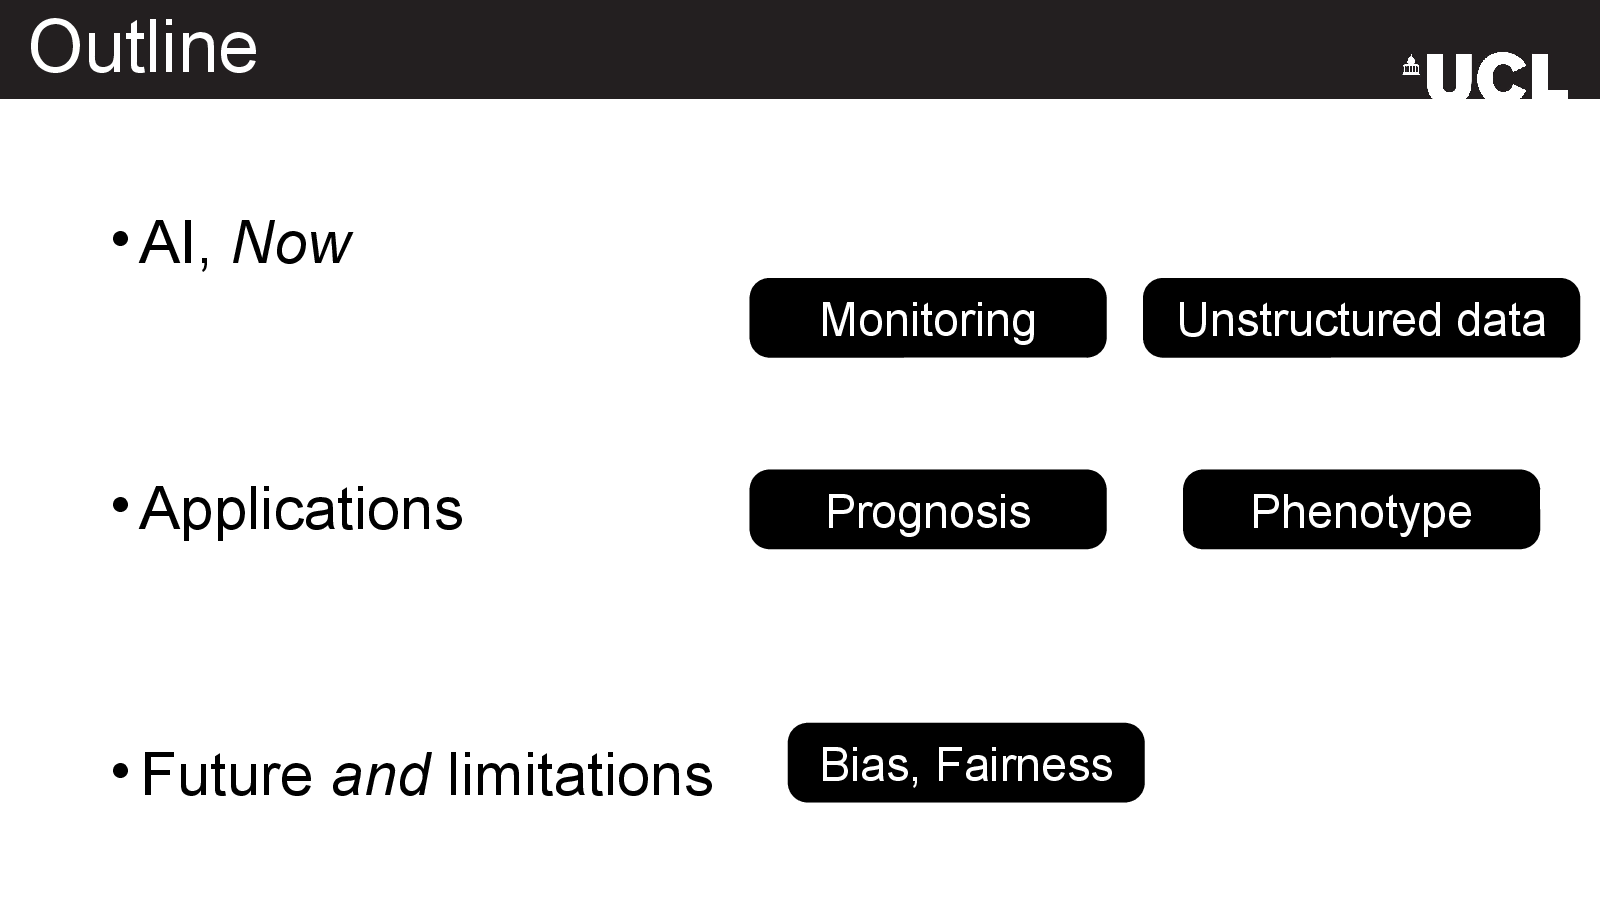
    Outline

    Slide 3: OutlineOpen full-size slide

    AI, Now

    Applications

    Future and limitations

    Monitoring

    Unstructured data

    Prognosis

    Phenotype

    Bias, Fairness

  4. Slide 13

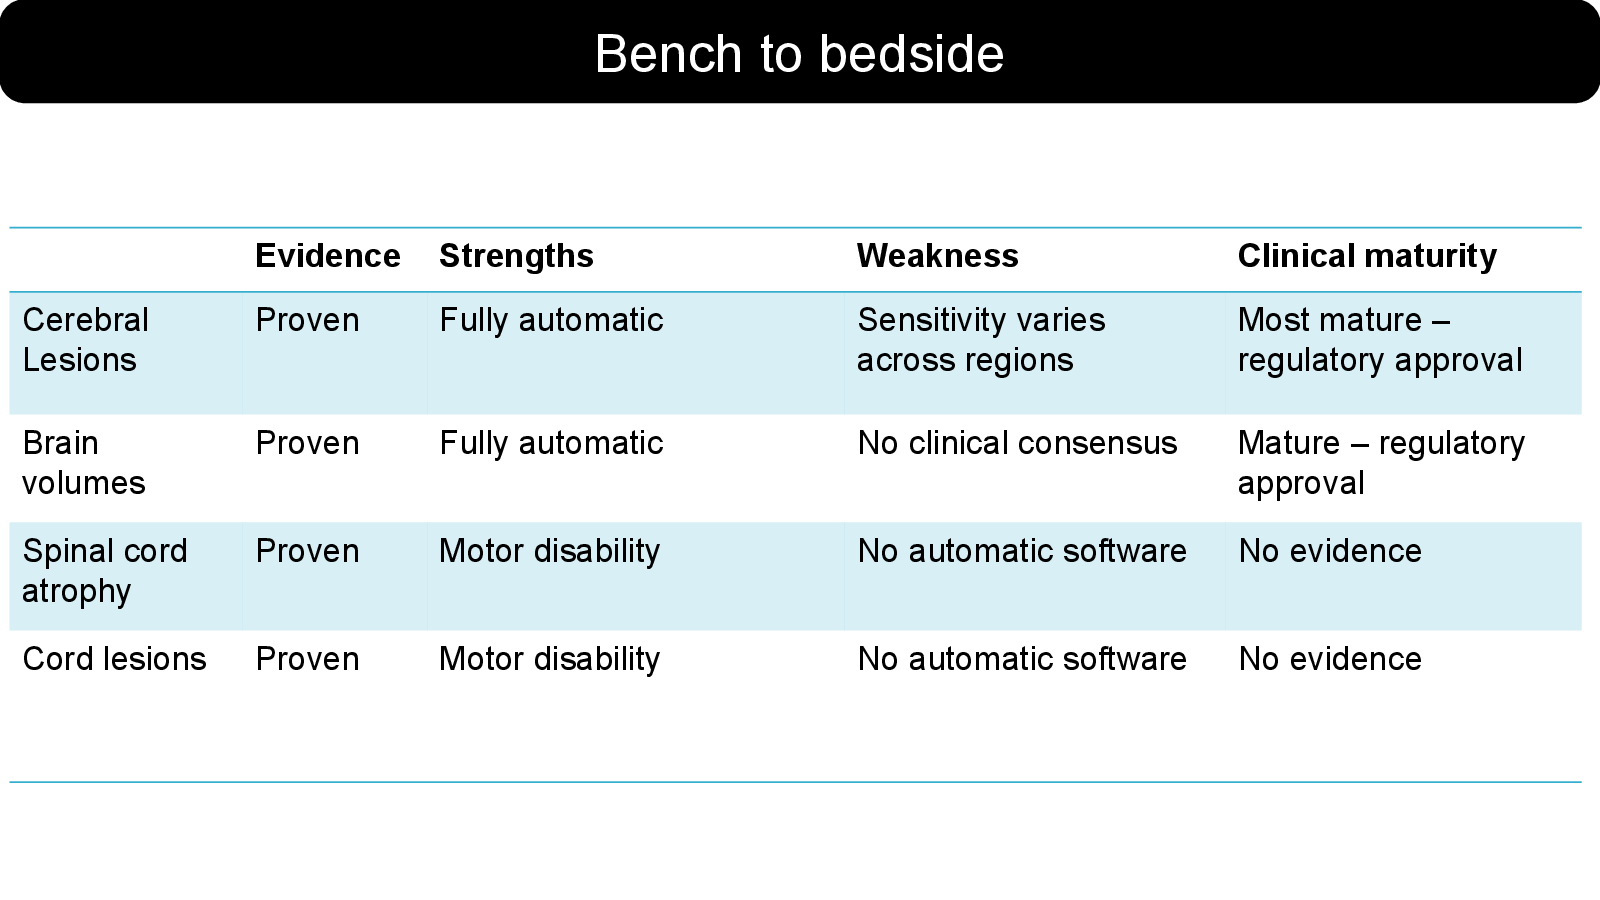
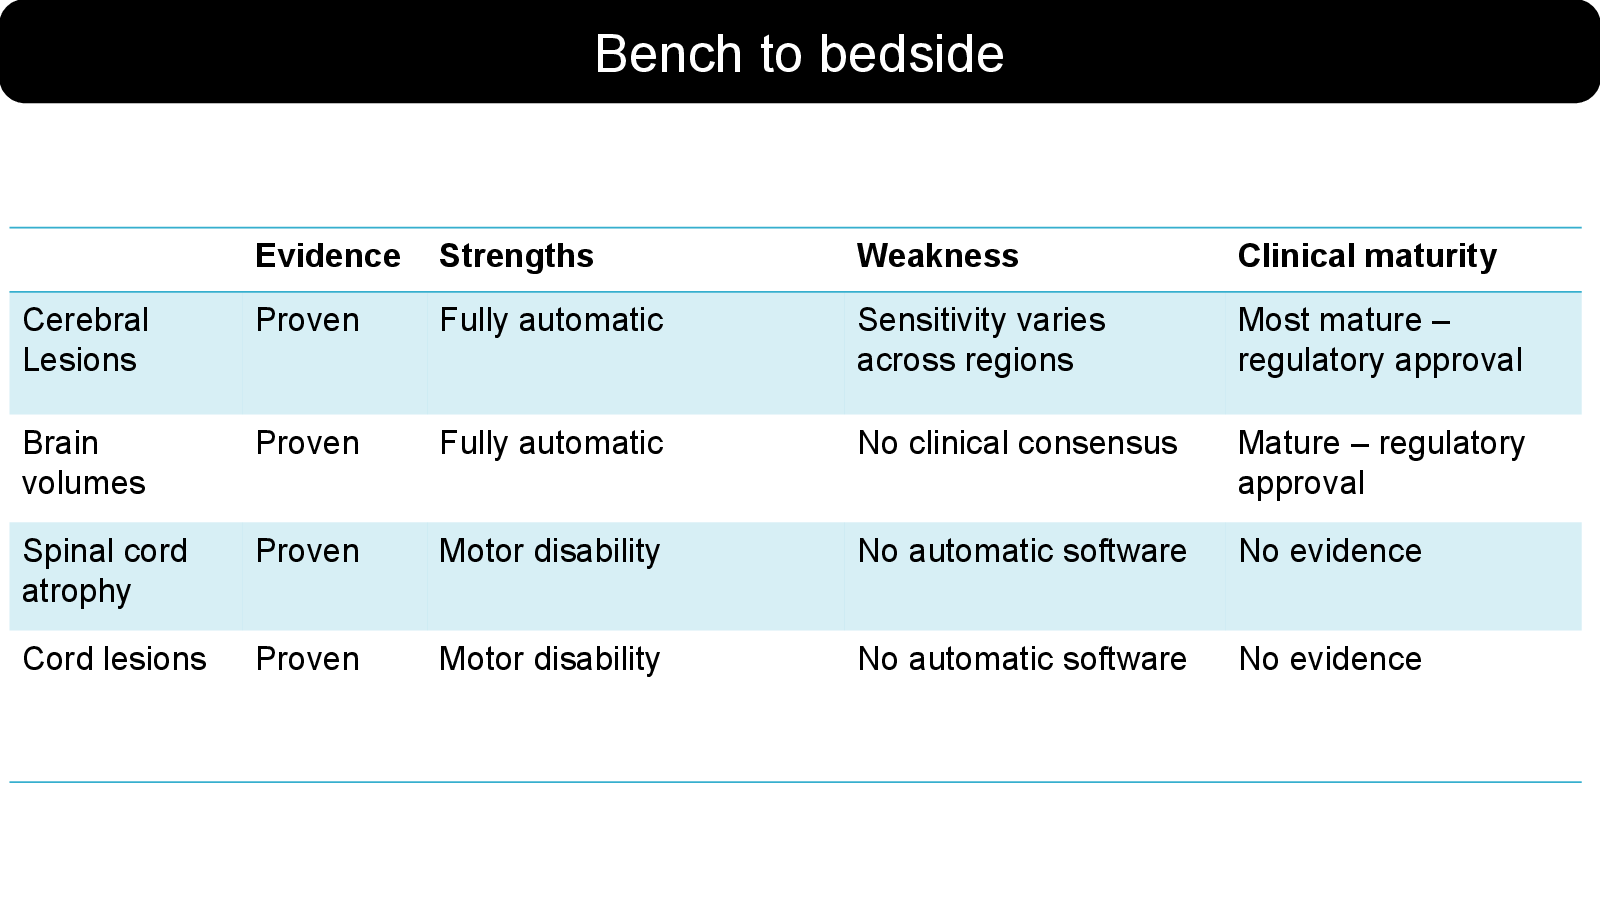
    Bench to bedside

    Slide 13: Bench to bedsideOpen full-size slide
    • Evidence — Strengths — Weakness — Clinical maturity
    • Cerebral Lesions — Proven — Fully automatic — Sensitivity varies across regions — Most mature – regulatory approval
    • Brain volumes — Proven — Fully automatic — No clinical consensus — Mature – regulatory approval
    • Spinal cord atrophy — Proven — Motor disability — No automatic software — No evidence
    • Cord lesions — Proven — Motor disability — No automatic software — No evidence
  5. Slide 16

    Slide 16

    Full image of slide 16Open full-size slide

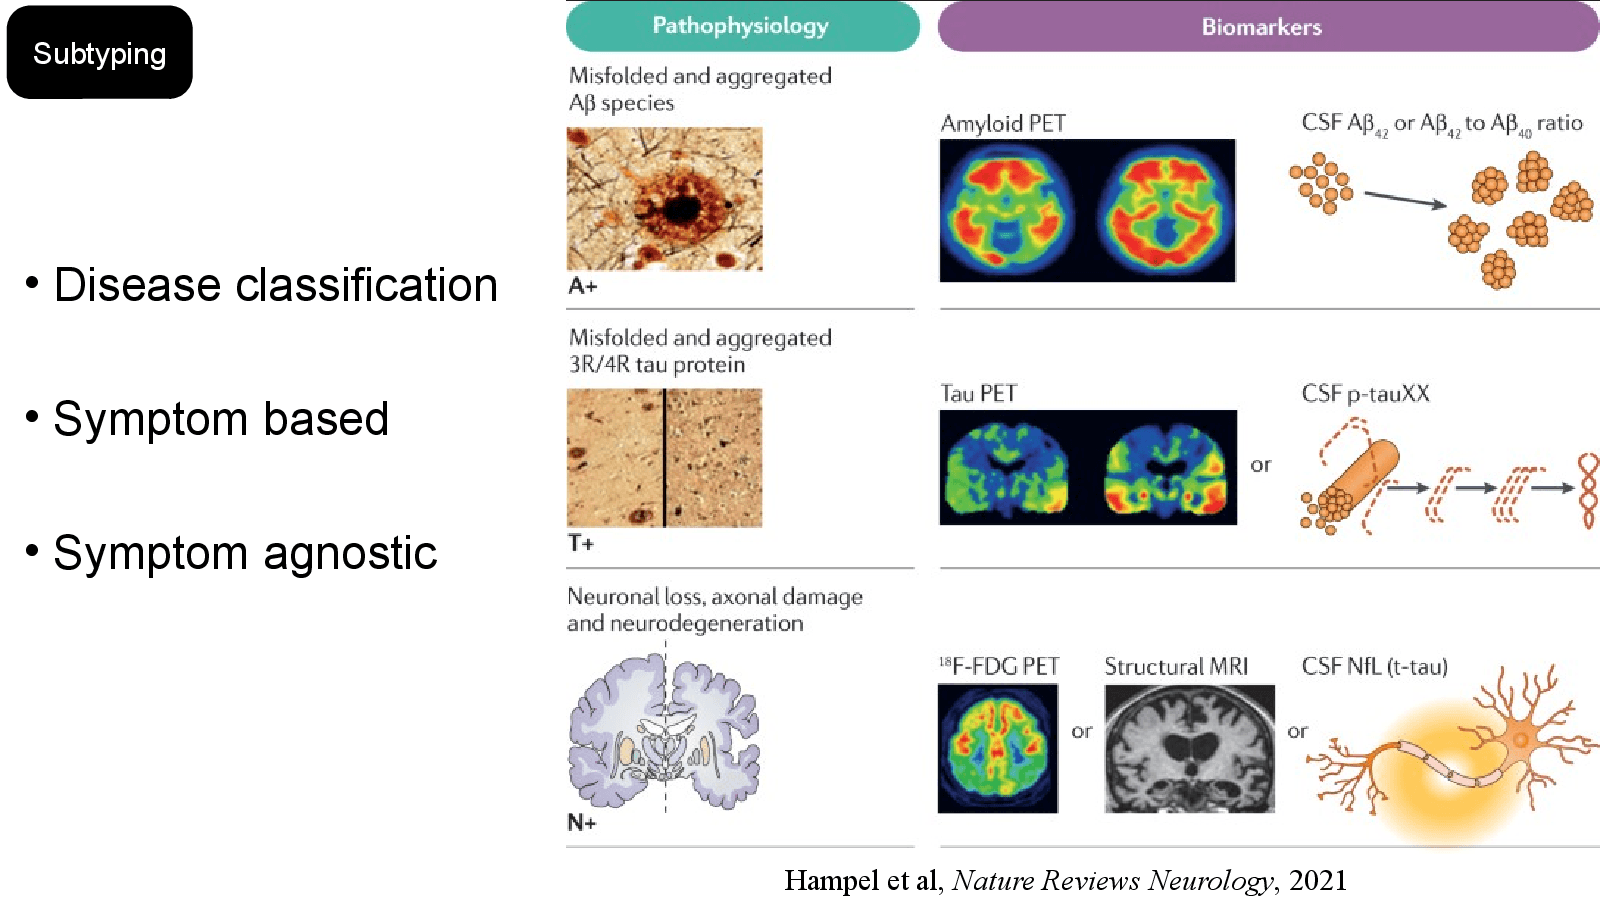
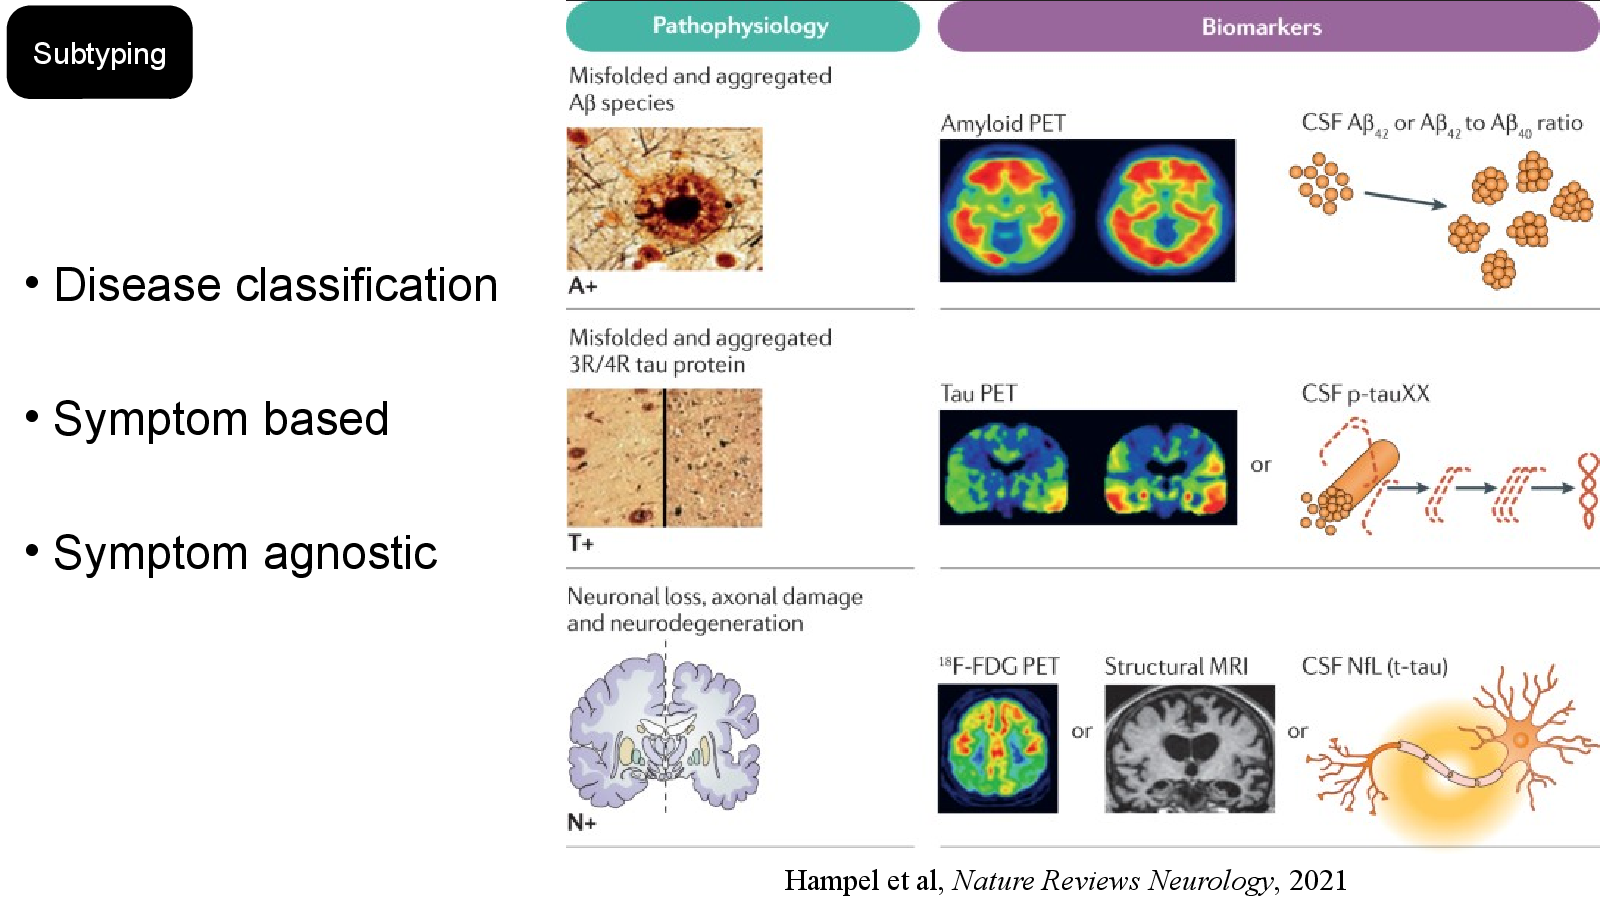
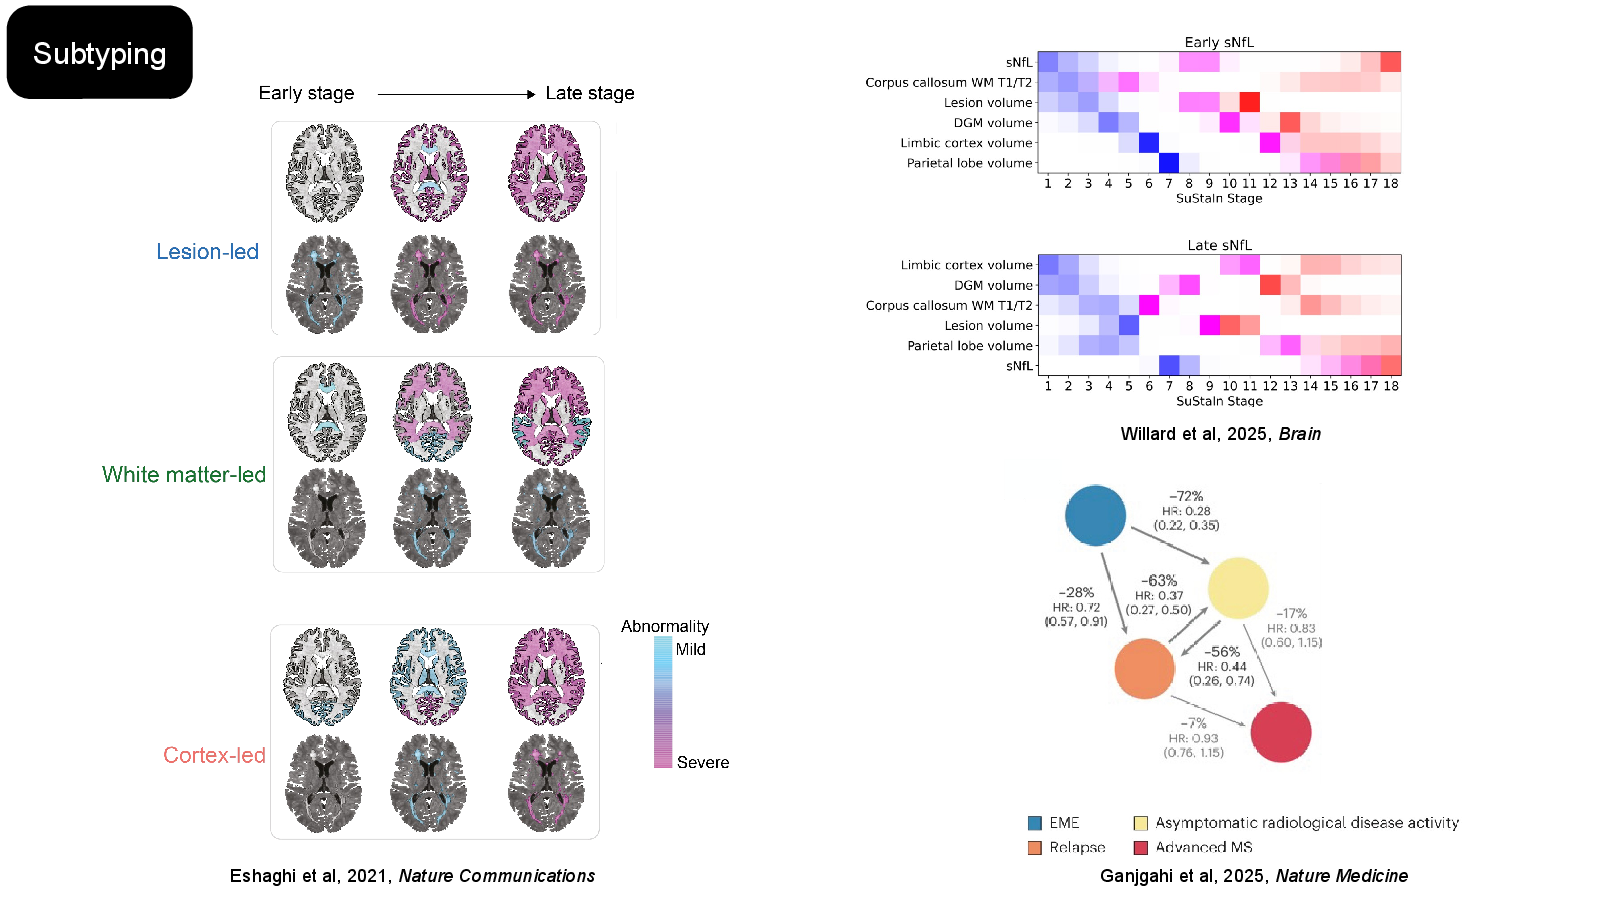
    Subtyping

    Speaker notes

    The effect size, expressed as mean difference in annual percentage cortical thickness change (MD-APC), is graphically displayed in different shades of blue for each of the Desikan-Killiany atlas25 regions presenting significant differences between groups after correction for multiple comparisons.

  6. Slide 17

    Eshaghi et al, 2021, Nature Communications
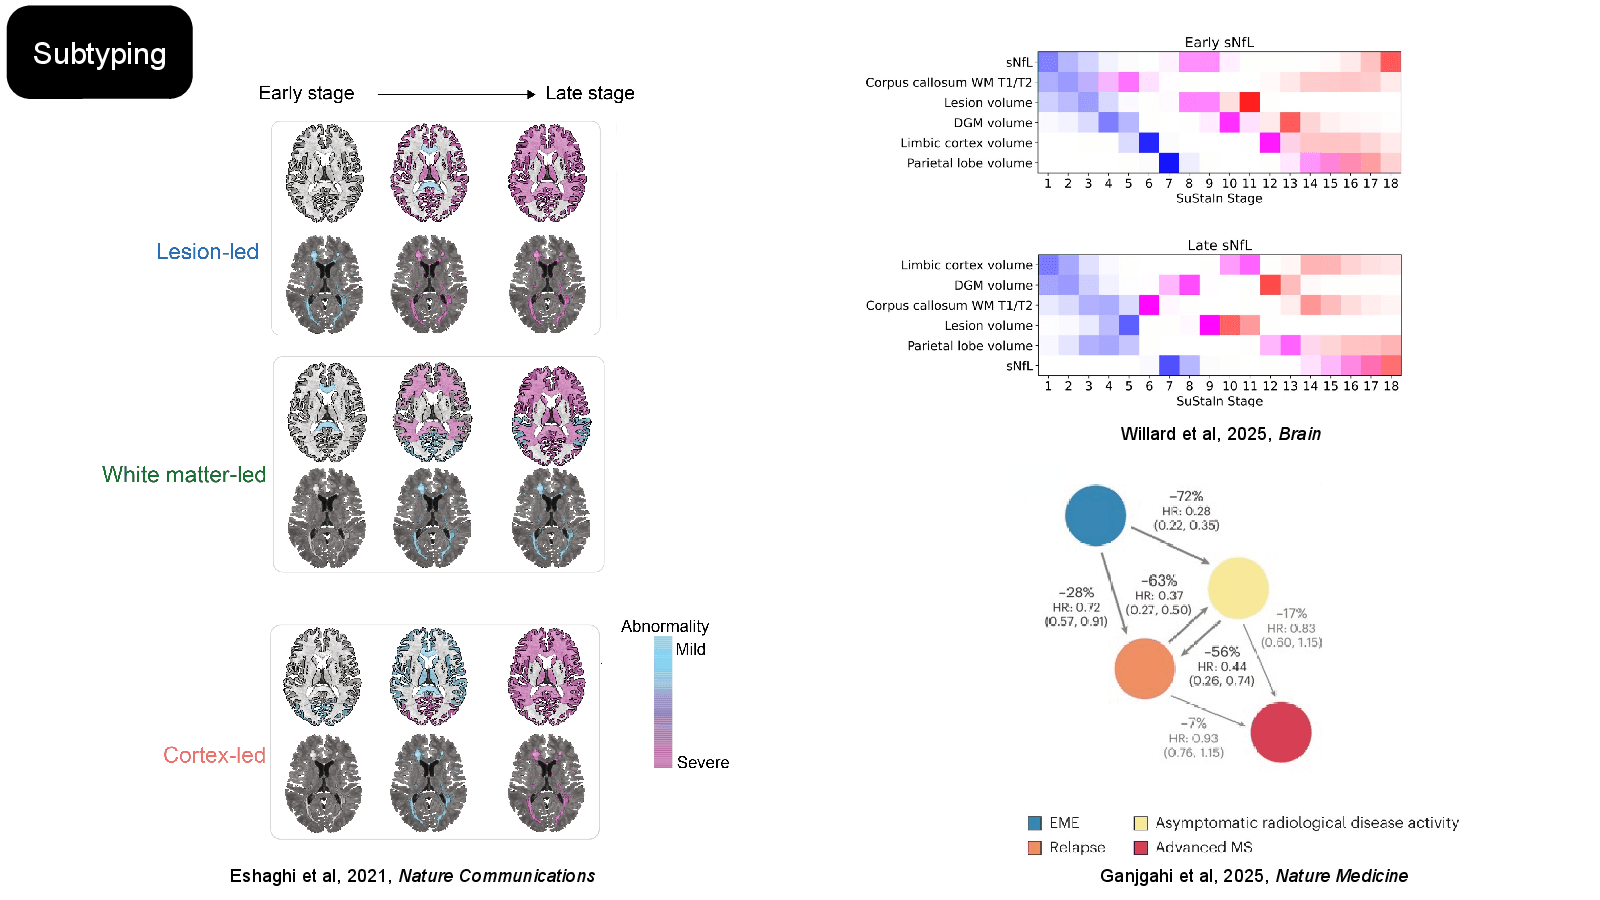
    Slide 17: Eshaghi et al, 2021, Nature CommunicationsOpen full-size slide

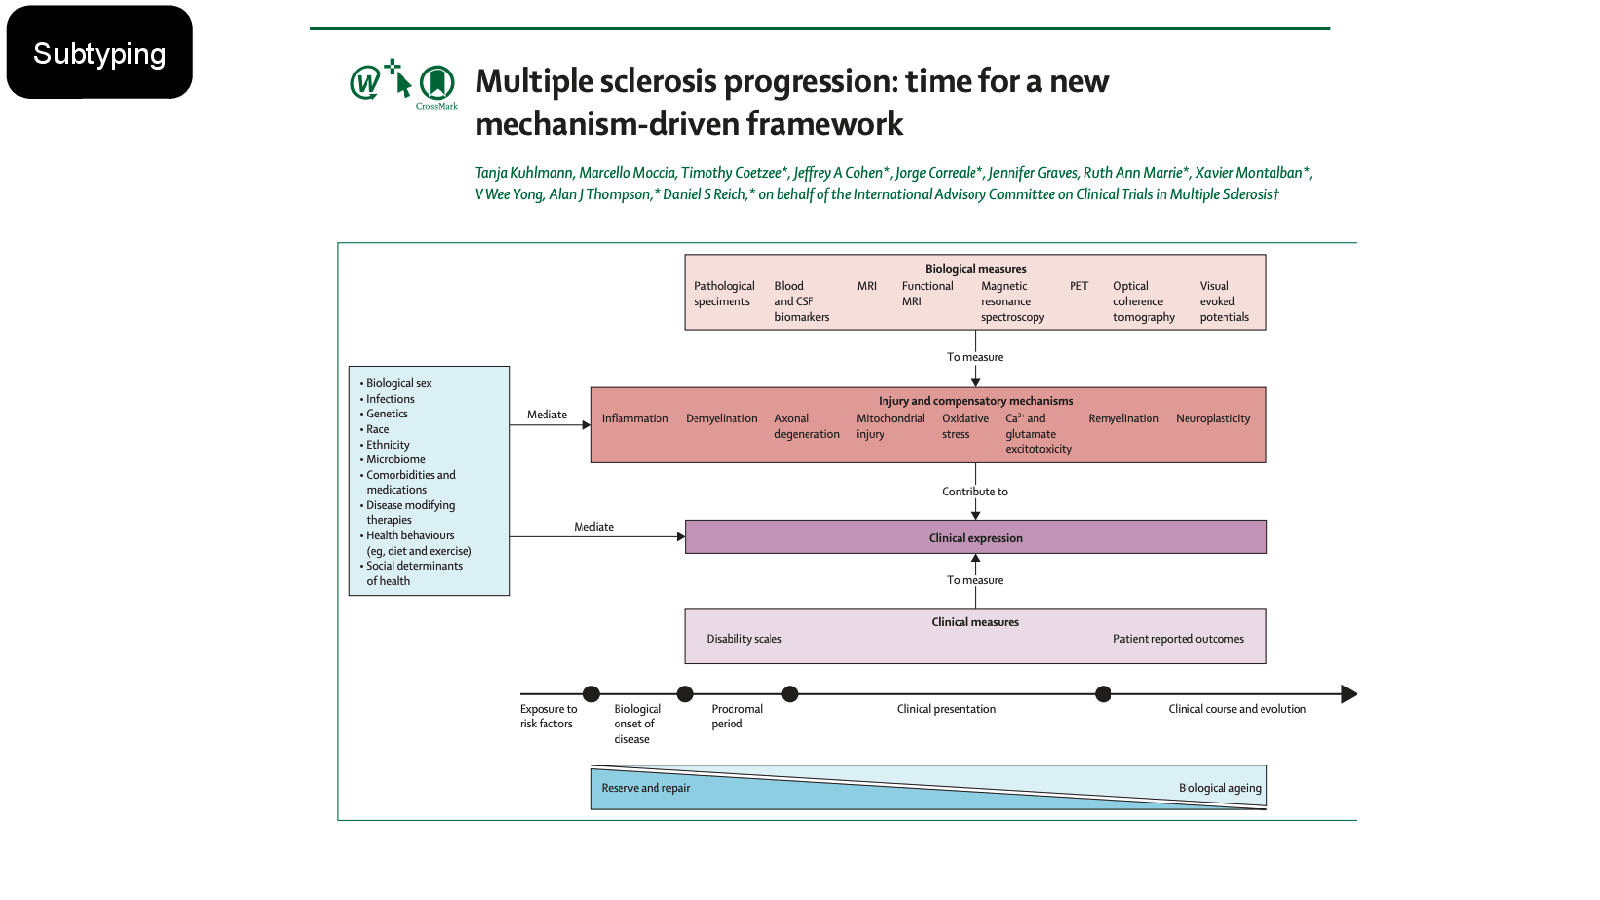
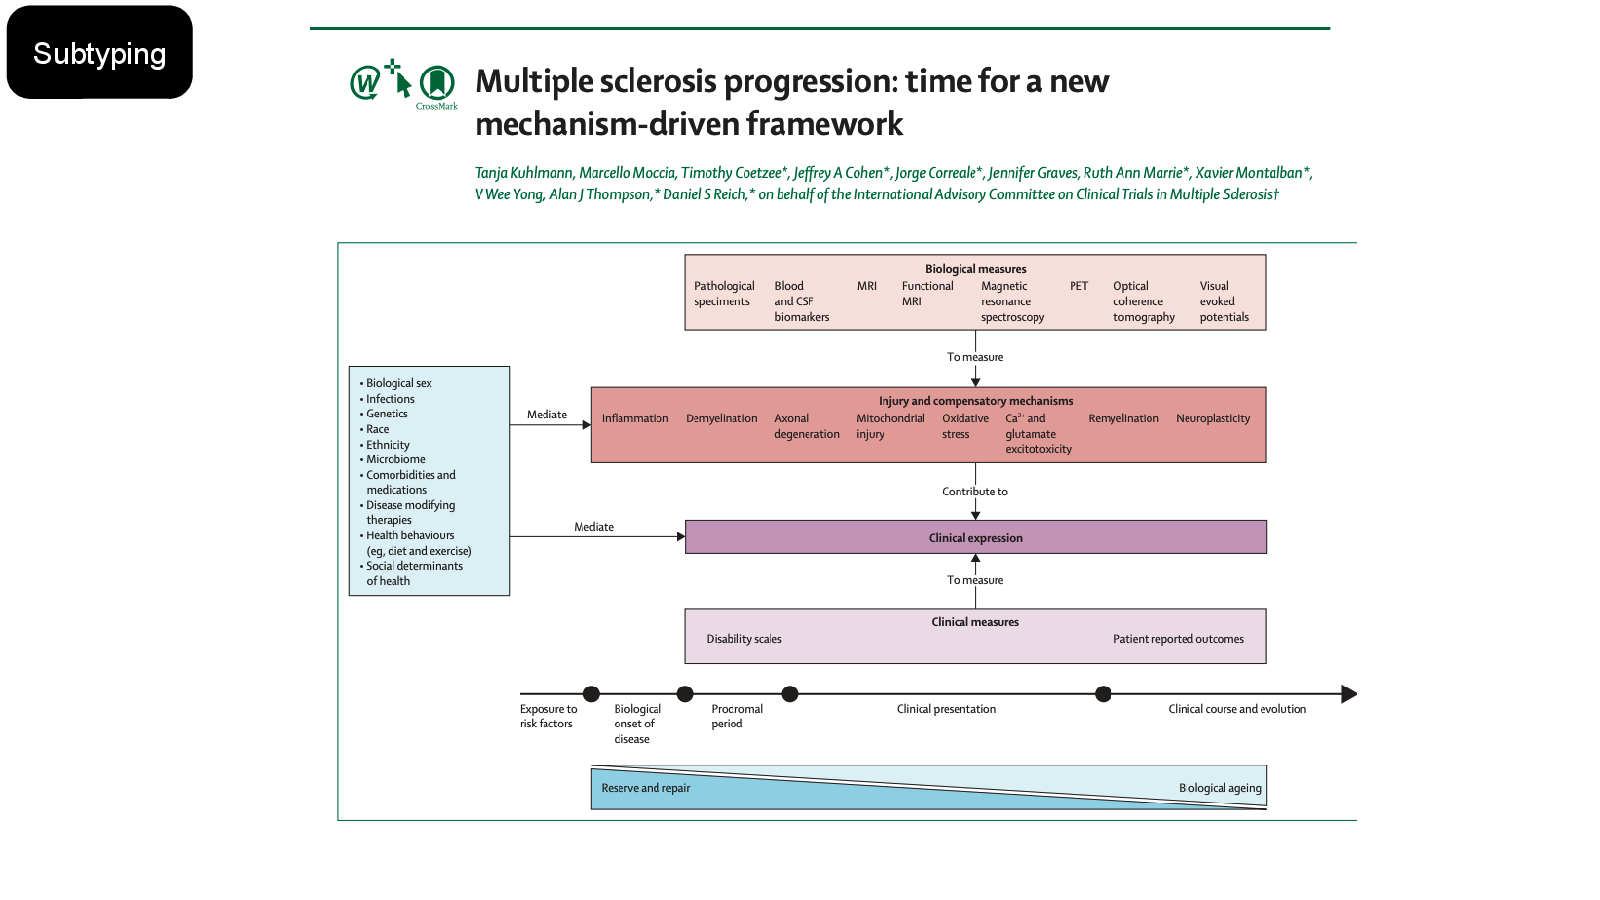
    Subtyping

    Willard et al, 2025, Brain

    Ganjgahi et al, 2025, Nature Medicine

    Speaker notes

    Gross et al. employed this method to uncover three groups based on immune cell markers in early MS, with different patterns in CD4, CD8 T cells, natural killer cell compartments, and cytokines[25]. These endotypes showed subtle variations in disease course and treatment response, suggesting potential future clinical applications

    References

  7. Slide 20

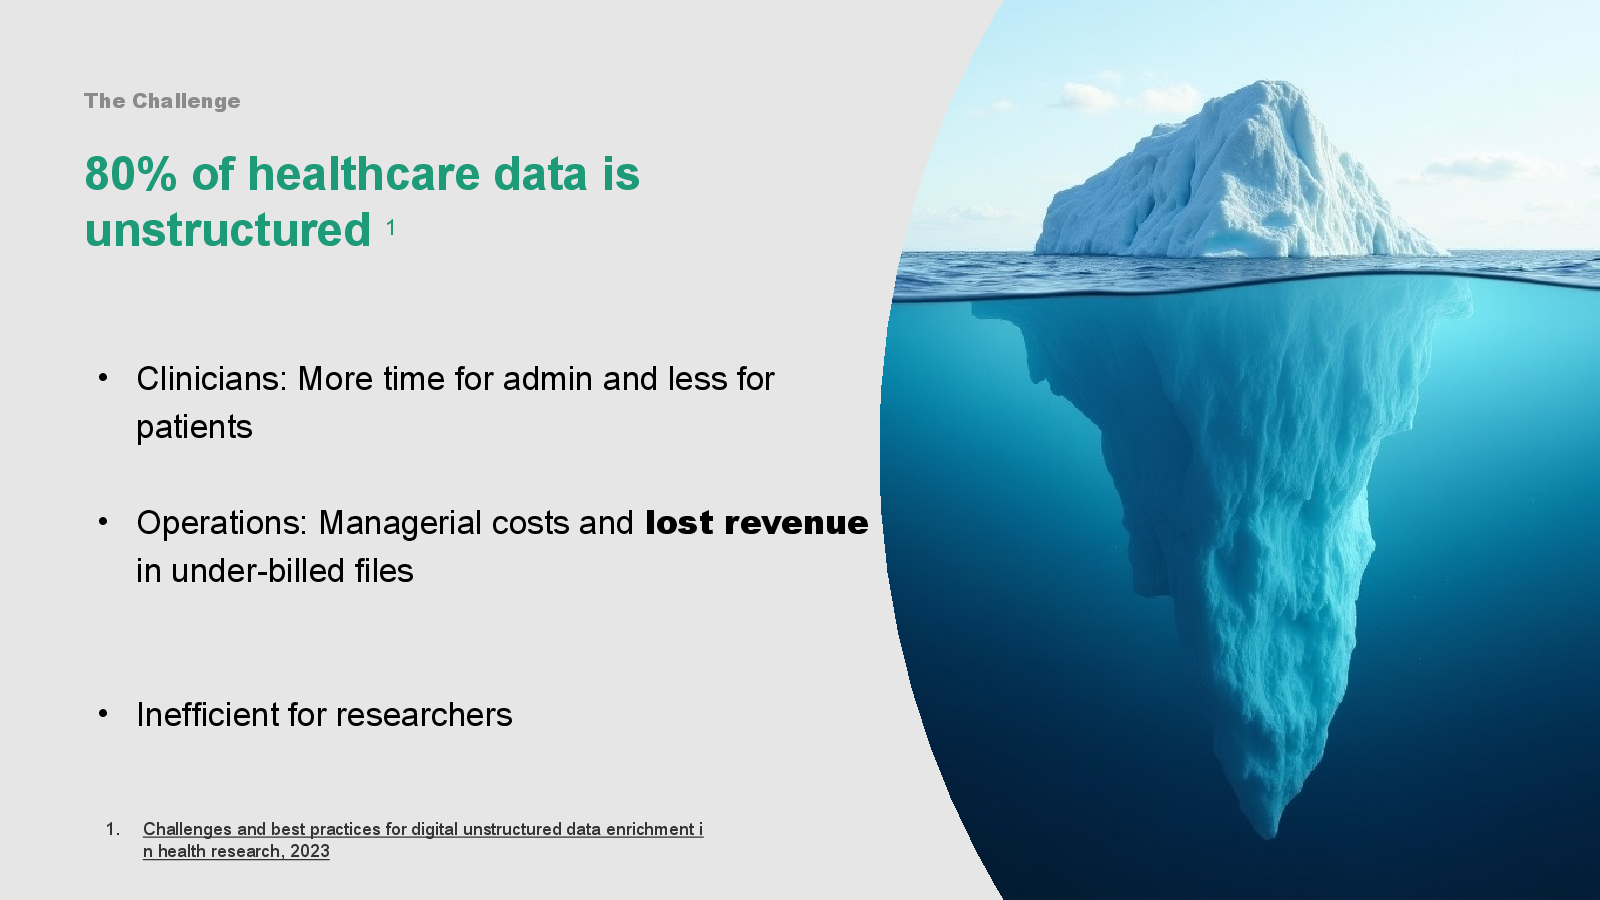
    80% of healthcare data is unstructured 1
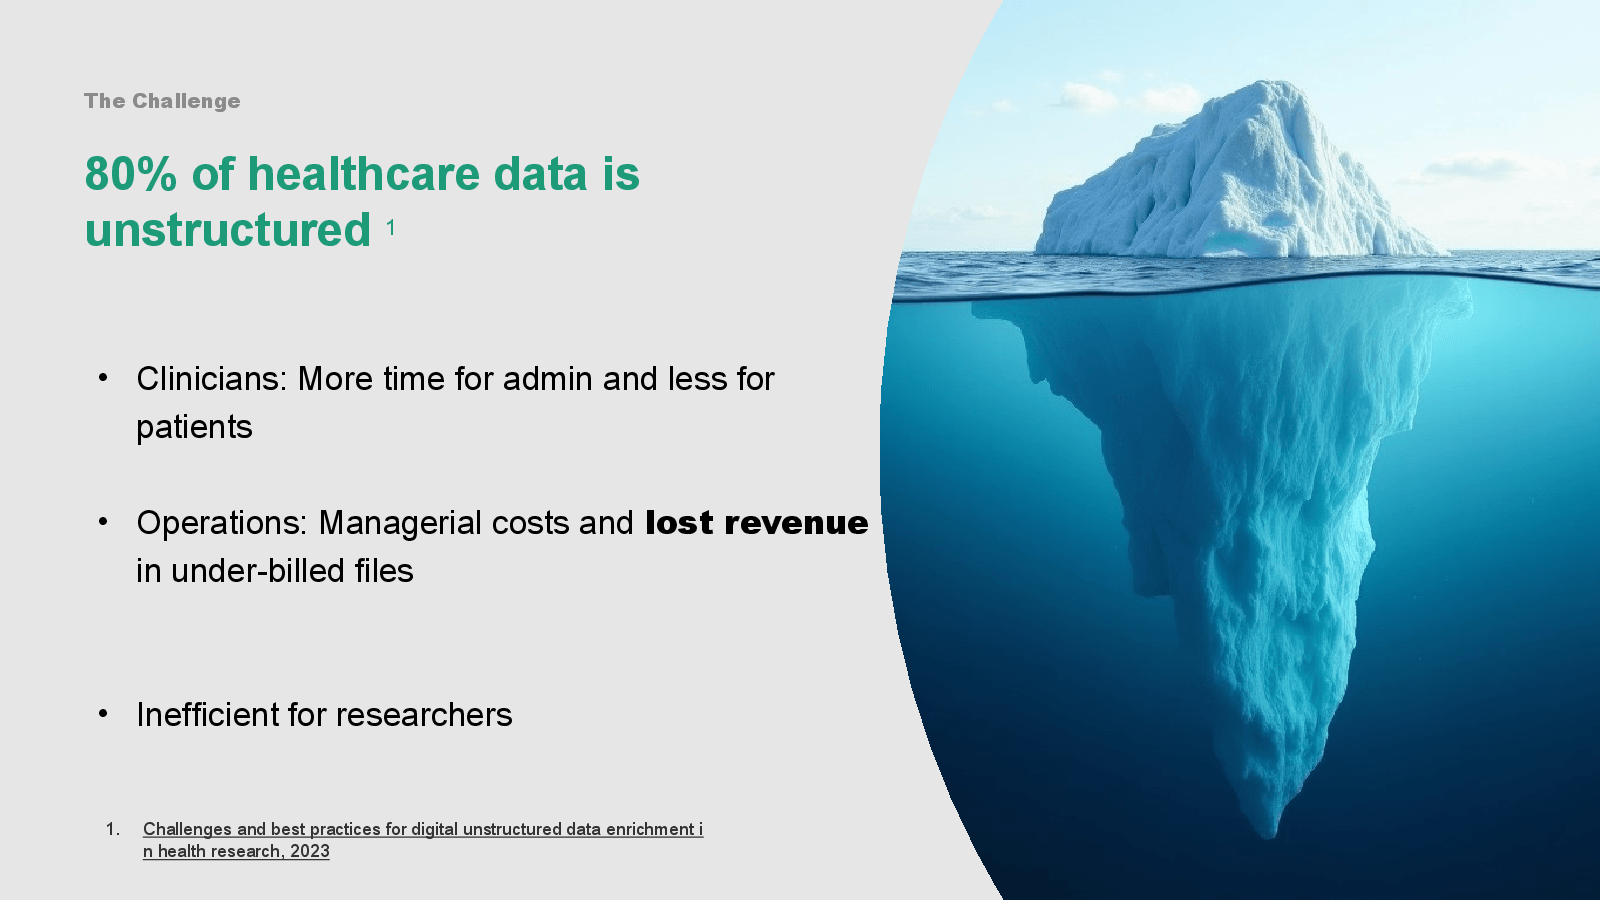
    Slide 20: 80% of healthcare data is unstructured 1Open full-size slide

    The Challenge

    Speaker notes

    So, its complex. But zooming back in on the data itself. 80% of healthcare data is unstructured clinical narrative. If we only look at structured data which is most of the data analysed in these previous data flows. We’re only seeing tip of the iceberg. So why is this unstructured data not utilised. Well, its lack of structure makes it difficult to store, standardise, integrate and deliver actionable insights. This affects the all parts of the healthcare delivery. Clinicians lack context, ops can’t optimise a process, and even finance can’t bill correctly.

  8. Slide 26

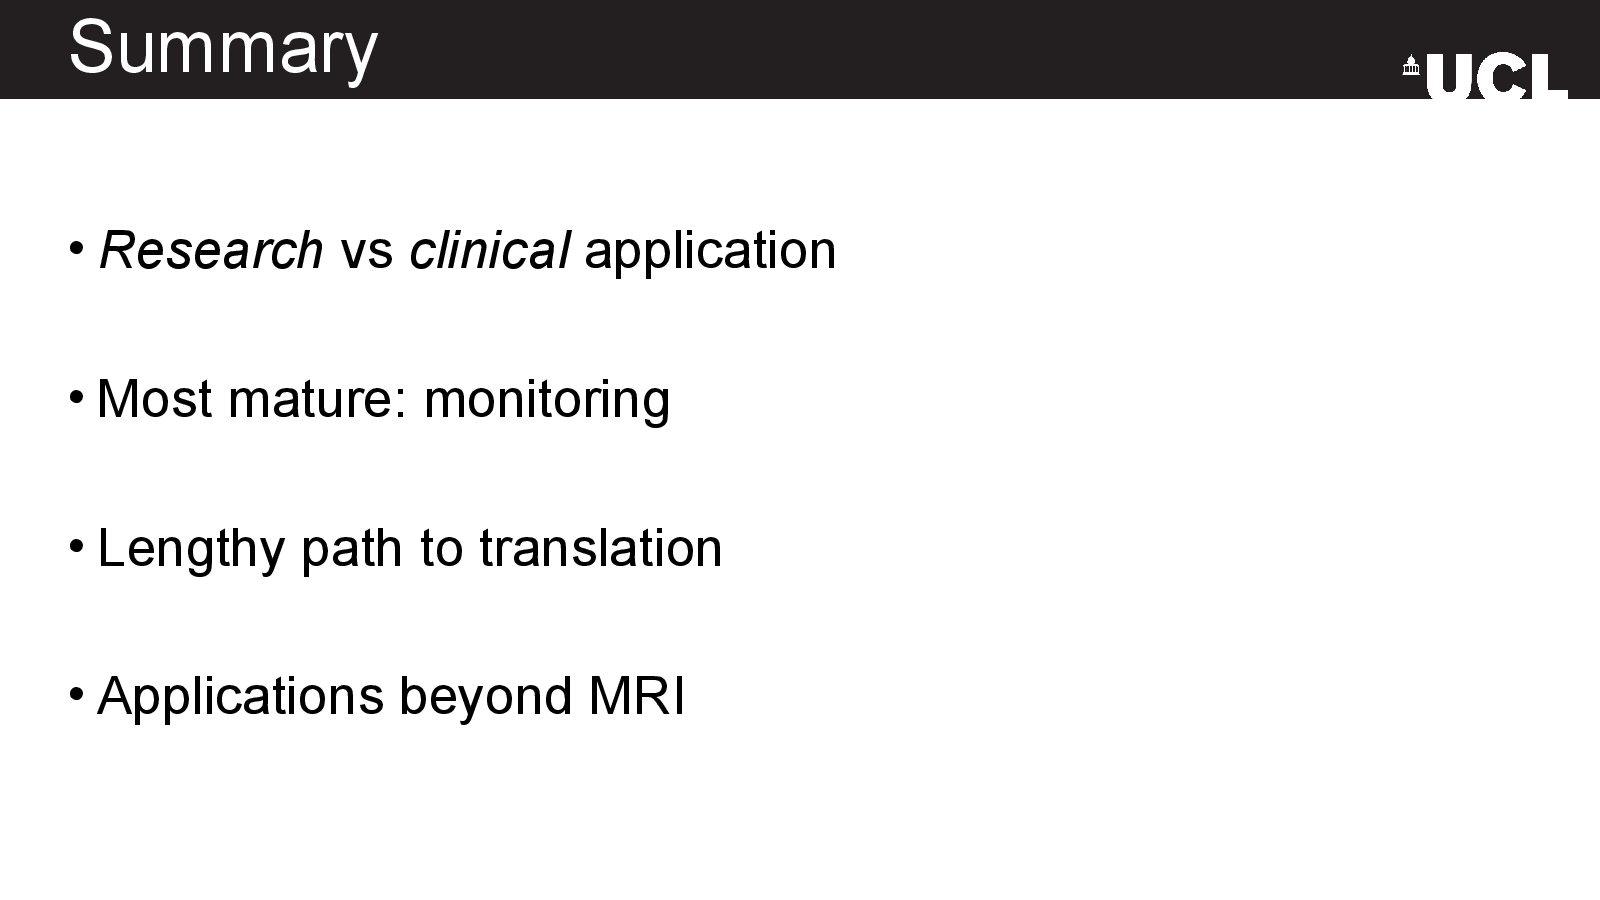
    Summary

    Slide 26: SummaryOpen full-size slide

    Research vs clinical application

    Most mature: monitoring

    Lengthy path to translation

    Applications beyond MRI